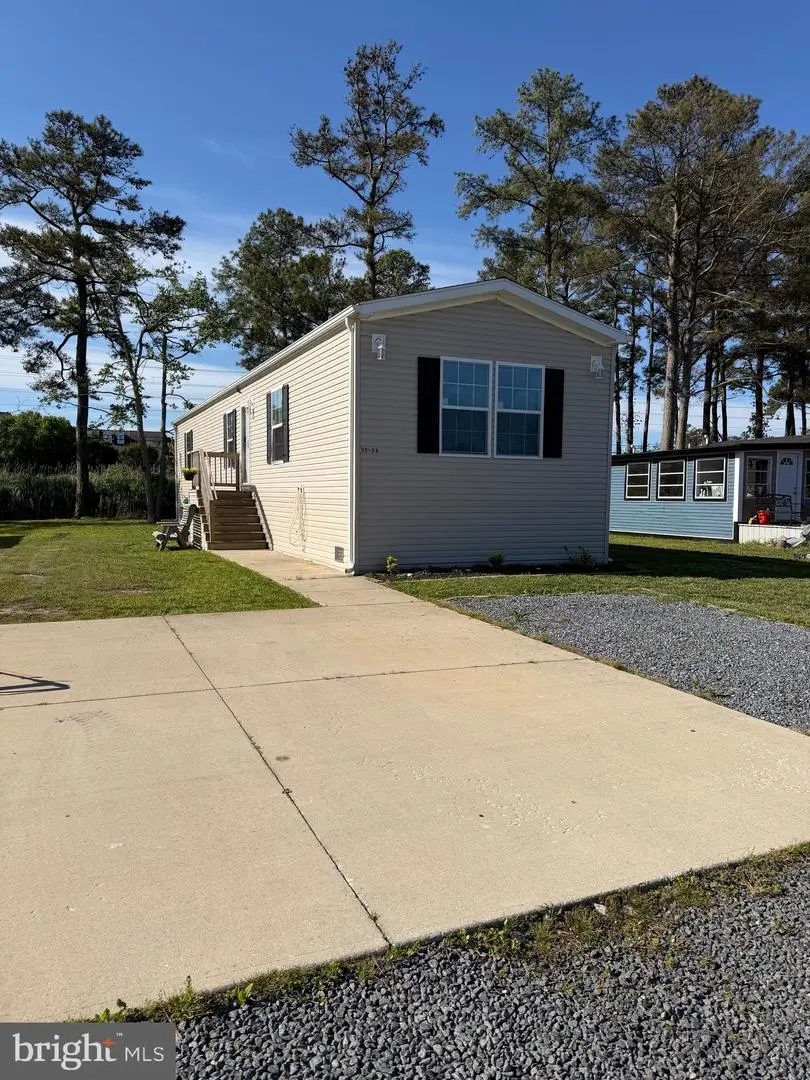
35454 Sussex Ln · Long Neck, DE
Flood risk 9/10 · Severe
- FEMA flood zone
- AE
- Chance of flooding over 30 yrs
- 0.99%
- Est. flood insurance / yr
- $2,026 – $9,024
Fire risk 1/10 · Minimal
- Est. fire insurance / yr
- $476 – $884
Heat risk 9/10 · Severe
- Hot days now (above 100°F)
- 7 days/yr
- Hot days in 30 yrs
- 19 days/yr
Wind risk 8/10 · Major
- Chance of severe wind over 30 yrs
- 80.0%
Air-quality risk 2/10 · Minimal
- Unhealthy air days now
- 1 days/yr
- Unhealthy air days in 30 yrs
- 1 days/yr
Risk factors via First Street. Map © Google.
Why this score? — see what drove the C+ grade
The composite is a weighted blend of 9 inputs, each scored 0–100. Each bar is that input's sub-score; the figure is the points it added to the 100-point composite (weight × sub-score).
- Cash flow +30.0/30.0
- 1% rule +10.0/10.0
- DSCR +10.0/10.0
- Condition / age +4.0/5.0
- Livability +3.5/5.0
- Schools +2.9/10.0
- Rent growth +2.5/5.0
- ARV discount +0.0/15.0
- Appreciation +0.0/10.0
$109,000
🖨 Deal sheet 📄 Offer letter ✓ Due diligence
Listing remarks
Enjoy coastal living in this well-maintained 3-bedroom, 2-bath single-wide home, located just 15 miles from the area's beautiful beaches. Situated in a desirable waterfront community, residents enjoy access to a boat ramp, swimming pool, clubhouse, and pavilion. Conveniently located near restaurants, shopping, and everyday amenities, this home offers the perfect blend of comfort, recreation, and accessibility. Whether you're looking for a full-time residence, vacation getaway, or investment opportunity, this property provides an excellent opportunity to enjoy the coastal lifestyle.
Key facts
- Pavilion
- Clubhouse
- Waterfront community
Tags
Property features AI
Finance
- Other: Fee simple ownership; Located outside city limits (Between Rt 1 & 113); No basement (no below-grade area)
- Financial info: Ground rent paid annually
Exterior
- Parking: 3 total garage/parking spaces; Driveway with room for 3 cars; Concrete driveway and crushed stone surfaces
- Utilities: Public water; Public sewer; Electric power
- Home design: Manufactured single-wide home; Estimated year built
- Construction: Vinyl siding; Architectural shingle roof; Building not winterized
- Exterior features: Community pool; Ground rent (annual payment; 2 years remaining)
Interior
- Bedrooms: 3 bedrooms on main level
- Flooring: Vinyl flooring; Carpet flooring
- Bathrooms: 2 full bathrooms on main level
- Heating & cooling: Electric heating; Electric cooling; Electric hot water
- Interior features: Drywall walls and ceilings; Very good condition
Neighborhood map
What this means for you Summary
Snapshot
- This is a 3-bed/2.0-bath single-family listed at $109k. Condition is rated good.
Deal economics
- At list price, monthly cash flow is $512 ($6k/yr) — positive.
- The deal already cash-flows at list — no discount required.
- Meets the 1% rule at list price ($2k rent vs $109k).
- Recommended offer: $107k (1.5% below list) — sets the bar for market timing.
- Cap rate 17.0% vs local median 3.2% in Long Neck — top-decile yield for the area; either an underpriced asset or a hidden risk that comps aren't pricing in. Stress-test before assuming the spread holds.
Location & tenants
- Location reads 69/100 on livability (#30 in DE) — a middle-class / working-renter tenant base. Strengths: cost of living A+, housing A+, crime A-; Watch: employment D+, schools F, amenities F.
- Indian River School District (rural): math 25% / reading 41% proficiency, ranked #14 of 26 in DE (top 54%) — families likely to look elsewhere, expect single-tenant / working-renter base with shorter leases.
- Market conditions: 865 active listings in the ZIP; solid renter incomes; 4,354 units permitted in Sussex County in 2024 (344 in 5+ unit buildings).
- This rent runs 33% of the median local income ($78k/yr) — at the standard rent-burdened threshold; future hikes will face affordability resistance.
Forward outlook
- Local home prices are declining (-3.0%/yr); year-one equity from $754 of loan paydown is wiped out by about $3k of value loss. Plan a longer hold.
- Sussex County population projected at +25% by 2050 — long-run rental-demand tailwind backs the buy-and-hold thesis.
- At projected returns (-3.0% appreciation + 3.0% rent growth), your $31k cash investment doubles in ~6 years — after that, you're playing with house money.
Negotiation context
- It's been on market 16 days — a 2% lower offer ($107k) is reasonable based on typical stale-listing flexibility.
Risks & watch-outs
- Watch-outs: flood insurance adds $460/mo.
- Climate carrying-cost: in FEMA flood zone AE (mandatory federal flood insurance); severe wind risk, 80% chance of damaging wind over 30y; extreme-heat days projected 7→19/yr by 2055 (HVAC capex compounding) — expect insurance premiums to compound above CPI over the hold.
Questions for the listing agent
- What's the actual annual flood-insurance premium (NFIP or private), and is the property in a SFHA with mandatory coverage?
- Is there a deadline driving the sale (1031 exchange, divorce, estate, relocation)? That informs how much negotiation room exists.
- Schools are F-rated, which usually means shorter tenancies and higher turnover. Who's the typical renter profile here, and what's been the actual vacancy rate?
- What's the average days-on-market for RENTAL listings here right now (not sales)? A rising rental-DOM trend means longer vacancies and softer asking-rent achievability than the comps imply.
- What's the recent tenant-quality profile in this submarket — average credit score on applications, eviction rate, late-payment / NSF rate, and stable-employment percentage? A property-management company in the area should have these aggregated.
- How much new for-sale + rental construction is in the pipeline within 1–3 miles? Heavy new supply typically softens prices + rents 12–24 months out; constrained supply supports both.
Investment metrics
- 1% rule
- 2.00% ✓
- Cap rate
- 17.00%
- Cash-on-cash
- 38.25%
- DSCR
- 2.70
- GRM
- 4.2
CMA / ARV
- ARV (on-the-fly)
- $79,730
- Comps found
- 12
Show comp detail 12 sales within ~0.75 mi
| Address | Dist | Beds/Ba | Sqft | Sold | Price | $/sf | Match |
|---|---|---|---|---|---|---|---|
| 35487 Joann Dr | 0.16mi | 3/1.0 | 900 (-4%) | 3mo | $54,000 | $60 | 80 |
| 35464 Knoll Way | 0.16mi | 3/2.0 | 1,056 (+13%) | 7mo | $89,900 | $85 | 65 |
| 35469 Joann Dr | 0.15mi | 2/1.0 (-1) | 840 (-10%) | 2mo | $30,500 | $36 | 65 |
| 35454 Knoll Way | 0.16mi | 3/2.0 | 1,056 (+13%) | 10mo | $103,000 | $98 | 63 |
| 35296 5th St #46027 | 0.21mi | 4/2.0 (+1) | 1,066 (+14%) | 4mo | $115,000 | $108 | 59 |
| 35716 E River Dr Unit A22 | 0.59mi | 3/2.0 | 1,012 (+8%) | 2mo | $340,000 | $336 | 57 |
| 35085 Cedar Ln #47276 | 0.69mi | 3/2.0 | 924 (-2%) | 10mo | $165,000 | $179 | 57 |
| 25879 Plum St #40082 | 0.61mi | 3/2.0 | 980 (+4%) | 11mo | $40,000 | $41 | 55 |
| 26204 Skip Jack Ln #49539 | 0.64mi | 2/2.0 (-1) | 924 (-2%) | 10mo | $67,000 | $73 | 54 |
| 35429 Barque Rd #46144 | 0.63mi | 2/2.0 (-1) | 1,008 (+8%) | 10mo | $79,900 | $79 | 44 |
| 35458 E River Dr | 0.71mi | 2/2.0 (-1) | 1,032 (+10%) | 7mo | $159,000 | $154 | 39 |
| 26933 White House Rd #15202 | 0.53mi | 2/1.0 (-1) | 809 (-14%) | 9mo | $45,000 | $56 | 36 |
Match score weights: distance 35% · size 25% · config 20% · recency 20%. Top-matched comps best support the ARV.
Projected returns pro-forma
-3.0% appreciation · 3.0% rent growth · sell at horizon
- IRR
- 12.6%
- Equity multiple
- 1.50×
- Total profit
- $15,290
- Equity at exit
- $16,252
- IRR
- 21.6%
- Equity multiple
- 2.86×
- Total profit
- $56,623
- Equity at exit
- $9,424
Cash invested: $30,520 (down + closing). Projections, not guarantees.
Landlord ↔ Tenant lean methodology
- Overall (STATE)
- 70 Landlord-Friendly
- State Delaware
- 70 Landlord-Friendly · D+7
- County
- — inherits STATE
- City
- — inherits STATE
ZIP-level market 19966
- Home prices YoY
- -6.4%
- Active inventory
- 865
- Price-to-rent
- 4.2×
Monthly cashflow live
- Estimated rent
- $2,185 medium interval (Pro) →
- Mortgage (P&I)
- −$572
- Tax est. 1.5%
- −$136 /mo · $1,635/yr
- Insurance
- −$45
- Flood insurance flood zone
- −$460 /mo · $5,525/yr
- HOA
- −$0
- Vacancy / Maint / Mgmt
- −$459
- Net cashflow
- $512
Break-even live
UW: 25.0% down · 7.5% · 30yr · 1.5% tax · 5.0% vac · 8.0% maint · 8.0% mgmt
Financing live
Cash to close
- Down payment
- $27,250
- Closing costs
- $3,270
- Reserves months
- —
- Total cash needed
- —
Loan-product check · same deal, 3 products live
Conventional
25% down · 7.5% · 30yr
- Down + closing
- —
- Monthly P&I
- —
- Monthly cashflow
- —
- DSCR
- —
- Eligible?
- —
Personal DTI + credit; lowest rate.
DSCR
20% down · 8.5% · 30yr
- Down + closing
- —
- Monthly P&I
- —
- Monthly cashflow
- —
- DSCR
- —
- Eligible?
- —
No personal income docs; deal must DSCR.
Hard money
10% down · 12.0% · 12mo
- Down + closing
- —
- Monthly P&I
- —
- Monthly cashflow
- —
- DSCR
- —
- Eligible?
- —
Short-term bridge; refi at stabilization.
Listing history 12 events
-
2026-06-18days on market $109,000 Active 16 DOM
-
2026-06-17days on market $109,000 Active 15 DOM
-
2026-06-16days on market $109,000 Active 14 DOM
-
2026-06-15days on market $109,000 Active 13 DOM
-
2026-06-14days on market $109,000 Active 11 DOM
-
2026-06-13days on market $109,000 Active 10 DOM
-
2026-06-10days on market $109,000 Active 8 DOM
-
2026-06-09days on market $109,000 Active 7 DOM
-
2026-06-08days on market $109,000 Active 6 DOM
-
2026-06-07days on market $109,000 Active 5 DOM
-
2026-06-03remarks 588-char remark
-
2026-06-03$109,000 Active 1 DOM
ⓘ Source: listings_history table (triggers on properties + properties_extension) + one-shot
backfill from property_details.listing_events for pre-trigger history.
Climate risk First Street
- Flood 9/10 Extreme FEMA zone AE · 99% chance over 30 yrs
- Wildfire 1/10 Low
- Heat 9/10 Extreme 7 d/yr ≥100°F today · 19 d/yr by 30 yrs out
- Wind 8/10 Severe 80% chance of damaging wind over 30 yrs
- Air quality 2/10 Low 1 unhealthy d/yr today · 1 by 30 yrs out
Nearby sold comps map
Loading sold comps map…
Walkable amenities ~0.75 mi
Loading nearby amenities…
Taxation est. · year 1
- Rental income
- $26,220
- − Mortgage interest
- −$6,106
- − Property taxes
- −$1,635
- − Insurance
- −$6,070
- − Repairs & maintenance
- −$2,098
- − Management
- −$2,098
- − Depreciation
- −$3,171
- Taxable income
- $5,043
- Est. tax owed @ 24.0%
- −$1,210
- After-tax cash flow
- $4,939/yr
For passive investors: Depreciation is non-cash, so a rental often shows a tax loss while cash-flowing — sheltering income. Rental losses are passive: they offset passive income freely, and up to $25,000/yr can offset ordinary (W-2) income if you actively participate and your MAGI is under $100k (phasing out to $0 by $150k); unused losses carry forward. On sale, claimed depreciation is recaptured at up to 25%, and gains may owe capital-gains tax (a 1031 exchange can defer both). Figures are a year-1 estimate at your 24.0% rate — not tax advice; consult a CPA.
Condition & rehab AI · 6 photos
This well-maintained single-wide home is located in a desirable waterfront community, offering easy access to amenities and a beautiful coastal lifestyle. With a few cosmetic updates, it can be ready for move-in and attract more potential buyers and renters.
Value-add opportunities
- Both Painting the exterior siding — Fresh paint can enhance the curb appeal and increase the home's value.
- Both Landscaping improvements — Well-maintained landscaping can improve the home's curb appeal and attract more potential buyers.
- Both Interior updates (e.g., new flooring, paint, and appliances) — Fresh updates can make the home more appealing to potential buyers and renters.
- Both HVAC maintenance and tune-up — A well-maintained HVAC system can improve comfort and energy efficiency, making the home more attractive to potential buyers and renters.
- Both Landscaping and curb appeal improvements — Well-maintained landscaping and curb appeal can improve the home's curb appeal and attract more potential buyers and renters.
Renovation cost estimate screening
Value-add ROI direction
- Both Painting the exterior siding — Fresh paint can enhance the curb appeal and increase the home's value. ↑
- Both Landscaping improvements — Well-maintained landscaping can improve the home's curb appeal and attract more potential buyers. ↑
- Both Interior updates (e.g., new flooring, paint, and appliances) — Fresh updates can make the home more appealing to potential buyers and renters. ↑
- Both HVAC maintenance and tune-up — A well-maintained HVAC system can improve comfort and energy efficiency, making the home more attractive to potential buyers and renters. ↑
- Both Landscaping and curb appeal improvements — Well-maintained landscaping and curb appeal can improve the home's curb appeal and attract more potential buyers and renters. ↑
ⓘ Cost ranges are severity-bucket heuristics (US national rule-of-thumb). Get contractor quotes + a written scope before underwriting a rehab budget.
Schools (NCES district)
- District
- Indian River School District
- NCES district ID
- 1000680
- Math proficiency
- 25% ▼ -27.00%
- Reading proficiency
- 41% ▼ -17.00%
- Median HH income
- $53,838
- Composite
- 28.99/100
- National rank
- #6620
- State rank
- #14 of 26 in DE
Livability — Long Neck
- Score
- 69/100
- State rank
- #30
- US rank
- #8720
Category grades
Schools grade is shown separately in the Schools card above.
Census & demographics
- County
- Sussex County · 82,708 people
- Metro
- Salisbury, MD-DE
- Population (ZIP)
- 35,884
- Household income
- $78,305
- Rent vs Own
- Severe rent burden
- 464.0
Population outlook (Sussex County) Hauer SSP2
- Today (2025)
- 248,853 people
- By 2030
- 264,464 · +6.3%
- By 2040
- 290,980 · +16.9%
- By 2050
- 311,259 · +25.1%
- By 2075
- 352,488 · +41.6%
- By 2100
- 367,406 · +47.6%
Race, ethnicity, and origin ACS 2023
- Neighborhood character
- Predominantly White (74%)
- Race & ethnicity
- White 74% Hispanic / Latino 11% Black 8% Two or more races 7% Native American 3% Asian 1%
- Hispanic origin (detail)
- Mexican 3%
- Common ancestry
- Romanian 4% Slovak 2% Serbian 1%
- Foreign-born
- 8% · Canada, China
- Languages at home
- 88% English-only · Spanish 9% Other Indo-European 1%
Political lean MEDSL · Sussex
- 2024 margin
- R (+11.0) · D 43.9% · R 54.9% · Other 1.2%
- 2008→2024 swing
- -2.4pp toward R · 2008: -8.6pp · 2024: -11.0pp
- All cycles
- 2024: R+11.0 2020: R+11.2 2016: R+22.0 2012: R+13.0 2008: R+8.6
Not yet ingested
- Civics
- —
Market trends
- HPI YoY
- ▼ -18.26%
- Current HPI
- 268.5609
- Rent YoY
- —
- Metro
- Salisbury, MD-DE
- State GDP YoY
- —
- F500 in state
- 0
Price history
1 event — show timeline
- 2026-06-02 Listed $109,000 BRIGHT MLS
Cash-flow waterfall
monthlySold comps — $/sqft
last 12 mo · ≤1 miLoading sold comps…