3357 W Mayaguana Ln · Seminole Manor, FL
Flood risk 2/10 · Minimal
- FEMA flood zone
- X (unshaded)
- Chance of flooding over 30 yrs
- 0.09%
- Est. flood insurance / yr
- $507 – $1,088
Fire risk 1/10 · Minimal
- Est. fire insurance / yr
- $947 – $1,759
Heat risk 9/10 · Severe
- Hot days now (above 105°F)
- 6 days/yr
- Hot days in 30 yrs
- 22 days/yr
Wind risk 10/10 · Severe
- Chance of severe wind over 30 yrs
- 99.0%
Air-quality risk 2/10 · Minimal
- Unhealthy air days now
- 0 days/yr
- Unhealthy air days in 30 yrs
- 2 days/yr
Risk factors via First Street. Map © Google.
Why this score? — see what drove the B- grade
The composite is a weighted blend of 9 inputs, each scored 0–100. Each bar is that input's sub-score; the figure is the points it added to the 100-point composite (weight × sub-score).
- Cash flow +27.6/30.0
- 1% rule +10.0/10.0
- DSCR +9.7/10.0
- ARV discount +7.5/15.0
- Schools +4.3/10.0
- Condition / age +4.0/5.0
- Rent growth +3.5/5.0
- Livability +3.2/5.0
- Appreciation +0.0/10.0
$109,000
🖨 Deal sheet 📄 Offer letter ✓ Due diligence
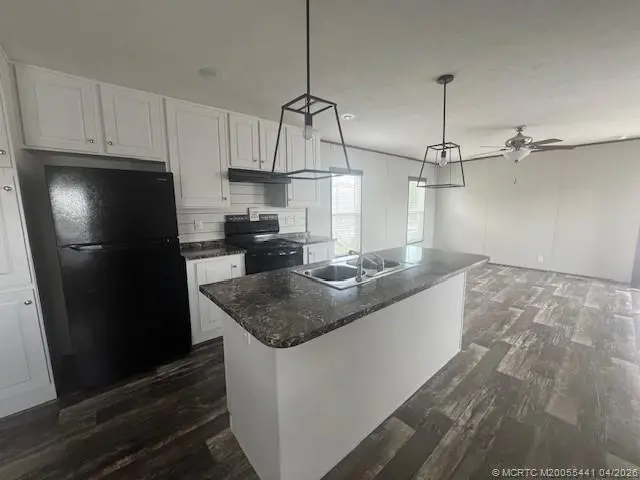
Listing remarks
Just Listed ! All age gated community , this home has 3 bedrooms and 2 baths , large yard , with parking for multiple cars . Built in 2022 , Laminate flooring thru out , Center Island in the kitchen , Laundry room with high end washer and dryer , open floor plan , master bedroom split from bedrooms 2 and 3 . Community offers a Clubhouse , Pool, Playground , Basketball Court , Billiards room , Fitness Center, Library, Laundry Facilities, RV Storage , Pet friendly .
Key facts
- 4,356 sq ft lot
- 3 parking spots
- Community pool
Property features AI
Finance
- Other: Pets allowed (with number and size limits)
- HOA & community: Homeowners association (monthly fee around $965); HOA covers common areas, laundry, grounds maintenance, pools, recreation facilities, taxes, and trash; Community amenities include clubhouse, fitness center, pool, playground, basketball court, billiard room, library, shuffleboard, gated entry, and laundry facilities
Exterior
- Parking: 3 total parking spaces; 3 covered parking spaces
- Utilities: Electricity connected
- Home design: Manufactured home; Single-story
- Construction: Manufactured construction; Resale property
- Exterior features: Community pool; Lot approximately 0.1 acre
Interior
- Bathrooms: 2 full bathrooms
- Heating & cooling: Central heating; Central air conditioning
- Interior features: Unfurnished
Neighborhood map
What this means for you Summary
Snapshot
- This is a 3-bed/2.0-bath manufactured listed at $109k. Condition is rated good.
Deal economics
- At list price, monthly cash flow is $324 ($4k/yr) — positive.
- The deal already cash-flows at list — no discount required.
- Meets the 1% rule at list price ($3k rent vs $109k).
- Recommended offer: $106k (3.0% below list) — sets the bar for market timing.
Location & tenants
- Location reads 63/100 on livability (#711 in FL) — a middle-class / working-renter tenant base. Strengths: crime A+, housing A+, cost of living A; Watch: amenities F, commute F, employment F.
- Palm Beach (suburban): math 46% / reading 53% proficiency, ranked #34 of 73 in FL (top 47%) — families likely to look elsewhere, expect single-tenant / working-renter base with shorter leases.
- Market conditions: Rents rising fast (+4.1%/yr); 383 active listings in the ZIP; 32 comparable units currently listed for rent nearby; rentals at typical pace (median 22d on market — plan ~3-4 weeks tenant-placement turnaround); 3,974 units permitted in Palm Beach County in 2024 (1,012 in 5+ unit buildings).
- This rent runs 42% of the median local income ($74k/yr) — at the standard rent-burdened threshold; future hikes will face affordability resistance.
Forward outlook
- Local home prices are declining (-3.0%/yr); year-one equity from $754 of loan paydown is wiped out by about $3k of value loss. Plan a longer hold.
- Palm Beach County population projected at +30% by 2050 — long-run rental-demand tailwind backs the buy-and-hold thesis.
- At projected returns (-3.0% appreciation + 4.1% rent growth), your $31k cash investment doubles in ~8 years — after that, you're playing with house money.
Negotiation context
- It's been on market 52 days — a 3% lower offer ($106k) is reasonable based on typical stale-listing flexibility.
Risks & watch-outs
- Watch-outs: HOA is 37% of rent.
- Climate carrying-cost: severe wind risk, 99% chance of damaging wind over 30y; extreme-heat days projected 6→22/yr by 2055 (HVAC capex compounding) — expect insurance premiums to compound above CPI over the hold.
Questions for the listing agent
- It's been on market 52 days. Have you received any prior offers? Is the seller open to a 3% concession, seller financing, or rate buy-down credit?
- What does the HOA fee cover, when was the last increase, and are there any pending special assessments or reserve-fund shortfalls?
- Is there a deadline driving the sale (1031 exchange, divorce, estate, relocation)? That informs how much negotiation room exists.
- Schools are B-rated — typically a magnet for longer-tenancy family renters. What's the average tenant stay here, and is there a school-zone premium baked into asking?
- What's the average days-on-market for RENTAL listings here right now (not sales)? A rising rental-DOM trend means longer vacancies and softer asking-rent achievability than the comps imply.
- What's the recent tenant-quality profile in this submarket — average credit score on applications, eviction rate, late-payment / NSF rate, and stable-employment percentage? A property-management company in the area should have these aggregated.
- How much new for-sale + rental construction is in the pipeline within 1–3 miles? Heavy new supply typically softens prices + rents 12–24 months out; constrained supply supports both.
Investment metrics
- 1% rule
- 2.37% ✓
- Cap rate
- 9.86%
- Cash-on-cash
- 12.74%
- DSCR
- 1.57
- GRM
- 3.5
CMA / ARV
No comps found within radius.
Projected returns pro-forma
-3.0% appreciation · 4.09% rent growth · sell at horizon
- IRR
- 5.3%
- Equity multiple
- 1.21×
- Total profit
- $6,468
- Equity at exit
- $16,252
- IRR
- 16.8%
- Equity multiple
- 2.53×
- Total profit
- $46,792
- Equity at exit
- $9,424
Cash invested: $30,520 (down + closing). Projections, not guarantees.
Landlord ↔ Tenant lean methodology
- Overall (STATE)
- 87 Strongly Landlord-Friendly
- State Florida
- 87 Strongly Landlord-Friendly · R+3
- County
- — inherits STATE
- City
- — inherits STATE
ZIP-level market 33462
- Rents YoY
- 4.1%
- Active inventory
- 383
- Price-to-rent
- 3.5×
Monthly cashflow live
- Estimated rent
- $2,585 high interval (Pro) →
- Mortgage (P&I)
- −$572
- Tax est. 1.5%
- −$136 /mo · $1,635/yr
- Insurance
- −$45
- HOA
- −$965
- Vacancy / Maint / Mgmt
- −$543
- Net cashflow
- $324
Break-even live
UW: 25.0% down · 7.5% · 30yr · 1.5% tax · 5.0% vac · 8.0% maint · 8.0% mgmt
Financing live
Cash to close
- Down payment
- $27,250
- Closing costs
- $3,270
- Reserves months
- —
- Total cash needed
- —
Loan-product check · same deal, 3 products live
Conventional
25% down · 7.5% · 30yr
- Down + closing
- —
- Monthly P&I
- —
- Monthly cashflow
- —
- DSCR
- —
- Eligible?
- —
Personal DTI + credit; lowest rate.
DSCR
20% down · 8.5% · 30yr
- Down + closing
- —
- Monthly P&I
- —
- Monthly cashflow
- —
- DSCR
- —
- Eligible?
- —
No personal income docs; deal must DSCR.
Hard money
10% down · 12.0% · 12mo
- Down + closing
- —
- Monthly P&I
- —
- Monthly cashflow
- —
- DSCR
- —
- Eligible?
- —
Short-term bridge; refi at stabilization.
Rent comps 32 comps
| Address | Beds | Baths | Sqft | Rent | $/sqft | DOM | Units | Dist |
|---|---|---|---|---|---|---|---|---|
| 6289 Lear Dr Lake Worth, FL | 1.0–3.0 | 1.0–2.0 | 792 | $2,200 | $2.78 | 14d | 2 | 0.42mi |
| 6289 Lear Dr #203 Lake Worth, FL | 3.0 | 2.0 | 1044 | $2,200 | $2.11 | 24d | 1 | 0.42mi |
| 6511 Seminole Dr Unit 2 Atlantis, FL | 2.0 | 1.0 | 845 | $2,150 | $2.54 | 5d | 1 | 0.43mi |
| 6175 Reflections Blvd Lake Worth, FL | 1.0–2.0 | 1.0–2.0 | 814 | $2,307 | $2.83 | 1d | 15 | 0.55mi |
| 3327 Sapphire Rd Lake Worth, FL | 4.0 | 3.0 | 1377 | $3,400 | $2.47 | 11d | 1 | 0.56mi |
| 3327 Sapphire Rd Lake Worth, FL | 4.0 | 3.0 | 1377 | $3,350 | $2.43 | 2d | 1 | 0.56mi |
| 2780 Norfolk Pine Ct Lake Worth, FL | 2.0 | 2.0 | 1175 | $2,400 | $2.04 | 24d | 1 | 0.58mi |
| 580 Tallulah Rd Lake Worth, FL | 2.0 | 1.0 | 750 | $2,500 | $3.33 | 21d | 1 | 0.59mi |
| 3883 Island Club Cir W Lake Worth, FL | 3.0 | 2.5 | 1308 | $2,400 | $1.83 | 17d | 1 | 0.64mi |
| 6411 Birch Ln Lake Worth, FL | 3.0 | 2.0 | 1200 | $1,800 | $1.50 | 24d | 1 | 0.71mi |
| 423 Pine Tree Ct #23 Lake Worth, FL | 2.0 | 2.0 | 1222 | $2,300 | $1.88 | 21d | 1 | 0.71mi |
| 5981 Via Vermilya #203 Lake Worth, FL | 2.0 | 2.0 | 1130 | $1,975 | $1.75 | 24d | 1 | 0.75mi |
| 712 Meadows Cir Boynton Beach, FL | 2.0 | 2.0 | 921 | $2,400 | $2.61 | 24d | 1 | 0.78mi |
| 1106 Meadows Cir Boynton Beach, FL | 2.0 | 2.0 | 900 | $1,850 | $2.06 | 2d | 1 | 0.88mi |
| 1106 Meadows Cir Boynton Beach, FL | 2.0 | 2.0 | 900 | $1,895 | $2.11 | 21d | 1 | 0.88mi |
| 7093 Middlebury Dr Unit 7093 Boynton Beach, FL | 4.0 | 2.0 | 1470 | $3,000 | $2.04 | 24d | 1 | 0.90mi |
| 1120 Meadows Cir Unit 1120 Boynton Beach, FL | 2.0 | 2.0 | 900 | $1,980 | $2.20 | 24d | 1 | 0.92mi |
| 1205 Meadows Cir Boynton Beach, FL | 2.0 | 2.0 | 909 | $1,900 | $2.09 | 24d | 1 | 0.92mi |
| 316 Meadows Cir #316 Boynton Beach, FL | 2.0 | 2.0 | 921 | $2,100 | $2.28 | 1d | 1 | 0.92mi |
| 6040 Lace Wood Cir Lake Worth, FL | 3.0 | 2.0 | 1326 | $2,799 | $2.11 | 24d | 1 | 0.98mi |
| 88 Buxton Ln Boynton Beach, FL | 3.0 | 2.0 | 1448 | $3,100 | $2.14 | 24d | 1 | 1.03mi |
| 58 Paxford Ln Boynton Beach, FL | 2.0 | 2.0 | 1230 | $900 | $0.73 | 11d | 1 | 1.07mi |
| 5 Heather Trace Dr Boynton Beach, FL | 3.0 | 2.0 | 1454 | $3,100 | $2.13 | 21d | 1 | 1.10mi |
| 4350 Peregrine Way Lake Worth, FL | 1.0–3.0 | 1.0–2.0 | 1025 | $3,119 | $3.04 | 2d | 18 | 1.17mi |
| 3901 Medford Ct Boynton Beach, FL | 2.0 | 2.5 | 1374 | $2,650 | $1.93 | 24d | 1 | 1.26mi |
| 3901 Medford Ct Boynton Beach, FL | 2.0 | 2.5 | 1374 | $2,650 | $1.93 | 5d | 1 | 1.26mi |
| 6 Hammond Pl Boynton Beach, FL | 3.0 | 2.0 | 1409 | $3,160 | $2.24 | 10d | 1 | 1.29mi |
| 7398 Willow Springs Cir E Boynton Beach, FL | 3.0 | 2.0 | 1390 | $2,861 | $2.06 | 5d | 1 | 1.30mi |
| 7132 Colony Club Dr Lake Worth, FL | 1.0–3.0 | 1.0–2.0 | 1087 | $2,884 | $2.65 | 2d | 14 | 1.35mi |
| 9 Walcott Dr Boynton Beach, FL | 2.0 | 2.0 | 1222 | $2,550 | $2.09 | 24d | 1 | 1.46mi |
| 3 Afton Pl Boynton Beach, FL | 2.0 | 2.0 | 1196 | $2,645 | $2.21 | 18d | 1 | 1.48mi |
| 4938 Serafica Dr Unit 14 Lake Worth Beach, FL | 2.0 | 1.0 | 840 | $2,000 | $2.38 | 7d | 1 | 1.50mi |
HOA detail
- Monthly dues
- $965 · $11,580/yr
- Likely covers
- poolgymsecurity
Listing history 14 events
-
2026-06-18days on market $109,000 Active 52 DOM
-
2026-06-17days on market $109,000 Active 51 DOM
-
2026-06-16days on market $109,000 Active 50 DOM
-
2026-06-15days on market $109,000 Active 49 DOM
-
2026-06-13days on market $109,000 Active 47 DOM
-
2026-06-09days on market $109,000 Active 43 DOM
-
2026-06-08days on market $109,000 Active 42 DOM
-
2026-06-07days on market $109,000 Active 41 DOM
-
2026-06-04days on market $109,000 Active 38 DOM
-
2026-06-03days on market $109,000 Active 37 DOM
-
2026-06-02days on market $109,000 Active 36 DOM
-
2026-06-01days on market $109,000 Active 35 DOM
-
2026-05-31days on market $109,000 Active 34 DOM
-
2026-04-27$109,000 Active
ⓘ Source: listings_history table (triggers on properties + properties_extension) + one-shot
backfill from property_details.listing_events for pre-trigger history.
Climate risk First Street
- Flood 2/10 Low FEMA zone X (unshaded) · 9% chance over 30 yrs
- Wildfire 1/10 Low
- Heat 9/10 Extreme 6 d/yr ≥105°F today · 22 d/yr by 30 yrs out
- Wind 10/10 Extreme 99% chance of damaging wind over 30 yrs
- Air quality 2/10 Low 0 unhealthy d/yr today · 2 by 30 yrs out
Nearby sold comps map
Loading sold comps map…
Walkable amenities ~0.75 mi
Loading nearby amenities…
Taxation est. · year 1
- Rental income
- $31,021
- − Mortgage interest
- −$6,106
- − Property taxes
- −$1,635
- − Insurance
- −$545
- − Repairs & maintenance
- −$2,482
- − Management
- −$2,482
- − HOA
- −$11,580
- − Depreciation
- −$3,171
- Taxable income
- $3,021
- Est. tax owed @ 24.0%
- −$725
- After-tax cash flow
- $3,162/yr
For passive investors: Depreciation is non-cash, so a rental often shows a tax loss while cash-flowing — sheltering income. Rental losses are passive: they offset passive income freely, and up to $25,000/yr can offset ordinary (W-2) income if you actively participate and your MAGI is under $100k (phasing out to $0 by $150k); unused losses carry forward. On sale, claimed depreciation is recaptured at up to 25%, and gains may owe capital-gains tax (a 1031 exchange can defer both). Figures are a year-1 estimate at your 24.0% rate — not tax advice; consult a CPA.
Condition & rehab AI · 6 photos
This 2022 manufactured home is in good condition with a modern kitchen, laminate flooring, and a large yard. It has the potential for further value increases through minor updates and improvements.
Value-add opportunities
- Both Painting the interior walls — Fresh paint can enhance the home's curb appeal and interior aesthetics.
- Both Landscaping the yard — A well-maintained yard can increase both resale and rental value.
- Resale Upgrading the kitchen appliances — Modern appliances can attract more buyers and renters.
- Both Adding smart home features — Smart home features can increase both resale and rental value by making the home more convenient and energy-efficient.
- Both Upgrading the HVAC system — A more efficient HVAC system can improve comfort and energy efficiency, increasing both resale and rental value.
Renovation cost estimate screening
Value-add ROI direction
- Both Painting the interior walls — Fresh paint can enhance the home's curb appeal and interior aesthetics. ↑
- Both Landscaping the yard — A well-maintained yard can increase both resale and rental value. ↑
- Resale Upgrading the kitchen appliances — Modern appliances can attract more buyers and renters. ↑
- Both Adding smart home features — Smart home features can increase both resale and rental value by making the home more convenient and energy-efficient. ↑
- Both Upgrading the HVAC system — A more efficient HVAC system can improve comfort and energy efficiency, increasing both resale and rental value. ↑
ⓘ Cost ranges are severity-bucket heuristics (US national rule-of-thumb). Get contractor quotes + a written scope before underwriting a rehab budget.
Schools (NCES district)
- District
- Palm Beach
- NCES district ID
- 1201500
- Math proficiency
- 46% ▼ -16.00%
- Reading proficiency
- 53% ▼ -4.00%
- Median HH income
- $53,943
- Composite
- 42.72/100
- National rank
- #3160
- State rank
- #34 of 73 in FL
Livability — Seminole Manor
- Score
- 63/100
- State rank
- #711
- US rank
- #15076
Category grades
Schools grade is shown separately in the Schools card above.
Census & demographics
- County
- Palm Beach County · 1,438,312 people
- Metro
- Miami-Fort Lauderdale-Pompano Beach, FL
- Population (ZIP)
- 33,371
- Household income
- $73,997
- Rent vs Own
- Severe rent burden
- 1852.0
Population outlook (Palm Beach County) Hauer SSP2
- Today (2025)
- 1,637,487 people
- By 2030
- 1,743,255 · +6.5%
- By 2040
- 1,948,712 · +19.0%
- By 2050
- 2,132,979 · +30.3%
- By 2075
- 2,530,027 · +54.5%
- By 2100
- 2,706,979 · +65.3%
Race, ethnicity, and origin ACS 2023
- Neighborhood character
- Diverse neighborhood (Simpson 0.68)
- Race & ethnicity
- White 44% Black 26% Hispanic / Latino 26% Two or more races 11% Asian 2%
- Hispanic origin (detail)
- Mexican 8% Puerto Rican 5% Cuban 3%
- Common ancestry
- Hispanic 14% Romanian 2% Scotch-Irish 2%
- Foreign-born
- 31% · Canada, Jamaica, Dominican Republic
- Languages at home
- 60% English-only · Spanish 20% French/Haitian/Cajun 16% Other Indo-European 1%
Political lean MEDSL · Palm Beach
- 2024 margin
- Toss-up / Even · D 50.0% · R 49.2%
- 2008→2024 swing
- -22.1pp toward R · 2008: 22.9pp · 2024: 0.8pp
- All cycles
- 2024: D+0.8 2020: D+12.8 2016: D+15.3 2012: D+17.0 2008: D+22.9
Not yet ingested
- Civics
- —
Market trends
- HPI YoY
- ▼ -295.48%
- Current HPI
- 361.5391
- Rent YoY
- ▲ 4.09%
- Metro
- Miami-Fort Lauderdale-Pompano Beach, FL
- State GDP YoY
- ▲ 3.28%
- F500 in state
- 36
Industry mix (Fortune 500 HQ in FL)
| Industry | F500 HQs | Revenue |
|---|---|---|
| Industrial Technology | 2 | $29B |
|
||
| Insurance | 2 | $17B |
|
||
| Retail | 1 | $60B |
|
||
| Technology Distribution | 1 | $58B |
|
||
| Homebuilding | 1 | $35B |
|
||
| Technology Manufacturing | 1 | $35B |
|
||
Price history
1 event — show timeline
- 2026-04-27 Listed $109,000 MCRTC
Cash-flow waterfall
monthlySold comps — $/sqft
last 12 mo · ≤1 miLoading sold comps…