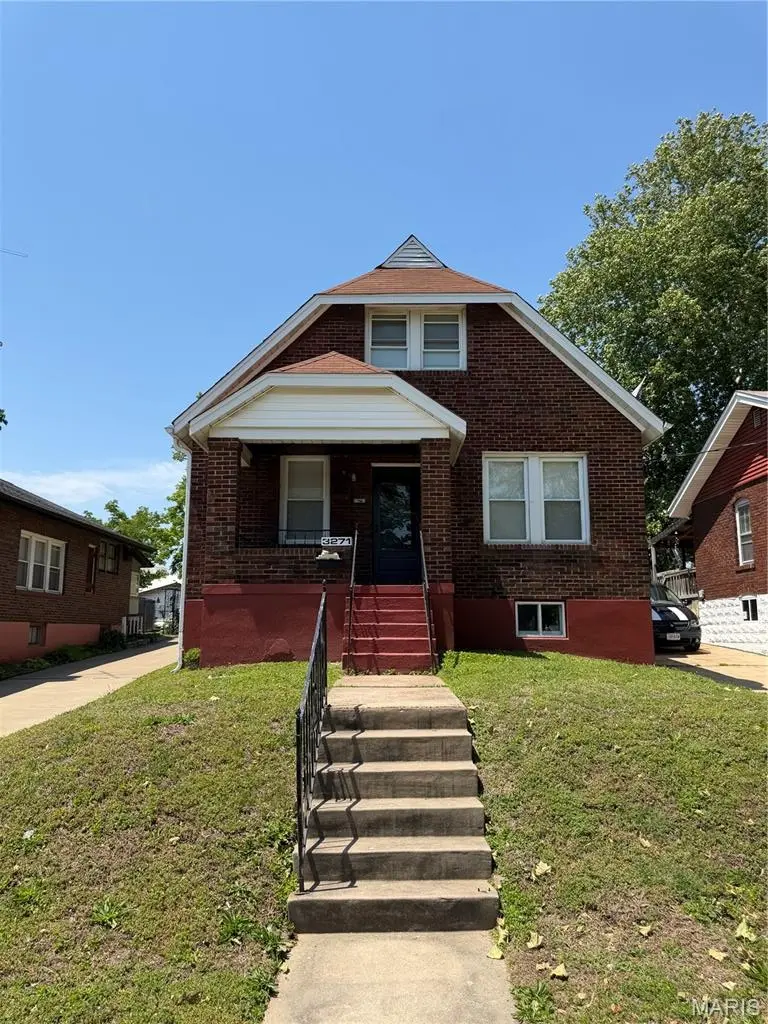
3271 Marshall Ave · St. John, MO
Flood risk 1/10 · Minimal
- FEMA flood zone
- X (unshaded)
- Chance of flooding over 30 yrs
- 0.0%
- Est. flood insurance / yr
- $473 – $860
Fire risk 1/10 · Minimal
- Est. fire insurance / yr
- $1,054 – $1,958
Heat risk 5/10 · Moderate
- Hot days now (above 106°F)
- 7 days/yr
- Hot days in 30 yrs
- 21 days/yr
Wind risk 2/10 · Minimal
- Chance of severe wind over 30 yrs
- 1.0%
Air-quality risk 4/10 · Minor
- Unhealthy air days now
- 4 days/yr
- Unhealthy air days in 30 yrs
- 5 days/yr
Risk factors via First Street. Map © Google.
Why this score? — see what drove the B grade
The composite is a weighted blend of 9 inputs, each scored 0–100. Each bar is that input's sub-score; the figure is the points it added to the 100-point composite (weight × sub-score).
- Cash flow +30.0/30.0
- ARV discount +15.0/15.0
- DSCR +10.0/10.0
- 1% rule +8.8/10.0
- Rent growth +3.0/5.0
- Livability +2.5/5.0
- Condition / age +2.5/5.0
- Schools +1.7/10.0
- Appreciation +0.0/10.0
$130,000
🖨 Deal sheet (PDF) 📄 Offer letter ✓ Due diligence
Listing remarks
Opportunity awaits with this spacious 4-bedroom home in a convenient North County location. Being sold as-is, this property offers great potential for both investors and owner-occupants looking to add value. The home features a functional layout with 2 bedrooms on the main level and 2 additional bedrooms upstairs, providing flexibility for families or rental configurations. You’ll also find an updated bathroom, a dedicated dining room, and a full basement with washer and dryer hookups. Outside, the property includes a private driveway and a backyard, adding to its overall appeal and usability. With solid fundamentals and room for personalization, this property is a great opportunity t
Key facts
- Private driveway
- Backyard
- Full basement
Tags
Property features AI
Exterior
- Utilities: Public water; Public sewer; Electric service by Ameren; Electricity connected; Natural gas connected; Sewer connected
- Home design: Single-family residence; One level
- Construction: Brick construction
- Exterior features: Back yard
Interior
- Bedrooms: 4 bedrooms total; 2 main-level bedrooms; 2 upper-level bedrooms
- Bathrooms: 1 full bathroom (main/upper levels)
- Heating & cooling: Electric heating; Central air conditioning
- Interior features: Concrete basement; 7 total rooms
Neighborhood map
What this means for you Summary
Snapshot
- This is a 4-bed/1.0-bath single-family listed at $130k.
Deal economics
- At list price, monthly cash flow is $523 ($6k/yr) — positive.
- The deal already cash-flows at list — no discount required.
- Meets the 1% rule at list price ($2k rent vs $130k).
- Recommended offer: $126k (3.0% below list) — sets the bar for market timing.
Location & tenants
- Location reads: area grade B — affects rentability + tenant quality, not the cash-flow math above.
- Ritenour (suburban): math 13% / reading 27% proficiency, ranked #304 of 324 in MO (top 94%) — low school quality limits family demand, transient renter base, plan for 1-2y turnover; 66% free/reduced lunch — lower-income household profile, screen leases tightly.
- Zoned schools: Wyland Elem. (math 13% / reading 25%, grade F, #958 of 1,115 statewide, top 86%, 490 students, 99% FRL); Ritenour Sr. High (math 9% / reading 36%, grade F, #455 of 521 statewide, top 88%, 1,873 students, 100% FRL) — zoned schools average 100% FRL vs 66% district-wide (34 pts higher); higher-poverty schools than district average — tighter screening recommended.
- Market conditions: Rents rising (+2.0%/yr); 118 active listings in the ZIP; 9 comparable units currently listed for rent nearby; rentals lingering (median 45d on market — plan ~5-8 weeks vacancy on turnover, expect pricing pressure); 56% of comp listings sitting > 30 days — soft ceiling on asking rent; 920 units permitted in St. Louis County in 2024 (250 in 5+ unit buildings).
- This rent runs 39% of the median local income ($56k/yr) — at the standard rent-burdened threshold; future hikes will face affordability resistance.
Forward outlook
- Local home prices are declining (-3.0%/yr); year-one equity from $899 of loan paydown is wiped out by about $4k of value loss. Plan a longer hold.
- At projected returns (-3.0% appreciation + 2.0% rent growth), your $36k cash investment doubles in ~8 years — after that, you're playing with house money.
Negotiation context
- It's been on market 55 days — a 3% lower offer ($126k) is reasonable based on typical stale-listing flexibility.
- Current owner paid $104k; 25% above their basis — modest negotiation headroom, anchor on the comps not their cost.
Risks & watch-outs
- Watch-outs: built in 1922 — expect roof / HVAC / electrical / plumbing capex.
- Climate carrying-cost: extreme-heat days projected 7→21/yr by 2055 (HVAC capex compounding) — expect insurance premiums to compound above CPI over the hold.
Questions for the listing agent
- It's been on market 55 days. Have you received any prior offers? Is the seller open to a 3% concession, seller financing, or rate buy-down credit?
- Built in 1922 — when were the roof, HVAC, electrical panel, plumbing, and water heater last replaced?
- Is there a deadline driving the sale (1031 exchange, divorce, estate, relocation)? That informs how much negotiation room exists.
- What's the average days-on-market for RENTAL listings here right now (not sales)? A rising rental-DOM trend means longer vacancies and softer asking-rent achievability than the comps imply.
- What's the recent tenant-quality profile in this submarket — average credit score on applications, eviction rate, late-payment / NSF rate, and stable-employment percentage? A property-management company in the area should have these aggregated.
- How much new for-sale + rental construction is in the pipeline within 1–3 miles? Heavy new supply typically softens prices + rents 12–24 months out; constrained supply supports both.
Investment metrics
- 1% rule
- 1.38% ✓
- Cap rate
- 11.12%
- Cash-on-cash
- 17.26%
- DSCR
- 1.77
- GRM
- 6.0
CMA / ARV
- ARV (median comp)
- $164,634
- List price
- $130,000
- Delta
- -21.04%
- Verdict
- UNDERPRICED
- Comps
- 20 within 1.0 mi
Show comp detail 12 sales within ~0.75 mi
| Address | Dist | Beds/Ba | Sqft | Sold | Price | $/sf | Match |
|---|---|---|---|---|---|---|---|
| 8647 Belcrest Ln | 0.39mi | 4/1.5 | 1,408 (-3%) | 3mo | $200,000 | $142 | 72 |
| 8916 Windom Ave | 0.30mi | 4/1.0 | 1,336 (-8%) | 6mo | $224,900 | $168 | 68 |
| 8616 Belhaven Dr | 0.43mi | 4/2.0 | 1,507 (+4%) | 5mo | $139,900 | $93 | 66 |
| 8636 Belhaven Dr | 0.38mi | 4/2.0 | 1,382 (-5%) | 10mo | $175,000 | $127 | 62 |
| 3553 Mckibbon Rd | 0.48mi | 4/2.0 | 1,474 (+2%) | 10mo | $179,900 | $122 | 62 |
| 2963 Hilleman Ave | 0.28mi | 3/1.0 (-1) | 1,603 (+10%) | 10mo | $184,900 | $115 | 56 |
| 8804 Forest Ave | 0.54mi | 4/1.0 | 1,568 (+8%) | 8mo | $199,900 | $127 | 55 |
| 8917 Forest Ave | 0.54mi | 3/1.0 (-1) | 1,393 (-4%) | 11mo | $165,000 | $118 | 54 |
| 3601 Brown Rd | 0.50mi | 4/1.5 | 1,568 (+8%) | 9mo | $190,000 | $121 | 54 |
| 8964 Tudor Ave | 0.31mi | 3/3.0 (-1) | 1,578 (+9%) | 10mo | $234,000 | $148 | 50 |
| 3560 Boswell Ave | 0.55mi | 3/2.0 (-1) | 1,544 (+6%) | 10mo | $145,000 | $94 | 46 |
| 3612 Eminence Blvd | 0.55mi | 3/1.5 (-1) | 1,323 (-9%) | 10mo | $215,000 | $163 | 44 |
Match score weights: distance 35% · size 25% · config 20% · recency 20%. Top-matched comps best support the ARV.
Projected returns pro-forma
-3.0% appreciation · 2.04% rent growth · sell at horizon
- IRR
- 7.5%
- Equity multiple
- 1.29×
- Total profit
- $10,578
- Equity at exit
- $19,383
- IRR
- 16.0%
- Equity multiple
- 2.25×
- Total profit
- $45,326
- Equity at exit
- $11,240
Cash invested: $36,400 (down + closing). Projections, not guarantees.
Landlord ↔ Tenant lean methodology
- Overall (STATE)
- 81 Strongly Landlord-Friendly
- State Missouri
- 81 Strongly Landlord-Friendly · R+10
- County
- — inherits STATE
- City
- — inherits STATE
ZIP-level market 63114
- Rents YoY
- 2.0%
- Active inventory
- 118
- Price-to-rent
- 6.0×
Monthly cashflow live
- Estimated rent
- $1,794 high interval (Pro) →
- Mortgage (P&I)
- −$682
- Tax from tax record
- −$158 /mo · $1,898/yr
- Insurance
- −$54
- HOA
- −$0
- Vacancy / Maint / Mgmt
- −$377
- Net cashflow
- $523
Break-even live
Sensitivity live
| Price | -10% $597 | -5% $560 | +0% $523 | +5% $487 | +10% $450 |
|---|---|---|---|---|---|
| Rent | -10% $382 | -5% $453 | +0% $523 | +5% $594 | +10% $665 |
| Rate | -1.0pp $589 | -0.5pp $556 | base $523 | +0.5pp $490 | +1.0pp $455 |
UW: 25.0% down · 7.5% · 30yr · 1.5% tax · 5.0% vac · 8.0% maint · 8.0% mgmt
Financing live
Cash to close
- Down payment
- $32,500
- Closing costs
- $3,900
- Reserves months
- —
- Total cash needed
- —
Loan-product check · same deal, 3 products live
Conventional
25% down · 7.5% · 30yr
- Down + closing
- —
- Monthly P&I
- —
- Monthly cashflow
- —
- DSCR
- —
- Eligible?
- —
Personal DTI + credit; lowest rate.
DSCR
20% down · 8.5% · 30yr
- Down + closing
- —
- Monthly P&I
- —
- Monthly cashflow
- —
- DSCR
- —
- Eligible?
- —
No personal income docs; deal must DSCR.
Hard money
10% down · 12.0% · 12mo
- Down + closing
- —
- Monthly P&I
- —
- Monthly cashflow
- —
- DSCR
- —
- Eligible?
- —
Short-term bridge; refi at stabilization.
Rent comps 9 comps
| Address | Beds | Baths | Sqft | Rent | $/sqft | DOM | Units | Dist |
|---|---|---|---|---|---|---|---|---|
| 8601 Belhaven Dr Saint Louis, MO | 4.0 | 1.5 | 1507 | $1,850 | $1.23 | 45d | 1 | 0.45mi |
| 3209 Dix Ave Saint Louis, MO | 3.0 | 1.0 | 1122 | $1,550 | $1.38 | 25d | 1 | 0.83mi |
| 9183 Harold Dr Saint Louis, MO | 3.0 | 1.0 | 912 | $1,200 | $1.32 | 45d | 1 | 0.91mi |
| 3213 Airway Ave Saint Louis, MO | 3.0 | 1.0 | 1215 | $1,550 | $1.28 | 45d | 1 | 1.09mi |
| 9457 Harold Dr Saint Louis, MO | 3.0 | 1.0 | 1472 | $1,530 | $1.04 | 23d | 1 | 1.19mi |
| 2851 Lyndhurst Ave Saint Louis, MO | 4.0 | 2.0 | 1406 | $2,050 | $1.46 | 3d | 1 | 1.28mi |
| 4400 Gordon Ave Saint Louis, MO | 3.0 | 2.0 | 1500 | $1,800 | $1.20 | 5d | 1 | 1.30mi |
| 4204 Beauty Ln Saint Louis, MO | 4.0 | 1.5 | 1299 | $1,690 | $1.30 | 45d | 1 | 1.44mi |
| 3434 Sims Ave Saint Ann, MO | 3.0 | 1.5 | 988 | $1,545 | $1.56 | 45d | 1 | 1.46mi |
Listing history 20 events
-
2026-06-21days on market $130,000 Active 55 DOM
-
2026-06-18days on market $130,000 Active 52 DOM
-
2026-06-17days on market $130,000 Active 51 DOM
-
2026-06-16days on market $130,000 Active 50 DOM
-
2026-06-15days on market $130,000 Active 49 DOM
-
2026-06-13days on market $130,000 Active 47 DOM
-
2026-06-09days on market $130,000 Active 43 DOM
-
2026-06-08days on market $130,000 Active 42 DOM
-
2026-06-07days on market $130,000 Active 41 DOM
-
2026-06-03days on market $130,000 Active 37 DOM
-
2026-06-02days on market $130,000 Active 36 DOM
-
2026-06-01days on market $130,000 Active 35 DOM
-
2026-05-31days on market $130,000 Active 34 DOM
-
2026-05-18price $145,000 807-char remark
-
2026-04-27$155,000 Active 807-char remark
-
2026-04-27historical $155,000 807-char remark
-
2022-06-25price $1,285
-
2019-03-22soldstatus $104,100
-
2018-06-20soldstatus
-
2015-09-30soldstatus
ⓘ Source: listings_history table (triggers on properties + properties_extension) + one-shot
backfill from property_details.listing_events for pre-trigger history.
Tax reassessment forecast MO · Resets to sale price
- Current annual tax
- $1,898 · $158/mo
- Projected year-2 tax
- $1,898 · $158/mo
- Expected delta
- $0/yr ($0/mo · 0.0%)
ⓘ Screening estimate from a state-policy table — verify with the county assessor before closing.
Climate risk First Street
- Flood 1/10 Low FEMA zone X (unshaded) · 0% chance over 30 yrs
- Wildfire 1/10 Low
- Heat 5/10 Major 7 d/yr ≥106°F today · 21 d/yr by 30 yrs out
- Wind 2/10 Low 100% chance of damaging wind over 30 yrs
- Air quality 4/10 Moderate 4 unhealthy d/yr today · 5 by 30 yrs out
Nearby sold comps map
Loading sold comps map…
Walkable amenities ~0.75 mi
Loading nearby amenities…
Taxation est. · year 1
- Rental income
- $21,532
- − Mortgage interest
- −$7,282
- − Property taxes
- −$1,898
- − Insurance
- −$650
- − Repairs & maintenance
- −$1,723
- − Management
- −$1,723
- − Depreciation
- −$3,782
- Taxable income
- $4,474
- Est. tax owed @ 24.0%
- −$1,074
- After-tax cash flow
- $5,207/yr
For passive investors: Depreciation is non-cash, so a rental often shows a tax loss while cash-flowing — sheltering income. Rental losses are passive: they offset passive income freely, and up to $25,000/yr can offset ordinary (W-2) income if you actively participate and your MAGI is under $100k (phasing out to $0 by $150k); unused losses carry forward. On sale, claimed depreciation is recaptured at up to 25%, and gains may owe capital-gains tax (a 1031 exchange can defer both). Figures are a year-1 estimate at your 24.0% rate — not tax advice; consult a CPA.
Schools (NCES district)
- District
- Ritenour
- NCES district ID
- 2926640
- Math proficiency
- 13% ▼ -14.00%
- Reading proficiency
- 27% ▼ -7.00%
- Median HH income
- $41,410
- Composite
- 17.04/100
- National rank
- #9125
- State rank
- #304 of 324 in MO
Livability — St. John
No livability data for this city. (Only ~50 U.S. cities are tracked.)
Census & demographics
- Census place
- St. John, MO
- County
- Saint Louis County · 888,823 people
- Metro
- St. Louis, MO-IL
- Population (ZIP)
- 33,969
- Household income
- $55,870
- Rent vs Own
- Severe rent burden
- 1595.0
Population outlook (St. Louis County) Hauer SSP2
- Today (2025)
- 1,025,227 people
- By 2030
- 1,028,023 · +0.3%
- By 2040
- 1,020,940 · -0.4%
- By 2050
- 1,007,280 · -1.8%
- By 2075
- 987,277 · -3.7%
- By 2100
- 921,984 · -10.1%
Race, ethnicity, and origin ACS 2023
- Neighborhood character
- Diverse neighborhood (Simpson 0.64)
- Race & ethnicity
- White 50% Black 30% Hispanic / Latino 11% Two or more races 6% Asian 2%
- Hispanic origin (detail)
- Mexican 7%
- Common ancestry
- Lithuanian 3% Italian 2% Romanian 1%
- Foreign-born
- 9% · Canada, Vietnam
- Languages at home
- 84% English-only · Spanish 10% French/Haitian/Cajun 2% Tagalog/Filipino 1%
Political lean MEDSL · St. Louis
- 2024 margin
- Strong D (+23.4) · D 60.8% · R 37.4% · Other 1.7%
- 2008→2024 swing
- +3.5pp toward D · 2008: 19.9pp · 2024: 23.4pp
- All cycles
- 2024: D+23.4 2020: D+24.0 2016: D+16.2 2012: D+13.7 2008: D+19.9
Not yet ingested
- Civics
- —
Market trends
- HPI YoY
- ▼ -276.62%
- Current HPI
- 223.9305
- Rent YoY
- ▲ 2.04%
- Metro
- St. Louis, MO-IL
- State GDP YoY
- ▲ 1.84%
- F500 in state
- 20
Industry mix (Fortune 500 HQ in MO)
| Industry | F500 HQs | Revenue |
|---|---|---|
| Healthcare | 1 | $163B |
|
||
| Insurance | 1 | $21B |
|
||
| Industrial Technology | 1 | $17B |
|
||
| Retail | 1 | $16B |
|
||
| Industrial Distribution | 1 | $10B |
|
||
| Utilities | 1 | $9B |
|
||
Price history
+24.9% since first listed8 events — show timeline
- 2026-05-28 Price Changed $130,000 MARIS as Distributed by MLS Grid
- 2026-05-18 Price Changed $145,000 MARIS as Distributed by MLS Grid
- 2026-04-27 Listed $155,000 MARIS as Distributed by MLS Grid
- 2026-04-27 Coming Soon $155,000 MARIS as Distributed by MLS Grid
- 2022-06-25 Price Changed $1,285 RENT.
- 2019-03-22 Sold (Public Records) $104,100 Public Records
- 2018-06-20 Sold (Public Records) — Public Records
- 2015-09-30 Sold (Public Records) — Public Records
Property tax history
+2.3%/yrLatest (2022): $1,898 · +0.0% YoY. Source: county tax records.
Cash-flow waterfall
monthlySold comps — $/sqft
last 12 mo · ≤1 miLoading sold comps…