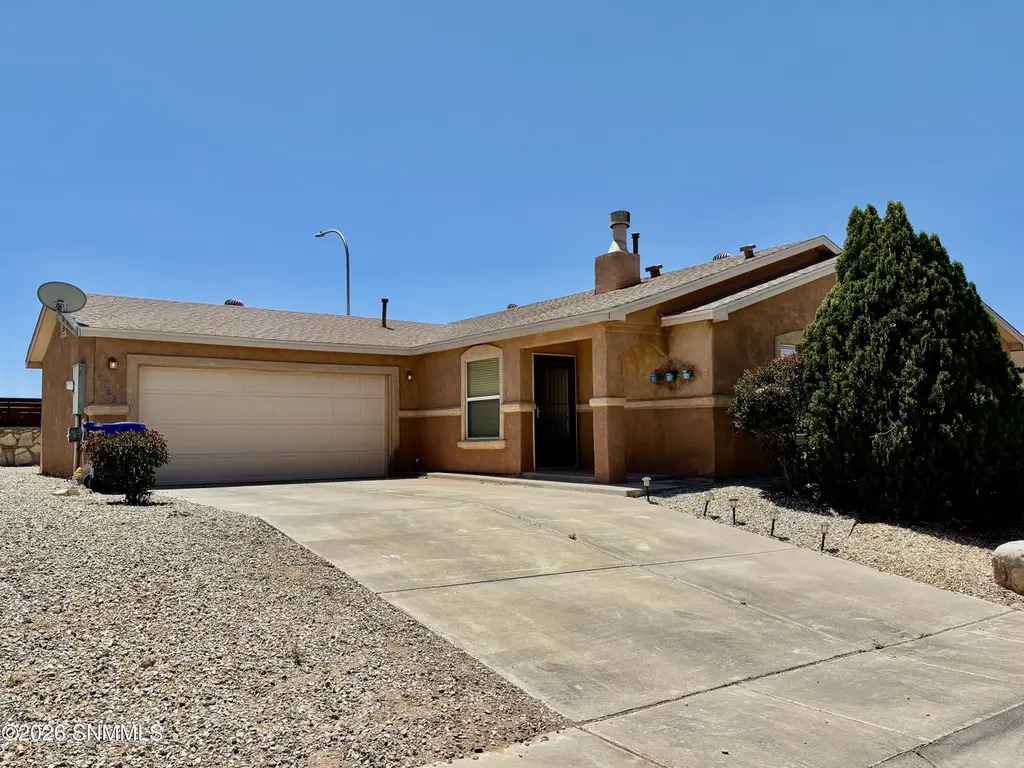
4082 Calle De Luna · Las Cruces, NM
Flood risk 1/10 · Minimal
- FEMA flood zone
- X (unshaded)
- Chance of flooding over 30 yrs
- 0.0%
- Est. flood insurance / yr
- $507 – $1,088
Fire risk 4/10 · Minor
- Est. fire insurance / yr
- $706 – $1,312
Heat risk 5/10 · Moderate
- Hot days now (above 98°F)
- 5 days/yr
- Hot days in 30 yrs
- 18 days/yr
Wind risk 1/10 · Minimal
- Chance of severe wind over 30 yrs
- —
Air-quality risk 1/10 · Minimal
- Unhealthy air days now
- 0 days/yr
- Unhealthy air days in 30 yrs
- 0 days/yr
Risk factors via First Street. Map © Google.
Why this score? — see what drove the D grade
The composite is a weighted blend of 9 inputs, each scored 0–100. Each bar is that input's sub-score; the figure is the points it added to the 100-point composite (weight × sub-score).
- Cash flow +13.1/30.0
- ARV discount +7.5/15.0
- Schools +4.6/10.0
- DSCR +3.9/10.0
- Rent growth +3.4/5.0
- Livability +3.0/5.0
- 1% rule +2.9/10.0
- Condition / age +2.5/5.0
- Appreciation +0.0/10.0
$245,000
🖨 Deal sheet (PDF) 📄 Offer letter ✓ Due diligence
Listing remarks
Located in Las Cruces, this 4-bedroom, 2-bath home offers 1,439 sq ft on a . 17-acre lot and is move-in ready. Built in 2006, the layout features a private primary suite with an ensuite bathroom, plus three additional bedrooms with carpet for comfort. The kitchen and living areas provide functional flow for daily living and entertaining. Enjoy refrigerated air, a pitched shingle roof, and a 2-car garage. The backyard offers Organ Mountain views and potential RV access. Conveniently situated with easy access to Highway 70 and I-10, and close to schools, shopping, and local amenities. A practical option for buyers seeking space, accessibility, and scenic surroundings in Las Cruces.
Key facts
- 7,405 sq ft lot
- 2 garage spots
- Built 2006
Property features AI
Exterior
- Parking: 2-car garage with garage door opener
- Utilities: Public water; Public sewer; Natural gas available
- Home design: Single-family residence; One level
- Construction: Stucco construction; Slab foundation
- Exterior features: Covered patio; Shingle roof
Interior
- Kitchen: Dishwasher; Gas range
- Bathrooms: 2 full bathrooms
- Heating & cooling: Forced air heating; Central air conditioning
- Interior features: Fireplace in the living room; Covered patio
- Laundry & utility: Gas water heater
Neighborhood map
What this means for you Summary
Snapshot
- This is a 4-bed/2.0-bath single-family listed at $245k.
Deal economics
- At list price, monthly cash flow is $-10 ($-125/yr) — negative.
- To cash-flow at today's rent, offer at most $243k (0.7% below list).
- To meet the 1% rule (rent ≥ 1% of price), the offer needs to be $193k (21.2% below list).
- Recommended offer: $193k (21.2% below list) — sets the bar for 1% rule.
Location & tenants
- Location reads 59/100 on livability (#120 in NM) — a working-class tenant base; expect higher turnover. Strengths: cost of living A+, housing A; Watch: amenities D+, crime F, commute F.
- Las Cruces Public Schools (urban): math 42% / reading 68% proficiency, ranked #5 of 29 in NM (top 17%) — acceptable for families but not a draw, mixed tenant base, ~2y average lease; 62% free/reduced lunch — lower-income household profile, screen leases tightly.
- Zoned schools: Monte Vista Elementary (718 students, 100% FRL); Mesa Middle (803 students, 100% FRL); Organ Mountain High School (math 32% / reading 62%, grade D-, #56 of 110 statewide, top 50%, 1,980 students, 0% FRL) — zoned schools at 67% FRL track the district average.
- Market conditions: Rents rising (+3.5%/yr); 598 active listings in the ZIP; 15 comparable units currently listed for rent nearby; rentals lingering (median 46d on market — plan ~5-8 weeks vacancy on turnover, expect pricing pressure); 53% of comp listings sitting > 30 days — soft ceiling on asking rent; 964 units permitted in Doña Ana County in 2024 (0 in 5+ unit buildings).
- This rent runs 34% of the median local income ($69k/yr) — at the standard rent-burdened threshold; future hikes will face affordability resistance.
Forward outlook
- Local home prices are declining (-3.0%/yr); year-one equity from $2k of loan paydown is wiped out by about $7k of value loss. Plan a longer hold.
Negotiation context
- Only 3 days on market — expect competitive offers; lowballing is unlikely to land.
Risks & watch-outs
- Climate carrying-cost: extreme-heat days projected 5→18/yr by 2055 (HVAC capex compounding) — expect insurance premiums to compound above CPI over the hold.
Questions for the listing agent
- What do current leases actually rent for vs. the listed asking? Can we see a recent rent roll and the last 12 months of T-12 income?
- Is there a deadline driving the sale (1031 exchange, divorce, estate, relocation)? That informs how much negotiation room exists.
- Schools are D-rated, which usually means shorter tenancies and higher turnover. Who's the typical renter profile here, and what's been the actual vacancy rate?
- Crime grade is F in this area — have there been break-ins, vandalism, or insurance claims at this property in the last 3 years? What carrier currently insures it and at what premium?
- The area grade is low — what's the realistic commute time and amenity access for the typical tenant pool here? Any planned neighborhood developments (good or bad) we should know about?
- What's the average days-on-market for RENTAL listings here right now (not sales)? A rising rental-DOM trend means longer vacancies and softer asking-rent achievability than the comps imply.
- What's the recent tenant-quality profile in this submarket — average credit score on applications, eviction rate, late-payment / NSF rate, and stable-employment percentage? A property-management company in the area should have these aggregated.
- How much new for-sale + rental construction is in the pipeline within 1–3 miles? Heavy new supply typically softens prices + rents 12–24 months out; constrained supply supports both.
Investment metrics
- 1% rule
- 0.79% ✗
- Cap rate
- 6.24%
- Cash-on-cash
- -0.18%
- DSCR
- 0.99
- GRM
- 10.6
CMA / ARV
No comps found within radius.
Projected returns pro-forma
-3.0% appreciation · 3.52% rent growth · sell at horizon
- IRR
- -16.1%
- Equity multiple
- 0.43×
- Total profit
- $-39,416
- Equity at exit
- $36,530
- IRR
- -7.0%
- Equity multiple
- 0.54×
- Total profit
- $-31,244
- Equity at exit
- $21,183
Cash invested: $68,600 (down + closing). Projections, not guarantees.
Landlord ↔ Tenant lean methodology
- Overall (STATE)
- 55 Moderately Landlord-Leaning
- State New Mexico
- 55 Moderately Landlord-Leaning · D+3
- County
- — inherits STATE
- City
- — inherits STATE
ZIP-level market 88012
- Home prices YoY
- -26.2%
- Rents YoY
- 3.5%
- Active inventory
- 598
- Price-to-rent
- 10.6×
Monthly cashflow live
- Estimated rent
- $1,930 high interval (Pro) →
- Mortgage (P&I)
- −$1,285
- Tax from tax record
- −$148 /mo · $1,777/yr
- Insurance
- −$102
- HOA
- −$0
- Lot rent
- −$0
- Vacancy / Maint / Mgmt
- −$405
- Net cashflow
- $-10
Break-even live
Sensitivity live
| Price | -10% $128 | -5% $59 | +0% $-10 | +5% $-80 | +10% $-149 |
|---|---|---|---|---|---|
| Rent | -10% $-163 | -5% $-87 | +0% $-10 | +5% $66 | +10% $142 |
| Rate | -1.0pp $113 | -0.5pp $52 | base $-10 | +0.5pp $-74 | +1.0pp $-138 |
UW: 25.0% down · 7.5% · 30yr · 1.5% tax · 5.0% vac · 8.0% maint · 8.0% mgmt
Financing live
Cash to close
- Down payment
- $61,250
- Closing costs
- $7,350
- Reserves months
- —
- Total cash needed
- —
Loan-product check · same deal, 3 products live
Conventional
25% down · 7.5% · 30yr
- Down + closing
- —
- Monthly P&I
- —
- Monthly cashflow
- —
- DSCR
- —
- Eligible?
- —
Personal DTI + credit; lowest rate.
DSCR
20% down · 8.5% · 30yr
- Down + closing
- —
- Monthly P&I
- —
- Monthly cashflow
- —
- DSCR
- —
- Eligible?
- —
No personal income docs; deal must DSCR.
Hard money
10% down · 12.0% · 12mo
- Down + closing
- —
- Monthly P&I
- —
- Monthly cashflow
- —
- DSCR
- —
- Eligible?
- —
Short-term bridge; refi at stabilization.
Rent comps 15 comps
| Address | Beds | Baths | Sqft | Rent | $/sqft | DOM | Units | Dist |
|---|---|---|---|---|---|---|---|---|
| 3833 Ranchers Rd Las Cruces, NM | 3.0 | 2.0 | 1600 | $2,000 | $1.25 | 46d | 1 | 0.35mi |
| 7516 Sierra de Oro Pl Las Cruces, NM | 4.0 | 2.0 | 1549 | $1,895 | $1.22 | 15d | 1 | 0.61mi |
| 3575 Sierra del Sol Ave Las Cruces, NM | 3.0 | 2.0 | 1700 | $1,950 | $1.15 | 46d | 1 | 0.76mi |
| 7559 Vista de Oeste Pl Las Cruces, NM | 3.0 | 2.0 | 1234 | $2,000 | $1.62 | 46d | 1 | 0.86mi |
| 4942 Sherwood Rd Las Cruces, NM | 3.0 | 2.0 | 1376 | $1,625 | $1.18 | 15d | 1 | 0.89mi |
| 4950 Ortega Rd Las Cruces, NM | 3.0 | 2.0 | 1035 | $1,475 | $1.43 | 23d | 1 | 0.91mi |
| 7353 Vista de Sobre Dr Las Cruces, NM | 3.0 | 2.0 | 1506 | $1,895 | $1.26 | 46d | 1 | 0.94mi |
| 5014 Kenner Way Las Cruces, NM | 3.0 | 2.0 | 1657 | $1,825 | $1.10 | 15d | 1 | 0.95mi |
| 3860 Las Colinas Dr Las Cruces, NM | 3.0 | 2.5 | 1550 | $1,600 | $1.03 | 23d | 1 | 1.10mi |
| 3704 Chromite Ct Las Cruces, NM | 3.0 | 2.0 | 1380 | $1,500 | $1.09 | 46d | 1 | 1.18mi |
| 5015 Emerald St Las Cruces, NM | 3.0 | 2.0 | 1426 | $1,450 | $1.02 | 46d | 1 | 1.19mi |
| 3862 Van Ess Ct Las Cruces, NM | 3.0 | 2.0 | 1489 | $1,545 | $1.04 | 15d | 1 | 1.21mi |
| 4831 Jade Pl Las Cruces, NM | 3.0 | 2.0 | 1134 | $1,600 | $1.41 | 46d | 1 | 1.24mi |
| 3670 Gem St Las Cruces, NM | 3.0 | 2.0 | 1446 | $1,700 | $1.18 | 46d | 1 | 1.38mi |
| 4260 Northrise Dr Las Cruces, NM | 1.0–3.0 | 1.0–2.0 | 1096 | $1,736 | $1.58 | 15d | 7 | 1.45mi |
Listing history 8 events
-
2026-06-02status $245,000 Pending 3 DOM
-
2026-06-01days on market $245,000 Active 3 DOM
-
2026-05-31days on market $245,000 Active 2 DOM
-
2026-04-27historical $245,000 688-char remark
-
2013-06-21soldstatus
-
2007-11-30soldstatus
-
2005-12-05soldstatus
-
2005-12-02soldstatus
ⓘ Source: listings_history table (triggers on properties + properties_extension) + one-shot
backfill from property_details.listing_events for pre-trigger history.
Tax reassessment forecast NM · Resets to sale price
- Current annual tax
- $1,777 · $148/mo
- Projected year-2 tax
- $1,960 · $163/mo
- Expected delta
- +$183/yr (+$15/mo · 10.3%)
ⓘ Screening estimate from a state-policy table — verify with the county assessor before closing.
Climate risk First Street
- Flood 1/10 Low FEMA zone X (unshaded) · 0% chance over 30 yrs
- Wildfire 4/10 Moderate
- Heat 5/10 Major 5 d/yr ≥98°F today · 18 d/yr by 30 yrs out
- Wind 1/10 Low
- Air quality 1/10 Low 0 unhealthy d/yr today · 0 by 30 yrs out
Nearby sold comps map
Loading sold comps map…
Walkable amenities ~0.75 mi
Loading nearby amenities…
Taxation est. · year 1
- Rental income
- $23,158
- − Mortgage interest
- −$13,724
- − Property taxes
- −$1,777
- − Insurance
- −$1,225
- − Repairs & maintenance
- −$1,853
- − Management
- −$1,853
- − Depreciation
- −$7,127
- Taxable loss
- −$4,400
- Est. tax savings @ 24.0%
- +$1,056
- After-tax cash flow
- $931/yr
For passive investors: Depreciation is non-cash, so a rental often shows a tax loss while cash-flowing — sheltering income. Rental losses are passive: they offset passive income freely, and up to $25,000/yr can offset ordinary (W-2) income if you actively participate and your MAGI is under $100k (phasing out to $0 by $150k); unused losses carry forward. On sale, claimed depreciation is recaptured at up to 25%, and gains may owe capital-gains tax (a 1031 exchange can defer both). Figures are a year-1 estimate at your 24.0% rate — not tax advice; consult a CPA.
Schools (NCES district)
- District
- Las Cruces Public Schools
- NCES district ID
- 3501500
- Math proficiency
- 42% ▲ 24.00%
- Reading proficiency
- 68% ▲ 35.00%
- Median HH income
- $41,157
- Composite
- 45.98/100
- National rank
- #2535
- State rank
- #5 of 29 in NM
Livability — Las Cruces
- Score
- 59/100
- State rank
- #120
- US rank
- #19687
Category grades
Schools grade is shown separately in the Schools card above.
Census & demographics
- Census place
- Las Cruces, NM
- County
- Dona Ana County · 144,044 people
- City population
- 131,421
- Metro
- Las Cruces, NM
- Population (ZIP)
- 33,158
- Household income
- $69,052
- Rent vs Own
- Severe rent burden
- 717.0
Population outlook (Doña Ana County) Hauer SSP2
- Today (2025)
- 219,177 people
- By 2030
- 220,967 · +0.8%
- By 2040
- 222,775 · +1.6%
- By 2050
- 223,576 · +2.0%
- By 2075
- 228,461 · +4.2%
- By 2100
- 214,536 · -2.1%
Race, ethnicity, and origin ACS 2023
- Neighborhood character
- Majority Hispanic (63%)
- Race & ethnicity
- Hispanic / Latino 63% White 32% Two or more races 25% Native American 2% Black 1% Asian 1%
- Hispanic origin (detail)
- Mexican 55%
- Common ancestry
- Slovak 2% Russian 1% Iranian 1%
- Foreign-born
- 10% · Canada, South Korea
- Languages at home
- 65% English-only · Spanish 33%
Political lean MEDSL · Doña Ana
- 2024 margin
- Lean D (+9.8) · D 53.8% · R 44.0% · Other 2.2%
- 2008→2024 swing
- -7.9pp toward R · 2008: 17.6pp · 2024: 9.8pp
- All cycles
- 2024: D+9.8 2020: D+18.3 2016: D+18.0 2012: D+14.9 2008: D+17.6
Not yet ingested
- Civics
- —
Market trends
- HPI YoY
- ▼ -66.04%
- Current HPI
- 185.7733
- Rent YoY
- ▲ 3.52%
- Metro
- Las Cruces, NM
- State GDP YoY
- —
- F500 in state
- 0
Price history
+0.0% since first listed7 events — show timeline
- 2026-06-01 Pending — SNMMLS as distributed by MLS GRID
- 2026-05-30 Listed $245,000 SNMMLS as distributed by MLS GRID
- 2026-04-27 Coming Soon $245,000 SNMMLS as distributed by MLS GRID
- 2013-06-21 Sold (Public Records) — Public Records
- 2007-11-30 Sold (Public Records) — Public Records
- 2005-12-05 Sold (Public Records) — Public Records
- 2005-12-02 Sold (Public Records) — Public Records
Property tax history
+3.2%/yrLatest (2025): $1,777 · +2.4% YoY. Source: county tax records.
Cash-flow waterfall
monthlySold comps — $/sqft
last 12 mo · ≤1 miLoading sold comps…