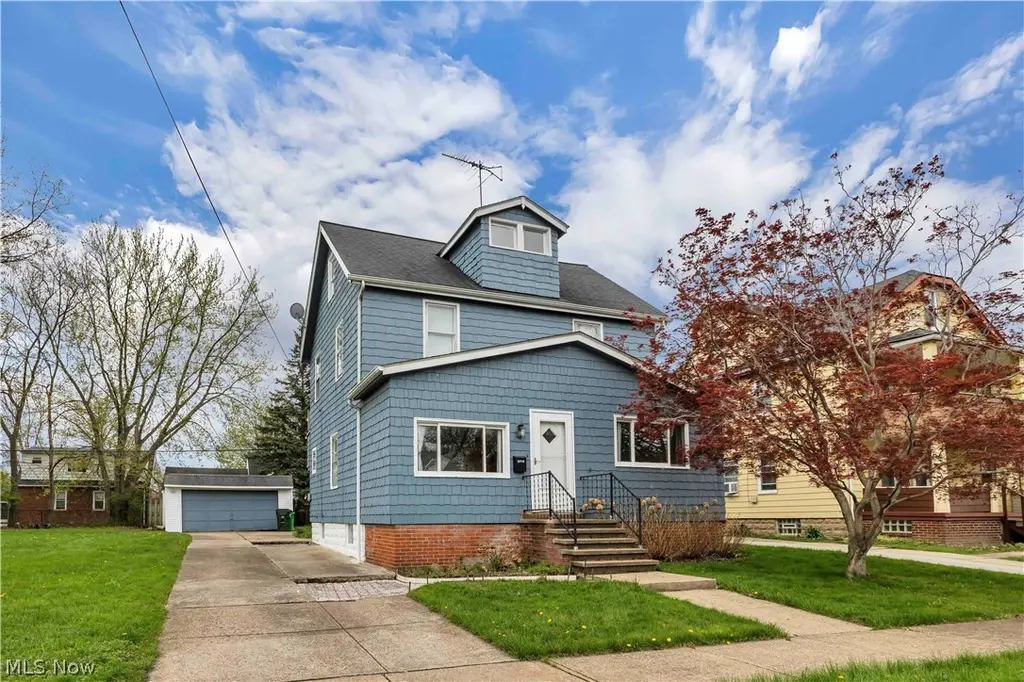
20710 Fuller Ave · Euclid, OH
Flood risk 1/10 · Minimal
- FEMA flood zone
- X (unshaded)
- Chance of flooding over 30 yrs
- 0.0%
- Est. flood insurance / yr
- $473 – $860
Fire risk 1/10 · Minimal
- Est. fire insurance / yr
- $713 – $1,323
Heat risk 3/10 · Minor
- Hot days now (above 94°F)
- 7 days/yr
- Hot days in 30 yrs
- 17 days/yr
Wind risk 1/10 · Minimal
- Chance of severe wind over 30 yrs
- —
Air-quality risk 3/10 · Minor
- Unhealthy air days now
- 3 days/yr
- Unhealthy air days in 30 yrs
- 4 days/yr
Risk factors via First Street. Map © Google.
Why this score? — see what drove the C+ grade
The composite is a weighted blend of 9 inputs, each scored 0–100. Each bar is that input's sub-score; the figure is the points it added to the 100-point composite (weight × sub-score).
- Cash flow +23.2/30.0
- ARV discount +15.0/15.0
- DSCR +7.4/10.0
- 1% rule +6.9/10.0
- Livability +3.9/5.0
- Rent growth +3.8/5.0
- Condition / age +2.5/5.0
- Schools +1.7/10.0
- Appreciation +0.0/10.0
$119,900
🖨 Deal sheet (PDF) 📄 Offer letter ✓ Due diligence
Listing remarks
Own or invest in this generously sized home in Euclid! Two parcels mean a little extra room to roam and more space while still in the city near amenities. The main floor includes a large living area, dining room, kitchen and half bath. The second floor includes 3 bedrooms and a full bath. Large walk-up attic for extra storage or whatever else your imagination can come up with. Full basement with additional full bath. Two car detached garage and plenty of off-street parking.
Key facts
- Half bath
- Two parcels
- Large living area
Tags
Property features AI
Exterior
- Parking: Detached 2-car garage
- Utilities: Public water; Public sewer; Electric service (standard connections implied)
- Home design: Two-story home; Above-grade finished area recorded (1,486)
- Construction: Vinyl siding construction; Shingle roof
- Exterior features: Vinyl siding; Shingle roof; Lot approximately 0.264 acres
Interior
- Bedrooms: Total of 6 rooms (bedrooms included within total room count)
- Bathrooms: Two full bathrooms; One half bathroom; One main-level bathroom
- Heating & cooling: Forced air heating
- Interior features: Full basement
Neighborhood map
What this means for you Summary
Snapshot
- This is a 3-bed/1.0-bath single-family listed at $120k.
Deal economics
- At list price, monthly cash flow is $217 ($3k/yr) — positive.
- The deal already cash-flows at list — no discount required.
- Meets the 1% rule at list price ($1k rent vs $120k).
- Cap rate 8.5% vs local median 6.8% in Euclid — meaningfully above typical; check what's discounted (condition, days-on-market, listing class) to confirm the premium yield is real.
Location & tenants
- Location reads 77/100 on livability (#204 in OH, #3,149 nationally) — a middle-class / working-renter tenant base. Strengths: cost of living A+, housing A+, crime B+; Watch: schools C-, commute F, employment D-.
- Euclid City (suburban): math 14% / reading 28% proficiency, ranked #625 of 656 in OH (top 95%) — low school quality limits family demand, transient renter base, plan for 1-2y turnover; 70% free/reduced lunch — lower-income household profile, screen leases tightly.
- Market conditions: Rents rising fast (+5.3%/yr); 93 active listings in the ZIP; 36 comparable units currently listed for rent nearby; rentals at typical pace (median 22d on market — plan ~3-4 weeks tenant-placement turnaround); 1,441 units permitted in Cuyahoga County in 2024 (700 in 5+ unit buildings).
- This rent runs 31% of the median local income ($56k/yr) — at the standard rent-burdened threshold; future hikes will face affordability resistance.
Forward outlook
- Local home prices are declining (-3.0%/yr); year-one equity from $829 of loan paydown is wiped out by about $4k of value loss. Plan a longer hold.
- Cuyahoga County population projected to shrink 8% by 2050 — rents likely to lag national; underwrite the cash flow, not the appreciation.
- At projected returns (-3.0% appreciation + 5.3% rent growth), your $34k cash investment doubles in ~10 years — after that, you're playing with house money.
Negotiation context
- Only 12 days on market — expect competitive offers; lowballing is unlikely to land.
- 3 sale attempts since 20y ago with the ask held roughly flat each time — persistent listings suggest the price (not the market) is what's stuck; bring a comps-based counter.
- Current owner paid $74k; list at $120k implies a 63% gain — meaningful room to come down on a strong offer.
Risks & watch-outs
- Watch-outs: built in 1924 — expect roof / HVAC / electrical / plumbing capex.
Questions for the listing agent
- Built in 1924 — when were the roof, HVAC, electrical panel, plumbing, and water heater last replaced?
- Is there a deadline driving the sale (1031 exchange, divorce, estate, relocation)? That informs how much negotiation room exists.
- What's the average days-on-market for RENTAL listings here right now (not sales)? A rising rental-DOM trend means longer vacancies and softer asking-rent achievability than the comps imply.
- What's the recent tenant-quality profile in this submarket — average credit score on applications, eviction rate, late-payment / NSF rate, and stable-employment percentage? A property-management company in the area should have these aggregated.
- How much new for-sale + rental construction is in the pipeline within 1–3 miles? Heavy new supply typically softens prices + rents 12–24 months out; constrained supply supports both.
Investment metrics
- 1% rule
- 1.19% ✓
- Cap rate
- 8.46%
- Cash-on-cash
- 7.74%
- DSCR
- 1.34
- GRM
- 7.0
CMA / ARV
- ARV (on-the-fly)
- $173,862
- Comps found
- 12
Show comp detail 12 sales within ~0.75 mi
| Address | Dist | Beds/Ba | Sqft | Sold | Price | $/sf | Match |
|---|---|---|---|---|---|---|---|
| 21131 Morris Ave | 0.25mi | 4/1.0 (+1) | 1,440 (-3%) | 0mo | $134,500 | $93 | 78 |
| 304 E 197th St | 0.30mi | 3/1.5 | 1,537 (+3%) | 3mo | $185,000 | $120 | 76 |
| 20700 Crystal Ave | 0.10mi | 4/1.5 (+1) | 1,287 (-13%) | 2mo | $109,600 | $85 | 64 |
| 311 E 197th St | 0.27mi | 3/2.0 | 1,340 (-10%) | 4mo | $165,000 | $123 | 64 |
| 174 E 200th St | 0.37mi | 3/1.5 | 1,679 (+13%) | 1mo | $215,000 | $128 | 58 |
| 19381 Monterey Ave | 0.63mi | 3/2.0 | 1,404 (-6%) | 2mo | $145,000 | $103 | 56 |
| 19450 Naumann Ave | 0.56mi | 3/1.0 | 1,352 (-9%) | 4mo | $152,000 | $112 | 55 |
| 19251 Abby Ave | 0.72mi | 3/1.5 | 1,407 (-5%) | 1mo | $160,000 | $114 | 55 |
| 19401 Meredith Ave | 0.49mi | 4/1.5 (+1) | 1,344 (-10%) | 2mo | $62,500 | $47 | 52 |
| 91 E 212th St | 0.71mi | 3/2.0 | 1,393 (-6%) | 1mo | $205,000 | $147 | 52 |
| 174 E 208th St | 0.47mi | 4/1.5 (+1) | 1,707 (+15%) | 0mo | $265,000 | $155 | 46 |
| 21250 Milan Ave | 0.55mi | 4/1.0 (+1) | 1,285 (-14%) | 3mo | $150,000 | $117 | 45 |
Match score weights: distance 35% · size 25% · config 20% · recency 20%. Top-matched comps best support the ARV.
Projected returns pro-forma
-3.0% appreciation · 5.28% rent growth · sell at horizon
- IRR
- -1.7%
- Equity multiple
- 0.93×
- Total profit
- $-2,205
- Equity at exit
- $17,877
- IRR
- 10.5%
- Equity multiple
- 1.91×
- Total profit
- $30,570
- Equity at exit
- $10,367
Cash invested: $33,572 (down + closing). Projections, not guarantees.
Landlord ↔ Tenant lean methodology
- Overall (STATE)
- 73 Landlord-Friendly
- State Ohio
- 73 Landlord-Friendly · R+6
- County
- — inherits STATE
- City
- — inherits STATE
ZIP-level market 44123
- Home prices YoY
- -25.0%
- Rents YoY
- 5.3%
- Active inventory
- 93
- Price-to-rent
- 7.0×
Monthly cashflow live
- Estimated rent
- $1,430 high interval (Pro) →
- Mortgage (P&I)
- −$629
- Tax from tax record
- −$235 /mo · $2,816/yr
- Insurance
- −$50
- HOA
- −$0
- Vacancy / Maint / Mgmt
- −$300
- Net cashflow
- $217
Break-even live
Sensitivity live
| Price | -10% $284 | -5% $251 | +0% $217 | +5% $183 | +10% $149 |
|---|---|---|---|---|---|
| Rent | -10% $104 | -5% $160 | +0% $217 | +5% $273 | +10% $330 |
| Rate | -1.0pp $277 | -0.5pp $247 | base $217 | +0.5pp $186 | +1.0pp $154 |
UW: 25.0% down · 7.5% · 30yr · 1.5% tax · 5.0% vac · 8.0% maint · 8.0% mgmt
Financing live
Cash to close
- Down payment
- $29,975
- Closing costs
- $3,597
- Reserves months
- —
- Total cash needed
- —
Loan-product check · same deal, 3 products live
Conventional
25% down · 7.5% · 30yr
- Down + closing
- —
- Monthly P&I
- —
- Monthly cashflow
- —
- DSCR
- —
- Eligible?
- —
Personal DTI + credit; lowest rate.
DSCR
20% down · 8.5% · 30yr
- Down + closing
- —
- Monthly P&I
- —
- Monthly cashflow
- —
- DSCR
- —
- Eligible?
- —
No personal income docs; deal must DSCR.
Hard money
10% down · 12.0% · 12mo
- Down + closing
- —
- Monthly P&I
- —
- Monthly cashflow
- —
- DSCR
- —
- Eligible?
- —
Short-term bridge; refi at stabilization.
Rent comps 36 comps
| Address | Beds | Baths | Sqft | Rent | $/sqft | DOM | Units | Dist |
|---|---|---|---|---|---|---|---|---|
| 20500 Priday Ave Euclid, OH | 4.0 | 1.5 | 1698 | $1,750 | $1.03 | 45d | 1 | 0.07mi |
| 21000 Priday Ave Euclid, OH | 3.0 | 1.0 | 1200 | $1,300 | $1.08 | 44d | 1 | 0.12mi |
| 20500 Morris Ave Euclid, OH | 3.0 | 1.0 | 1104 | $1,399 | $1.27 | 44d | 1 | 0.24mi |
| 21251 S Lake Shore Blvd Euclid, OH | 3.0 | 2.0 | 1246 | $1,595 | $1.28 | 44d | 1 | 0.26mi |
| 299 E 197th St Cleveland, OH | 4.0 | 2.0 | 1328 | $1,400 | $1.05 | 17d | 1 | 0.27mi |
| 404 E 200th St Cleveland, OH | 2.0 | 1.0 | 884 | $1,095 | $1.24 | 44d | 1 | 0.32mi |
| 21751 Priday Ave Euclid, OH | 3.0 | 1.0 | 1174 | $1,545 | $1.32 | 22d | 1 | 0.35mi |
| 21271 Nicholas Ave Euclid, OH | 3.0 | 2.0 | 1300 | $1,689 | $1.30 | 44d | 1 | 0.36mi |
| 455 E 200th St Cleveland, OH | 2.0 | 1.0 | 950 | $1,150 | $1.21 | 24d | 1 | 0.37mi |
| 21301 Arbor Ave Euclid, OH | 3.0 | 1.0 | 1050 | $1,450 | $1.38 | 20d | 1 | 0.46mi |
| 540 E 208th St Cleveland, OH | 2.0 | 1.0 | 1189 | $1,025 | $0.86 | 44d | 1 | 0.46mi |
| 488 E 222nd St Unit Up Euclid, OH | 2.0 | 1.0 | 900 | $1,100 | $1.22 | 22d | 1 | 0.50mi |
| 26200 S Lake Shr Euclid, OH | 3.0 | 1.5 | 1305 | $1,225 | $0.94 | 8d | 1 | 0.50mi |
| 21860 Roberts Ave Euclid, OH | 3.0 | 1.0 | 1253 | $1,450 | $1.16 | 8d | 1 | 0.51mi |
| 21980 Ivan Ave Euclid, OH | 4.0 | 2.0 | 1348 | $1,350 | $1.00 | 44d | 1 | 0.57mi |
| 22370 Tracy Ave Euclid, OH | 3.0 | 1.0 | 1202 | $1,575 | $1.31 | 17d | 1 | 0.61mi |
| 21252 Goller Ave Euclid, OH | 3.0 | 1.0 | 1161 | $1,275 | $1.10 | 21d | 1 | 0.62mi |
| 21250 Goller Ave Cleveland, OH | 3.0 | 1.0 | 1161 | $1,275 | $1.10 | 13d | 1 | 0.62mi |
| 19430 Monterey Ave Cleveland, OH | 3.0 | 1.5 | 898 | $1,236 | $1.38 | 22d | 1 | 0.65mi |
| 20664 Miller Ave Unit Down Unit Euclid, OH | 3.0 | 2.0 | 1100 | $1,200 | $1.09 | 44d | 1 | 0.66mi |
| 19330 Monterey Ave Cleveland, OH | 4.0 | 1.5 | 1578 | $1,450 | $0.92 | 2d | 1 | 0.67mi |
| 19330 Monterey Ave Cleveland, OH | 4.0 | 1.5 | 1200 | $1,450 | $1.21 | 3d | 1 | 0.67mi |
| 18800 Pasnow Ave Cleveland, OH | 3.0 | 1.0 | 1348 | $1,350 | $1.00 | 17d | 1 | 0.71mi |
| 22501 Arms Ave Euclid, OH | 3.0 | 1.0 | 1044 | $1,350 | $1.29 | 24d | 1 | 0.73mi |
| 871 E 212th St Cleveland, OH | 3.0 | 1.5 | 1092 | $1,399 | $1.28 | 44d | 1 | 0.82mi |
| 961 E 224th St Euclid, OH | 3.0 | 1.0 | 1034 | $1,300 | $1.26 | 17d | 1 | 0.85mi |
| 824 E 236th St Euclid, OH | 3.0 | 2.0 | 1100 | $1,720 | $1.56 | 2d | 1 | 0.88mi |
| 645 Babbitt Rd Euclid, OH | 3.0 | 1.0 | 1200 | $1,400 | $1.17 | 13d | 1 | 0.91mi |
| 797 Babbitt Rd #22 Euclid, OH | 3.0 | 1.5 | 1360 | $1,600 | $1.18 | 44d | 1 | 1.05mi |
| 374 E 232nd St Euclid, OH | 3.0 | 1.0 | 1222 | $1,995 | $1.63 | 44d | 1 | 1.07mi |
| 23214 Gay St Euclid, OH | 3.0 | 1.0 | 1634 | $1,864 | $1.14 | 24d | 1 | 1.09mi |
| 23901 Puritan Rd Euclid, OH | 3.0 | 1.0 | 1326 | $1,595 | $1.20 | 15d | 1 | 1.13mi |
| 655 E 240th St Euclid, OH | 3.0 | 1.0 | 1341 | $1,550 | $1.16 | 44d | 1 | 1.15mi |
| 23307 Williams Ave Euclid, OH | 4.0 | 1.0 | 1220 | $1,700 | $1.39 | 24d | 1 | 1.15mi |
| 24200 Puritan Rd Euclid, OH | 3.0 | 1.0 | 1100 | $1,199 | $1.09 | 13d | 1 | 1.24mi |
| 884 E 248th St Euclid, OH | 3.0 | 2.0 | 1440 | $1,699 | $1.18 | 2d | 1 | 1.27mi |
Listing history 9 events
-
2026-04-29status Pending
-
2026-04-17$119,900 Active
-
2007-04-11historical
-
2006-11-10historical
-
2006-10-11$99,900
-
2006-05-10$104,000
-
1994-09-22soldstatus $73,500
-
1988-07-18soldstatus $49,000
-
1988-07-18soldstatus $49,000
ⓘ Source: listings_history table (triggers on properties + properties_extension) + one-shot
backfill from property_details.listing_events for pre-trigger history.
Tax reassessment forecast OH · Partial reset (capped growth)
- Current annual tax
- $2,816 · $235/mo
- Projected year-2 tax
- $2,816 · $235/mo
- Expected delta
- $0/yr ($0/mo · 0.0%)
ⓘ Screening estimate from a state-policy table — verify with the county assessor before closing.
Climate risk First Street
- Flood 1/10 Low FEMA zone X (unshaded) · 0% chance over 30 yrs
- Wildfire 1/10 Low
- Heat 3/10 Moderate 7 d/yr ≥94°F today · 17 d/yr by 30 yrs out
- Wind 1/10 Low
- Air quality 3/10 Moderate 3 unhealthy d/yr today · 4 by 30 yrs out
Nearby sold comps map
Loading sold comps map…
Walkable amenities ~0.75 mi
Loading nearby amenities…
Taxation est. · year 1
- Rental income
- $17,164
- − Mortgage interest
- −$6,716
- − Property taxes
- −$2,816
- − Insurance
- −$600
- − Repairs & maintenance
- −$1,373
- − Management
- −$1,373
- − Depreciation
- −$3,488
- Taxable income
- $798
- Est. tax owed @ 24.0%
- −$192
- After-tax cash flow
- $2,407/yr
For passive investors: Depreciation is non-cash, so a rental often shows a tax loss while cash-flowing — sheltering income. Rental losses are passive: they offset passive income freely, and up to $25,000/yr can offset ordinary (W-2) income if you actively participate and your MAGI is under $100k (phasing out to $0 by $150k); unused losses carry forward. On sale, claimed depreciation is recaptured at up to 25%, and gains may owe capital-gains tax (a 1031 exchange can defer both). Figures are a year-1 estimate at your 24.0% rate — not tax advice; consult a CPA.
Schools (NCES district)
- District
- Euclid City
- NCES district ID
- 3904395
- Math proficiency
- 14% ▼ -19.00%
- Reading proficiency
- 28% ▼ -14.00%
- Median HH income
- $36,385
- Composite
- 17.39/100
- National rank
- #9067
- State rank
- #625 of 656 in OH
Livability — Euclid
- Score
- 77/100
- State rank
- #204
- US rank
- #3149
Category grades
Schools grade is shown separately in the Schools card above.
Census & demographics
- Census place
- Euclid, OH
- County
- Cuyahoga County · 1,090,369 people
- City population
- 41,855
- Metro
- Cleveland-Elyria, OH
- Population (ZIP)
- 18,050
- Household income
- $55,676
- Rent vs Own
- Severe rent burden
- 1085.0
Population outlook (Cuyahoga County) Hauer SSP2
- Today (2025)
- 1,244,621 people
- By 2030
- 1,230,093 · -1.2%
- By 2040
- 1,189,108 · -4.5%
- By 2050
- 1,145,706 · -7.9%
- By 2075
- 1,076,557 · -13.5%
- By 2100
- 978,987 · -21.3%
Race, ethnicity, and origin ACS 2023
- Neighborhood character
- Majority Black (65%)
- Race & ethnicity
- Black 65% White 28% Two or more races 6% Hispanic / Latino 1%
- Common ancestry
- Romanian 5%
- Foreign-born
- 2% · Canada
- Languages at home
- 96% English-only · Spanish 2% Chinese 1%
Political lean MEDSL · Cuyahoga
- 2024 margin
- Solid D (+31.5) · D 65.4% · R 33.9%
- 2008→2024 swing
- -7.4pp toward R · 2008: 38.9pp · 2024: 31.5pp
- All cycles
- 2024: D+31.5 2020: D+34.1 2016: D+35.0 2012: D+38.7 2008: D+38.9
Not yet ingested
- Civics
- —
Market trends
- HPI YoY
- ▼ -62.82%
- Current HPI
- 188.4932
- Rent YoY
- ▲ 5.28%
- Metro
- Cleveland-Elyria, OH
- State GDP YoY
- ▲ 1.98%
- F500 in state
- 48
Industry mix (Fortune 500 HQ in OH)
| Industry | F500 HQs | Revenue |
|---|---|---|
| Insurance | 3 | $145B |
|
||
| Industrial Machinery | 3 | $49B |
|
||
| Financial Services | 3 | $24B |
|
||
| Consumer Goods | 2 | $93B |
|
||
| Aerospace / Defense | 2 | $47B |
|
||
| Utilities | 2 | $33B |
|
||
Price history
+144.7% since first listed9 events — show timeline
- 2026-04-29 Pending — MLSNOW
- 2026-04-17 Listed $119,900 MLSNOW
- 2007-04-11 Listing Removed — MLSNOW
- 2006-11-10 Listing Removed — MLSNOW
- 2006-10-11 Listed $99,900 MLSNOW
- 2006-05-10 Listed $104,000 MLSNOW
- 1994-09-22 Sold (Public Records) $73,500 Public Records
- 1988-07-18 Sold (Public Records) $49,000 Public Records
- 1988-07-18 Sold (Public Records) $49,000 Public Records
Property tax history
+5.2%/yrLatest (2025): $2,816 · -3.0% YoY. Source: county tax records.
Cash-flow waterfall
monthlySold comps — $/sqft
last 12 mo · ≤1 miLoading sold comps…