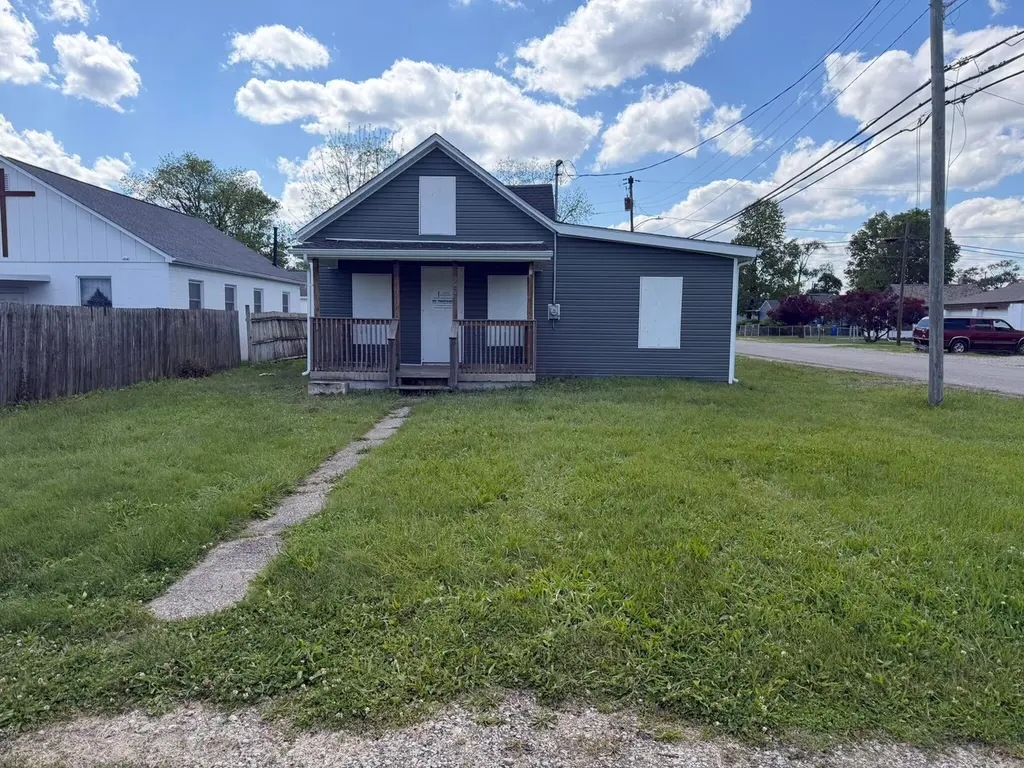
851 Clarendon Ave · Columbus, OH
Flood risk 1/10 · Minimal
- FEMA flood zone
- X (unshaded)
- Chance of flooding over 30 yrs
- 0.0%
- Est. flood insurance / yr
- $507 – $1,088
Fire risk 1/10 · Minimal
- Est. fire insurance / yr
- $713 – $1,323
Heat risk 4/10 · Minor
- Hot days now (above 100°F)
- 7 days/yr
- Hot days in 30 yrs
- 18 days/yr
Wind risk 2/10 · Minimal
- Chance of severe wind over 30 yrs
- 1.0%
Air-quality risk 2/10 · Minimal
- Unhealthy air days now
- 1 days/yr
- Unhealthy air days in 30 yrs
- 2 days/yr
Risk factors via First Street. Map © Google.
Why this score? — see what drove the C grade
The composite is a weighted blend of 9 inputs, each scored 0–100. Each bar is that input's sub-score; the figure is the points it added to the 100-point composite (weight × sub-score).
- Cash flow +16.5/30.0
- ARV discount +15.0/15.0
- 1% rule +7.8/10.0
- DSCR +5.1/10.0
- Livability +4.0/5.0
- Rent growth +3.7/5.0
- Condition / age +2.5/5.0
- Schools +1.7/10.0
- Appreciation +0.0/10.0
$99,000
🖨 Deal sheet 📄 Offer letter ✓ Due diligence
Listing remarks
THE REALTOR IS THE RECEIVER APPOINTED BY THE FRANKLIN COUNTY MUNICIPAL COURT, ENVIRONMENTAL DIVISION. Great opportunity to rehab this property and make it your own. The interior has been cleaned out and new siding installed. Due to the court approval process, this is not a quick close. The Receiver requests for in-state buyers only. * * SEE AGENT TO AGENT REMARKS * *
Key facts
- Rehab opportunity
- New siding installed
- Interior cleaned out
Tags
Property features AI
Finance
- Other: Third-party approval required
- Financial info: Taxes listed for 2024
Exterior
- Parking: Detached garage (1 car); Farm building on property
- Utilities: Public water; Public sewer
- Home design: Single-family home; One and one-half stories; Built in 1940; No common walls
- Construction: Block foundation; Originally built in 1940
- Exterior features: Block foundation; 0.13-acre lot
Interior
- Bedrooms: 2 main-level bedrooms
- Bathrooms: 1 full bathroom
- Interior features: Crawl space basement
Neighborhood map
What this means for you Summary
Snapshot
- This is a 3-bed/1.0-bath single-family listed at $99k.
Deal economics
- At list price, monthly cash flow is $57 ($689/yr) — positive.
- The deal already cash-flows at list — no discount required.
- Meets the 1% rule at list price ($1k rent vs $99k).
- Recommended offer: $96k (3.0% below list) — sets the bar for market timing.
- Cap rate 7.0% vs local median 3.8% in Columbus — top-decile yield for the area; either an underpriced asset or a hidden risk that comps aren't pricing in. Stress-test before assuming the spread holds.
Location & tenants
- Location reads 81/100 on livability (#97 in OH, #1,491 nationally) — a professional / high-income tenant draw. Strengths: commute A+, cost of living A+, housing A+; Watch: employment C-, crime F.
- Columbus City School District (urban): math 15% / reading 26% proficiency, ranked #626 of 656 in OH (top 95%) — low school quality limits family demand, transient renter base, plan for 1-2y turnover; 72% free/reduced lunch — lower-income household profile, screen leases tightly.
- Market conditions: Rents rising fast (+4.6%/yr); 144 active listings in the ZIP; 40 comparable units currently listed for rent nearby; rentals at typical pace (median 24d on market — plan ~3-4 weeks tenant-placement turnaround); 40% of comp listings sitting > 30 days — soft ceiling on asking rent; 8,139 units permitted in Franklin County in 2024 (5,940 in 5+ unit buildings).
- This rent runs 33% of the median local income ($47k/yr) — at the standard rent-burdened threshold; future hikes will face affordability resistance.
Forward outlook
- Local home prices are declining (-3.0%/yr); year-one equity from $684 of loan paydown is wiped out by about $3k of value loss. Plan a longer hold.
- Franklin County population projected at +34% by 2050 — long-run rental-demand tailwind backs the buy-and-hold thesis.
Negotiation context
- It's been on market 41 days — a 3% lower offer ($96k) is reasonable based on typical stale-listing flexibility.
- 4 sale attempts since 28y ago; this cycle's ask has dropped $11k (10%) from the opening price — seller is motivated, your offer sets the floor, not the list.
- Current owner paid $35k; list at $99k implies a 184% gain — meaningful room to come down on a strong offer.
Risks & watch-outs
- Watch-outs: property tax is 4.7% of price; built in 1940 — expect roof / HVAC / electrical / plumbing capex.
Questions for the listing agent
- It's been on market 41 days. Have you received any prior offers? Is the seller open to a 3% concession, seller financing, or rate buy-down credit?
- Built in 1940 — when were the roof, HVAC, electrical panel, plumbing, and water heater last replaced?
- Property tax is high relative to price — has the assessment been appealed recently, and will the sale trigger a re-assessment?
- Is there a deadline driving the sale (1031 exchange, divorce, estate, relocation)? That informs how much negotiation room exists.
- Crime grade is F in this area — have there been break-ins, vandalism, or insurance claims at this property in the last 3 years? What carrier currently insures it and at what premium?
- What's the average days-on-market for RENTAL listings here right now (not sales)? A rising rental-DOM trend means longer vacancies and softer asking-rent achievability than the comps imply.
- What's the recent tenant-quality profile in this submarket — average credit score on applications, eviction rate, late-payment / NSF rate, and stable-employment percentage? A property-management company in the area should have these aggregated.
- How much new for-sale + rental construction is in the pipeline within 1–3 miles? Heavy new supply typically softens prices + rents 12–24 months out; constrained supply supports both.
Investment metrics
- 1% rule
- 1.28% ✓
- Cap rate
- 6.99%
- Cash-on-cash
- 2.49%
- DSCR
- 1.11
- GRM
- 6.5
CMA / ARV
- ARV (median comp)
- $169,070
- List price
- $99,000
- Delta
- -41.44%
- Verdict
- UNDERPRICED
- Comps
- 20 within 1.0 mi
Show comp detail 12 sales within ~0.75 mi
| Address | Dist | Beds/Ba | Sqft | Sold | Price | $/sf | Match |
|---|---|---|---|---|---|---|---|
| 2188 Amherst Ave | 0.36mi | 3/1.0 | 1,136 (-0%) | 4mo | $165,000 | $145 | 80 |
| 611 Whitethorne Ave | 0.32mi | 3/1.0 | 1,110 (-3%) | 3mo | $110,000 | $99 | 78 |
| 676 Butler Ave | 0.29mi | 3/1.5 | 1,054 (-8%) | 4mo | $165,000 | $157 | 68 |
| 446 S Eureka Ave | 0.67mi | 3/1.0 | 1,144 (+0%) | 2mo | $125,000 | $109 | 66 |
| 2712 Eakin Rd | 0.71mi | 3/2.0 | 1,152 (+1%) | 1mo | $233,500 | $203 | 60 |
| 1864 Rosemont Ave | 0.62mi | 3/1.5 | 1,186 (+4%) | 4mo | $222,000 | $187 | 59 |
| 651 S Terrace Ave | 0.51mi | 3/1.5 | 1,248 (+10%) | 2mo | $195,600 | $157 | 57 |
| 686 S Burgess Ave | 0.58mi | 2/1.0 (-1) | 1,056 (-7%) | 1mo | $82,500 | $78 | 55 |
| 1743 Ransburg Ave | 0.71mi | 4/1.0 (+1) | 1,221 (+7%) | 3mo | $172,000 | $141 | 47 |
| 635 Clark Ave | 0.57mi | 2/1.0 (-1) | 997 (-12%) | 4mo | $172,500 | $173 | 44 |
| 2600 Plainview Ave | 0.70mi | 3/1.0 | 976 (-14%) | 1mo | $69,405 | $71 | 43 |
| 1122 Harrisburg Pike | 0.66mi | 3/2.0 | 1,306 (+15%) | 3mo | $185,000 | $142 | 39 |
Match score weights: distance 35% · size 25% · config 20% · recency 20%. Top-matched comps best support the ARV.
Projected returns pro-forma
-3.0% appreciation · 4.61% rent growth · sell at horizon
- IRR
- -9.8%
- Equity multiple
- 0.64×
- Total profit
- $-10,111
- Equity at exit
- $14,761
- IRR
- 2.5%
- Equity multiple
- 1.20×
- Total profit
- $5,511
- Equity at exit
- $8,560
Cash invested: $27,720 (down + closing). Projections, not guarantees.
Landlord ↔ Tenant lean methodology
- Overall (STATE)
- 73 Landlord-Friendly
- State Ohio
- 73 Landlord-Friendly · R+6
- County
- — inherits STATE
- City
- — inherits STATE
ZIP-level market 43223
- Rents YoY
- 4.6%
- Active inventory
- 144
- Price-to-rent
- 6.5×
Monthly cashflow live
- Estimated rent
- $1,271 high interval (Pro) →
- Mortgage (P&I)
- −$519
- Tax from tax record
- −$386 /mo · $4,636/yr
- Insurance
- −$41
- HOA
- −$0
- Vacancy / Maint / Mgmt
- −$267
- Net cashflow
- $57
Break-even live
UW: 25.0% down · 7.5% · 30yr · 1.5% tax · 5.0% vac · 8.0% maint · 8.0% mgmt
Financing live
Cash to close
- Down payment
- $24,750
- Closing costs
- $2,970
- Reserves months
- —
- Total cash needed
- —
Loan-product check · same deal, 3 products live
Conventional
25% down · 7.5% · 30yr
- Down + closing
- —
- Monthly P&I
- —
- Monthly cashflow
- —
- DSCR
- —
- Eligible?
- —
Personal DTI + credit; lowest rate.
DSCR
20% down · 8.5% · 30yr
- Down + closing
- —
- Monthly P&I
- —
- Monthly cashflow
- —
- DSCR
- —
- Eligible?
- —
No personal income docs; deal must DSCR.
Hard money
10% down · 12.0% · 12mo
- Down + closing
- —
- Monthly P&I
- —
- Monthly cashflow
- —
- DSCR
- —
- Eligible?
- —
Short-term bridge; refi at stabilization.
Rent comps 40 comps
| Address | Beds | Baths | Sqft | Rent | $/sqft | DOM | Units | Dist |
|---|---|---|---|---|---|---|---|---|
| 2173 W Mound St Unit A Columbus, OH | 2.0 | 1.0 | 825 | $900 | $1.09 | 43d | 1 | 0.08mi |
| 2167 W Mound St Unit C Columbus, OH | 2.0 | 1.0 | 825 | $900 | $1.09 | 43d | 1 | 0.10mi |
| 2157 W Mound St Unit C Columbus, OH | 2.0 | 1.0 | 825 | $900 | $1.09 | 43d | 1 | 0.12mi |
| 791-793 Butler Ave Unit 791 Columbus, OH | 3.0 | 1.0 | 1000 | $1,395 | $1.40 | 3d | 1 | 0.20mi |
| 947 E Forest Creek Dr Columbus, OH | 2.0 | 1.5 | 950 | $1,200 | $1.26 | 43d | 2 | 0.23mi |
| 695 S Eureka Ave Columbus, OH | 3.0 | 1.0 | 1344 | $1,425 | $1.06 | 21d | 1 | 0.38mi |
| 2203 Clarendon Ln Unit 2203 Columbus, OH | 2.0 | 1.0 | 835 | $1,000 | $1.20 | 12d | 1 | 0.40mi |
| 1928-1930 Vaughn St Unit 1928 Columbus, OH | 2.0 | 1.0 | 919 | $957 | $1.04 | 43d | 1 | 0.47mi |
| 548 S Wayne Ave Columbus, OH | 3.0 | 1.0 | 1008 | $1,225 | $1.22 | 19d | 1 | 0.47mi |
| 2205 Sullivant Ave Columbus, OH | 3.0 | 1.0 | 1275 | $1,200 | $0.94 | 43d | 1 | 0.50mi |
| 521-523 S Wayne Ave Columbus, OH | 3.0 | 1.0 | 1092 | $1,195 | $1.09 | 3d | 1 | 0.52mi |
| 945 Hodges Dr Columbus, OH | 3.0 | 1.0 | 1078 | $1,640 | $1.52 | 23d | 1 | 0.58mi |
| 530 S Terrace Ave Columbus, OH | 2.0 | 1.0 | 896 | $900 | $1.00 | 23d | 1 | 0.59mi |
| 661-663 S Burgess Ave Columbus, OH | 3.0 | 1.0 | 1100 | $1,028 | $0.93 | 43d | 1 | 0.61mi |
| 2545-2547 Sullivant Ave Columbus, OH | 3.0 | 1.0 | 1064 | $1,100 | $1.03 | 10d | 1 | 0.64mi |
| 543 Woodbury Ave Unit NA Columbus, OH | 3.0 | 1.0 | 1308 | $1,645 | $1.26 | 14d | 1 | 0.66mi |
| 616-618 S Ogden Ave Columbus, OH | 3.0 | 1.0 | 1100 | $1,125 | $1.02 | 43d | 1 | 0.67mi |
| 839-841 S Ogden Ave Columbus, OH | 2.0 | 1.0 | 727 | $1,000 | $1.38 | 2d | 1 | 0.69mi |
| 488 Woodbury Ave Columbus, OH | 3.0 | 1.5 | 1222 | $1,250 | $1.02 | 43d | 1 | 0.72mi |
| 329 S Wayne Ave Columbus, OH | 3.0 | 1.0 | 1120 | $1,425 | $1.27 | 3d | 1 | 0.76mi |
| 257 Clarendon Ave Unit 257,259,261,263 Columbus, OH | 2.0 | 1.0 | 1000 | $1,200 | $1.20 | 43d | 1 | 0.78mi |
| 608 Racine Ave #610 Columbus, OH | 3.0 | 1.0 | 1168 | $1,195 | $1.02 | 43d | 1 | 0.79mi |
| 255 Belvidere Ave Columbus, OH | 2.0 | 1.0 | 1144 | $1,195 | $1.04 | 16d | 1 | 0.80mi |
| 2709-2711 Sullivant Ave Unit 2709 Columbus, OH | 3.0 | 2.0 | 1344 | $1,380 | $1.03 | 3d | 1 | 0.81mi |
| 2709-2711 Sullivant Ave Columbus, OH | 3.0 | 2.0 | 1344 | $1,380 | $1.03 | 3d | 1 | 0.81mi |
| 475 S Ogden Ave Columbus, OH | 2.0 | 1.0 | 888 | $1,100 | $1.24 | 23d | 1 | 0.82mi |
| 252-254 S Wayne Ave Unit 254 Columbus, OH | 3.0 | 1.0 | 1120 | $1,300 | $1.16 | 17d | 1 | 0.84mi |
| 427 S Ogden Ave Unit 427 Columbus, OH | 2.0 | 1.0 | 980 | $1,350 | $1.38 | 7d | 1 | 0.86mi |
| 375 S Burgess Ave Columbus, OH | 2.0 | 1.0 | 732 | $950 | $1.30 | 3d | 1 | 0.86mi |
| 375 S Burgess Ave Columbus, OH | 2.0 | 1.0 | 732 | $950 | $1.30 | 19d | 1 | 0.86mi |
| 2210 October Ridge Dr Unit 2232 Columbus, OH | 2.0 | 1.5 | 950 | $1,200 | $1.26 | 3d | 1 | 0.87mi |
| 2210 October Ridge Dr Unit 2224 Columbus, OH | 2.0 | 1.5 | 950 | $1,200 | $1.26 | 23d | 1 | 0.87mi |
| 170 S Highland Ave Columbus, OH | 2.0 | 1.0 | 950 | $895 | $0.94 | 43d | 1 | 0.92mi |
| 490 Helen St Columbus, OH | 2.0 | 1.0 | 840 | $1,200 | $1.43 | 43d | 1 | 0.92mi |
| 190 Nashoba Ave Columbus, OH | 2.0 | 1.0 | 1030 | $1,450 | $1.41 | 19d | 1 | 0.96mi |
| 190 Nashoba Ave Columbus, OH | 2.0 | 1.0 | 1030 | $1,450 | $1.41 | 12d | 1 | 0.96mi |
| 1028 S Harris Ave Columbus, OH | 3.0 | 1.0 | 900 | $1,500 | $1.67 | 43d | 1 | 0.98mi |
| 793 Wiltshire Rd Columbus, OH | 2.0 | 1.0 | 900 | $1,450 | $1.61 | 43d | 1 | 0.99mi |
| 406 1/2 S Hague Ave Columbus, OH | 2.0 | 1.0 | 918 | $765 | $0.83 | 43d | 1 | 1.00mi |
| 802 Harrisburg Pike Columbus, OH | 2.0 | 1.0 | 1250 | $995 | $0.80 | 3d | 1 | 1.00mi |
Listing history 22 events
-
2026-06-18days on market $99,000 Active 41 DOM
-
2026-06-17days on market $99,000 Active 40 DOM
-
2026-06-16days on market $99,000 Active 39 DOM
-
2026-06-15days on market $99,000 Active 38 DOM
-
2026-06-13days on market $99,000 Active 36 DOM
-
2026-06-13pricedays on market $99,000 Active 35 DOM
-
2026-06-09days on market $105,000 Active 32 DOM
-
2026-06-08days on market $105,000 Active 31 DOM
-
2026-06-07days on market $105,000 Active 30 DOM
-
2026-06-05days on market $105,000 Active 27 DOM
-
2026-06-03days on market $105,000 Active 26 DOM
-
2026-06-02days on market $105,000 Active 25 DOM
-
2026-06-01days on market $105,000 Active 24 DOM
-
2026-05-31days on market $105,000 Active 23 DOM
-
2026-05-08$110,000 Active 371-char remark
-
2003-05-27historical
-
2003-03-05$46,500
-
2001-10-18historical
-
2001-07-26$57,500
-
1998-09-25soldstatus $34,900
-
1998-08-01historical
-
1998-03-24$34,900
ⓘ Source: listings_history table (triggers on properties + properties_extension) + one-shot
backfill from property_details.listing_events for pre-trigger history.
Tax reassessment forecast OH · Partial reset (capped growth)
- Current annual tax
- $4,636 · $386/mo
- Projected year-2 tax
- $4,636 · $386/mo
- Expected delta
- $0/yr ($0/mo · 0.0%)
ⓘ Screening estimate from a state-policy table — verify with the county assessor before closing.
Climate risk First Street
- Flood 1/10 Low FEMA zone X (unshaded) · 0% chance over 30 yrs
- Wildfire 1/10 Low
- Heat 4/10 Moderate 7 d/yr ≥100°F today · 18 d/yr by 30 yrs out
- Wind 2/10 Low 100% chance of damaging wind over 30 yrs
- Air quality 2/10 Low 1 unhealthy d/yr today · 2 by 30 yrs out
Nearby sold comps map
Loading sold comps map…
Walkable amenities ~0.75 mi
Loading nearby amenities…
Taxation est. · year 1
- Rental income
- $15,253
- − Mortgage interest
- −$5,546
- − Property taxes
- −$4,636
- − Insurance
- −$495
- − Repairs & maintenance
- −$1,220
- − Management
- −$1,220
- − Depreciation
- −$2,880
- Taxable loss
- −$744
- Est. tax savings @ 24.0%
- +$178
- After-tax cash flow
- $868/yr
For passive investors: Depreciation is non-cash, so a rental often shows a tax loss while cash-flowing — sheltering income. Rental losses are passive: they offset passive income freely, and up to $25,000/yr can offset ordinary (W-2) income if you actively participate and your MAGI is under $100k (phasing out to $0 by $150k); unused losses carry forward. On sale, claimed depreciation is recaptured at up to 25%, and gains may owe capital-gains tax (a 1031 exchange can defer both). Figures are a year-1 estimate at your 24.0% rate — not tax advice; consult a CPA.
Schools (NCES district)
- District
- Columbus City School District
- NCES district ID
- 3904380
- Math proficiency
- 15% ▼ -17.00%
- Reading proficiency
- 26% ▼ -12.00%
- Median HH income
- $38,483
- Composite
- 17.19/100
- National rank
- #9105
- State rank
- #626 of 656 in OH
Livability — Columbus
- Score
- 81/100
- State rank
- #97
- US rank
- #1491
Category grades
Schools grade is shown separately in the Schools card above.
Census & demographics
- Census place
- Columbus, OH
- County
- Franklin County · 1,351,780 people
- City population
- 612,189
- Metro
- Columbus, OH
- Population (ZIP)
- 28,187
- Household income
- $46,911
- Rent vs Own
- Severe rent burden
- 1689.0
Population outlook (Franklin County) Hauer SSP2
- Today (2025)
- 1,456,139 people
- By 2030
- 1,556,890 · +6.9%
- By 2040
- 1,757,349 · +20.7%
- By 2050
- 1,950,539 · +34.0%
- By 2075
- 2,376,171 · +63.2%
- By 2100
- 2,636,796 · +81.1%
Race, ethnicity, and origin ACS 2023
- Neighborhood character
- Diverse neighborhood (Simpson 0.55)
- Race & ethnicity
- White 63% Black 22% Two or more races 8% Hispanic / Latino 8%
- Hispanic origin (detail)
- Mexican 4% Puerto Rican 3%
- Common ancestry
- Romanian 4% Italian 1% Slovak 1%
- Foreign-born
- 5% · Canada
- Languages at home
- 91% English-only · Spanish 5%
Political lean MEDSL · Franklin
- 2024 margin
- Strong D (+28.4) · D 63.7% · R 35.3% · Other 1.0%
- 2008→2024 swing
- +7.7pp toward D · 2008: 20.7pp · 2024: 28.4pp
- All cycles
- 2024: D+28.4 2020: D+31.4 2016: D+25.9 2012: D+21.7 2008: D+20.7
Not yet ingested
- Civics
- —
Market trends
- HPI YoY
- ▼ -135.33%
- Current HPI
- 211.6742
- Rent YoY
- ▲ 4.61%
- Metro
- Columbus, OH
- State GDP YoY
- ▲ 1.98%
- F500 in state
- 48
Industry mix (Fortune 500 HQ in OH)
| Industry | F500 HQs | Revenue |
|---|---|---|
| Insurance | 3 | $145B |
|
||
| Industrial Machinery | 3 | $49B |
|
||
| Financial Services | 3 | $24B |
|
||
| Consumer Goods | 2 | $93B |
|
||
| Aerospace / Defense | 2 | $47B |
|
||
| Utilities | 2 | $33B |
|
||
Price history
+183.7% since first listed10 events — show timeline
- 2026-06-12 Price Changed $99,000 CBRMLS
- 2026-05-22 Price Changed $105,000 CBRMLS
- 2026-05-08 Listed $110,000 CBRMLS
- 2003-05-27 Listing Removed — CBRMLS
- 2003-03-05 Listed $46,500 CBRMLS
- 2001-10-18 Listing Removed — CBRMLS
- 2001-07-26 Listed $57,500 CBRMLS
- 1998-09-25 Sold (MLS) $34,900 CBRMLS
- 1998-08-01 Listing Removed — CBRMLS
- 1998-03-24 Listed $34,900 CBRMLS
Property tax history
+20.7%/yrLatest (2024): $4,636 · +39.6% YoY. Source: county tax records.
Cash-flow waterfall
monthlySold comps — $/sqft
last 12 mo · ≤1 miLoading sold comps…