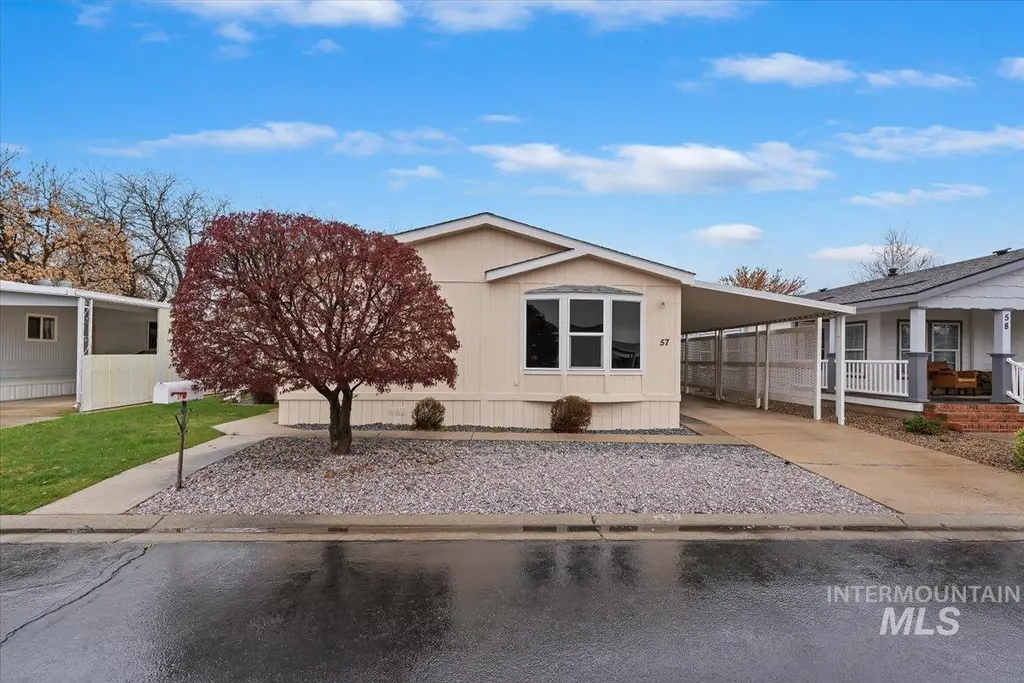
9390 W Ustick Rd #57 · Boise City, ID
Flood risk 1/10 · Minimal
- FEMA flood zone
- X (unshaded)
- Chance of flooding over 30 yrs
- 0.0%
- Est. flood insurance / yr
- $507 – $1,088
Fire risk 1/10 · Minimal
- Est. fire insurance / yr
- $584 – $1,086
Heat risk 4/10 · Minor
- Hot days now (above 96°F)
- 7 days/yr
- Hot days in 30 yrs
- 18 days/yr
Wind risk 1/10 · Minimal
- Chance of severe wind over 30 yrs
- —
Air-quality risk 8/10 · Major
- Unhealthy air days now
- 14 days/yr
- Unhealthy air days in 30 yrs
- 19 days/yr
Risk factors via First Street. Map © Google.
Why this score? — see what drove the B+ grade
The composite is a weighted blend of 9 inputs, each scored 0–100. Each bar is that input's sub-score; the figure is the points it added to the 100-point composite (weight × sub-score).
- Cash flow +30.0/30.0
- ARV discount +15.0/15.0
- DSCR +10.0/10.0
- 1% rule +9.1/10.0
- Schools +5.2/10.0
- Rent growth +3.0/5.0
- Livability +2.5/5.0
- Condition / age +2.5/5.0
- Appreciation +0.0/10.0
$122,900
🖨 Deal sheet (PDF) 📄 Offer letter ✓ Due diligence
Listing remarks
Don’t miss this Lock It & Leave It cozy Manu. in West Boise! This quaint 55+ Community offers amenities that include a clubhouse, in-ground swimming pool & a parking space for your RV or Trailer! Truly a way to keep some roots but continue to travel at will with confidence. This 3 bedroom 2 bath offers a large kitchen with eating area featuring granite countertops & center island. Split bedroom floor plan with a nice sized primary bedroom featuring a large walk-in closet & bathroom. Spacious living/family room with a nice large window for natural lighting. Fresh exterior paint & nice low maintenance Trex decking at both entries. This lot offers two storag
Key facts
- Large kitchen
- Parking space for rv
- Granite countertops
Tags
Property features AI
Finance
- Other: Private paved road frontage
- HOA & community: Located in an over-55 / senior community (mobile home park); Community pool
Exterior
- Parking: 2 covered spaces; 2-car carport; RV access/parking; Finished driveway
- Utilities: City water service; Sewer connected; Broadband internet available
- Home design: Mobile/manufactured home on rented lot; Built in 2002
- Construction: HardiPlank-type siding; Composition roof; Accessible approach with ramp; Bathroom grab bars
- Exterior features: Metal fencing; Covered patio/deck; Garden; Auto sprinkler system / full sprinkler system; Winter access; Storage shed; Community in-ground pool
Interior
- Kitchen: Kitchen on main level (~12 x 13); Dishwasher; Disposal; Freestanding oven/range; Kitchen island; Granite counters
- Bedrooms: 3 bedrooms, all on the main level (Primary: ~14 x 13; Bedroom 2: ~10 x 10; Bedroom 3: ~11 x 13)
- Flooring: Carpet; Laminate
- Bathrooms: 2 bathrooms (includes bath in master bedroom)
- Heating & cooling: Electric forced air heating; Central air conditioning
- Interior features: Bath in master bedroom; Master bedroom on main level; Walk-in closet(s); Kitchen island; Granite counters
- Laundry & utility: Utility room on main level (~6 x 7)
Neighborhood map
What this means for you Summary
Snapshot
- This is a 3-bed/2.0-bath manufactured listed at $123k.
Deal economics
- At list price, monthly cash flow is $515 ($6k/yr) — positive.
- The deal already cash-flows at list — no discount required.
- Meets the 1% rule at list price ($2k rent vs $123k).
- Recommended offer: $116k (6.0% below list) — sets the bar for market timing.
- Cap rate 11.3% vs local median 2.6% in Boise City — top-decile yield for the area; either an underpriced asset or a hidden risk that comps aren't pricing in. Stress-test before assuming the spread holds.
Location & tenants
- Location reads: area grade B — affects rentability + tenant quality, not the cash-flow math above.
- Joint School District No. 2 (suburban): math 53% / reading 67% proficiency, ranked #11 of 92 in ID (top 12%) — acceptable for families but not a draw, mixed tenant base, ~2y average lease.
- Zoned schools: Pioneer School of The Arts (math 76% / reading 79%, grade A, #8 of 357 statewide, top 2%, 667 students, 15% FRL); Lowell Scott Middle School (math 41% / reading 67%, grade B-, #20 of 109 statewide, top 19%, 802 students, 24% FRL); Centennial High School (math 53% / reading 76%, grade B-, #10 of 169 statewide, top 7%, 1,931 students, 22% FRL) — zoned schools at 20% FRL track the district average.
- Market conditions: Rents rising (+1.9%/yr); 194 active listings in the ZIP; 17 comparable units currently listed for rent nearby; rentals at typical pace (median 17d on market — plan ~3-4 weeks tenant-placement turnaround); 5,129 units permitted in Ada County in 2024 (414 in 5+ unit buildings).
Forward outlook
- Local home prices are declining (-3.0%/yr); year-one equity from $850 of loan paydown is wiped out by about $4k of value loss. Plan a longer hold.
- Ada County population projected at +45% by 2050 — long-run rental-demand tailwind backs the buy-and-hold thesis.
- At projected returns (-3.0% appreciation + 1.9% rent growth), your $34k cash investment doubles in ~8 years — after that, you're playing with house money.
Negotiation context
- It's been on market 76 days — a 6% lower offer ($116k) is reasonable based on typical stale-listing flexibility.
- 5 sale attempts since 10y ago; this cycle's ask has dropped $27k (18%) from the opening price — seller is motivated, your offer sets the floor, not the list.
Questions for the listing agent
- It's been on market 76 days. Have you received any prior offers? Is the seller open to a 6% concession, seller financing, or rate buy-down credit?
- Why hasn't it sold? Are there any deal-killer items the seller is aware of (foundation, flood, title, zoning, code violations)?
- Is there a deadline driving the sale (1031 exchange, divorce, estate, relocation)? That informs how much negotiation room exists.
- What's the average days-on-market for RENTAL listings here right now (not sales)? A rising rental-DOM trend means longer vacancies and softer asking-rent achievability than the comps imply.
- What's the recent tenant-quality profile in this submarket — average credit score on applications, eviction rate, late-payment / NSF rate, and stable-employment percentage? A property-management company in the area should have these aggregated.
- How much new for-sale + rental construction is in the pipeline within 1–3 miles? Heavy new supply typically softens prices + rents 12–24 months out; constrained supply supports both.
Investment metrics
- 1% rule
- 1.41% ✓
- Cap rate
- 11.32%
- Cash-on-cash
- 17.96%
- DSCR
- 1.80
- GRM
- 5.9
CMA / ARV
- ARV (on-the-fly)
- $168,750
- Comps found
- 11
Show comp detail 11 sales within ~0.75 mi
| Address | Dist | Beds/Ba | Sqft | Sold | Price | $/sf | Match |
|---|---|---|---|---|---|---|---|
| 9390 W Ustick Rd Trlr 26 | 0.05mi | 3/2.0 | 1,344 (-0%) | 2mo | $189,000 | $141 | 95 |
| 3467 N Dalton Ln | 0.06mi | 3/2.0 | 1,456 (+8%) | 2mo | $145,000 | $100 | 82 |
| 9390 W Ustick Rd #58 | 0.05mi | 2/2.0 (-1) | 1,482 (+10%) | 6mo | $259,990 | $175 | 71 |
| 9390 W Ustick Rd #2 | 0.00mi | 3/2.0 | 1,492 (+10%) | 17mo | $235,900 | $158 | 68 |
| 9390 W Ustick Rd #18 | 0.00mi | 3/2.0 | 1,512 (+12%) | 18mo | $239,000 | $158 | 65 |
| 9659 W Woodland Ln | 0.42mi | 3/2.0 | 1,296 (-4%) | 20mo | $182,900 | $141 | 57 |
| 9390 Ustick #28 | 0.00mi | 2/2.0 (-1) | 1,152 (-15%) | 16mo | $115,900 | $101 | 57 |
| 10014 Dewitt Ln | 0.57mi | 3/2.0 | 1,248 (-8%) | 5mo | $149,900 | $120 | 57 |
| 2274 N Patricia Ln | 0.74mi | 3/2.0 | 1,344 (-0%) | 21mo | $167,500 | $125 | 47 |
| 2345 Iris Ln | 0.71mi | 3/2.0 | 1,288 (-5%) | 20mo | $150,000 | $116 | 43 |
| 2357 N Iris Ln | 0.69mi | 3/2.0 | 1,440 (+7%) | 22mo | $115,000 | $80 | 38 |
Match score weights: distance 35% · size 25% · config 20% · recency 20%. Top-matched comps best support the ARV.
Projected returns pro-forma
-3.0% appreciation · 1.95% rent growth · sell at horizon
- IRR
- 8.3%
- Equity multiple
- 1.32×
- Total profit
- $11,108
- Equity at exit
- $18,325
- IRR
- 16.7%
- Equity multiple
- 2.30×
- Total profit
- $44,763
- Equity at exit
- $10,626
Cash invested: $34,412 (down + closing). Projections, not guarantees.
Landlord ↔ Tenant lean methodology
- Overall (STATE)
- 91 Strongly Landlord-Friendly
- State Idaho
- 91 Strongly Landlord-Friendly · R+18
- County
- — inherits STATE
- City
- — inherits STATE
ZIP-level market 83704
- Rents YoY
- 1.9%
- Active inventory
- 194
- Price-to-rent
- 5.9×
Monthly cashflow live
- Estimated rent
- $1,727 high interval (Pro) →
- Mortgage (P&I)
- −$645
- Tax est. 1.5%
- −$154 /mo · $1,844/yr
- Insurance
- −$51
- HOA
- −$0
- Vacancy / Maint / Mgmt
- −$363
- Net cashflow
- $515
Break-even live
Sensitivity live
| Price | -10% $600 | -5% $558 | +0% $515 | +5% $473 | +10% $430 |
|---|---|---|---|---|---|
| Rent | -10% $379 | -5% $447 | +0% $515 | +5% $583 | +10% $651 |
| Rate | -1.0pp $577 | -0.5pp $546 | base $515 | +0.5pp $483 | +1.0pp $451 |
UW: 25.0% down · 7.5% · 30yr · 1.5% tax · 5.0% vac · 8.0% maint · 8.0% mgmt
Financing live
Cash to close
- Down payment
- $30,725
- Closing costs
- $3,687
- Reserves months
- —
- Total cash needed
- —
Loan-product check · same deal, 3 products live
Conventional
25% down · 7.5% · 30yr
- Down + closing
- —
- Monthly P&I
- —
- Monthly cashflow
- —
- DSCR
- —
- Eligible?
- —
Personal DTI + credit; lowest rate.
DSCR
20% down · 8.5% · 30yr
- Down + closing
- —
- Monthly P&I
- —
- Monthly cashflow
- —
- DSCR
- —
- Eligible?
- —
No personal income docs; deal must DSCR.
Hard money
10% down · 12.0% · 12mo
- Down + closing
- —
- Monthly P&I
- —
- Monthly cashflow
- —
- DSCR
- —
- Eligible?
- —
Short-term bridge; refi at stabilization.
Rent comps 17 comps
| Address | Beds | Baths | Sqft | Rent | $/sqft | DOM | Units | Dist |
|---|---|---|---|---|---|---|---|---|
| 9131 W Ustick Rd Unit 104 Boise, ID | 2.0 | 2.0 | 1000 | $1,595 | $1.59 | 14d | 1 | 0.19mi |
| 9113 W Ustick Rd Unit 102 Boise, ID | 2.0 | 2.0 | 1000 | $1,525 | $1.52 | 25d | 1 | 0.23mi |
| 10222 W Ustick Rd Boise, ID | 2.0 | 2.0 | 1010 | $1,575 | $1.56 | 25d | 1 | 0.63mi |
| 9169 W Cory Ln #202 Boise, ID | 2.0 | 1.5 | 968 | $1,395 | $1.44 | 23d | 1 | 0.64mi |
| 4107 N Vera St Boise, ID | 4.0 | 2.0 | 1344 | $1,895 | $1.41 | 25d | 1 | 0.78mi |
| 10887 W Ustick Rd Boise, ID | 2.0–3.0 | 1.0–2.0 | 874 | $1,605 | $1.84 | 5d | 3 | 1.03mi |
| 3325 N Covered Wagon Way Boise, ID | 3.0 | 2.0 | 1200 | $2,050 | $1.71 | 25d | 1 | 1.09mi |
| 10764 W Goldenrod Ave Boise, ID | 3.0 | 2.0 | 1220 | $1,895 | $1.55 | 21d | 1 | 1.11mi |
| 7521 W Tottenham Ln Apt 202 Boise, ID | 3.0 | 2.0 | 1113 | $1,595 | $1.43 | 25d | 1 | 1.12mi |
| 10096 W Garverdale Ln Boise, ID | 3.0 | 2.0 | 1113 | $1,600 | $1.44 | 25d | 1 | 1.13mi |
| 10105 W Garverdale Ln Ste 201 Boise, ID | 2.0 | 2.0 | 915 | $1,350 | $1.48 | 16d | 1 | 1.18mi |
| 9846 W Rosecroft Ct #102 Boise, ID | 2.0 | 2.5 | 1236 | $1,545 | $1.25 | 5d | 1 | 1.25mi |
| 11274 W Race St Boise, ID | 3.0 | 2.5 | 1744 | $2,150 | $1.23 | 16d | 1 | 1.26mi |
| 4418 N Oxbow Pl Boise, ID | 3.0 | 2.0 | 1120 | $2,095 | $1.87 | 16d | 1 | 1.30mi |
| 9993 W Rosecroft Ct #101 Boise, ID | 2.0 | 2.5 | 1136 | $1,575 | $1.39 | 5d | 1 | 1.33mi |
| 9130 W Irving St Boise, ID | 2.0 | 1.5 | 952 | $1,575 | $1.65 | 5d | 5 | 1.39mi |
| 8973 W Irving St Bldg 6 Boise, ID | 3.0 | 2.5 | 1524 | $2,250 | $1.48 | 16d | 1 | 1.41mi |
Listing history 26 events
-
2026-06-21days on market $122,900 Active 76 DOM
-
2026-06-18days on market $122,900 Active 73 DOM
-
2026-06-17days on market $122,900 Active 72 DOM
-
2026-06-16days on market $122,900 Active 71 DOM
-
2026-06-15days on market $122,900 Active 70 DOM
-
2026-06-13days on market $122,900 Active 68 DOM
-
2026-06-10days on market $122,900 Active 65 DOM
-
2026-06-09days on market $122,900 Active 64 DOM
-
2026-06-08days on market $122,900 Active 63 DOM
-
2026-06-07days on market $122,900 Active 62 DOM
-
2026-06-03days on market $122,900 Active 58 DOM
-
2026-06-03days on market $122,900 Active 57 DOM
-
2026-06-01days on market $122,900 Active 56 DOM
-
2026-05-31days on market $122,900 Active 55 DOM
-
2026-05-15price $142,900
-
2026-04-30price $144,900
-
2026-04-18status Active
-
2026-04-14status Pending
-
2026-04-02$149,900 Active
-
2026-02-11historical
-
2025-12-30price $157,000
-
2025-07-17price $159,900
-
2025-06-24price $167,000
-
2025-04-16$173,000 Active
-
2017-02-25$79,500
-
2016-10-28$84,900
ⓘ Source: listings_history table (triggers on properties + properties_extension) + one-shot
backfill from property_details.listing_events for pre-trigger history.
Climate risk First Street
- Flood 1/10 Low FEMA zone X (unshaded) · 0% chance over 30 yrs
- Wildfire 1/10 Low
- Heat 4/10 Moderate 7 d/yr ≥96°F today · 18 d/yr by 30 yrs out
- Wind 1/10 Low
- Air quality 8/10 Severe 14 unhealthy d/yr today · 19 by 30 yrs out
Nearby sold comps map
Loading sold comps map…
Walkable amenities ~0.75 mi
Loading nearby amenities…
Taxation est. · year 1
- Rental income
- $20,725
- − Mortgage interest
- −$6,884
- − Property taxes
- −$1,844
- − Insurance
- −$614
- − Repairs & maintenance
- −$1,658
- − Management
- −$1,658
- − Depreciation
- −$3,575
- Taxable income
- $4,491
- Est. tax owed @ 24.0%
- −$1,078
- After-tax cash flow
- $5,103/yr
For passive investors: Depreciation is non-cash, so a rental often shows a tax loss while cash-flowing — sheltering income. Rental losses are passive: they offset passive income freely, and up to $25,000/yr can offset ordinary (W-2) income if you actively participate and your MAGI is under $100k (phasing out to $0 by $150k); unused losses carry forward. On sale, claimed depreciation is recaptured at up to 25%, and gains may owe capital-gains tax (a 1031 exchange can defer both). Figures are a year-1 estimate at your 24.0% rate — not tax advice; consult a CPA.
Schools (NCES district)
- District
- Joint School District No. 2
- NCES district ID
- 1602100
- Math proficiency
- 53% ▼ -6.00%
- Reading proficiency
- 67% ▼ -1.00%
- Median HH income
- $64,573
- Composite
- 52.42/100
- National rank
- #1576
- State rank
- #11 of 92 in ID
Livability — Boise City
No livability data for this city. (Only ~50 U.S. cities are tracked.)
Census & demographics
- Census place
- Boise City, ID
- County
- Ada County · 522,161 people
- City population
- 152,689
- Metro
- Boise City, ID
- Population (ZIP)
- 42,719
- Household income
- $73,390
- Rent vs Own
- Severe rent burden
- 1415.0
Population outlook (Ada County) Hauer SSP2
- Today (2025)
- 535,818 people
- By 2030
- 585,751 · +9.3%
- By 2040
- 682,435 · +27.4%
- By 2050
- 775,818 · +44.8%
- By 2075
- 994,458 · +85.6%
- By 2100
- 1,148,884 · +114.4%
Race, ethnicity, and origin ACS 2023
- Neighborhood character
- Predominantly White (77%)
- Race & ethnicity
- White 77% Hispanic / Latino 14% Two or more races 9% Asian 2% Native American 2% Black 1%
- Hispanic origin (detail)
- Mexican 10%
- Common ancestry
- Italian 4% Portuguese 3% Slovak 2%
- Foreign-born
- 8% · Canada
- Languages at home
- 87% English-only · Spanish 8% Russian/Polish/Slavic 1% Other Indo-European 1%
Political lean MEDSL · Ada
- 2024 margin
- R (+10.3) · D 43.4% · R 53.8% · Other 2.8%
- 2008→2024 swing
- -4.2pp toward R · 2008: -6.2pp · 2024: -10.3pp
- All cycles
- 2024: R+10.3 2020: R+3.9 2016: R+9.2 2012: R+11.3 2008: R+6.2
Not yet ingested
- Civics
- —
Market trends
- HPI YoY
- ▼ -393.15%
- Current HPI
- 379.0934
- Rent YoY
- ▲ 1.95%
- Metro
- Boise City, ID
- State GDP YoY
- ▲ 4.51%
- F500 in state
- 6
Industry mix (Fortune 500 HQ in ID)
| Industry | F500 HQs | Revenue |
|---|---|---|
| Retail | 1 | $79B |
|
||
| Technology | 1 | $25B |
|
||
| Food / Agriculture | 1 | $6B |
|
||
Price history
+68.3% since first listed12 events — show timeline
- 2026-05-15 Price Changed $142,900 IMLS
- 2026-04-30 Price Changed $144,900 IMLS
- 2026-04-18 Relisted — IMLS
- 2026-04-14 Pending — IMLS
- 2026-04-02 Listed $149,900 IMLS
- 2026-02-11 Listing Removed — IMLS
- 2025-12-30 Price Changed $157,000 IMLS
- 2025-07-17 Price Changed $159,900 IMLS
- 2025-06-24 Price Changed $167,000 IMLS
- 2025-04-16 Listed $173,000 IMLS
- 2017-02-25 Listed $79,500 IMLS
- 2016-10-28 Listed $84,900 IMLS
Cash-flow waterfall
monthlySold comps — $/sqft
last 12 mo · ≤1 miLoading sold comps…