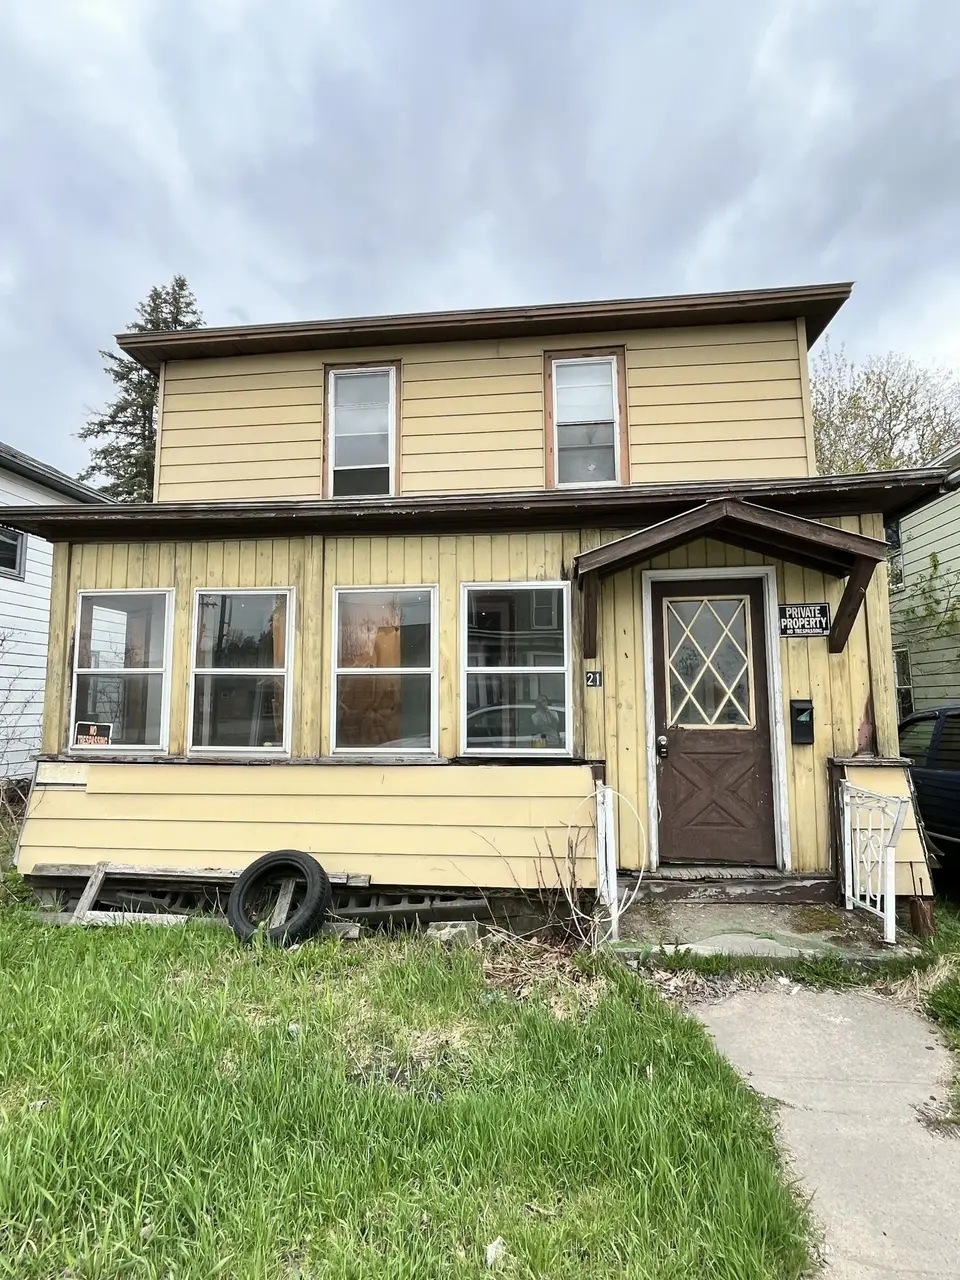
21 Main St · Tupper Lake, NY
Flood risk 5/10 · Moderate
- FEMA flood zone
- X
- Chance of flooding over 30 yrs
- 0.47%
- Est. flood insurance / yr
- $507 – $1,088
Fire risk 3/10 · Minor
- Est. fire insurance / yr
- $691 – $1,283
Heat risk 1/10 · Minimal
- Hot days now (above 88°F)
- 7 days/yr
- Hot days in 30 yrs
- 17 days/yr
Wind risk 1/10 · Minimal
- Chance of severe wind over 30 yrs
- —
Air-quality risk 1/10 · Minimal
- Unhealthy air days now
- 0 days/yr
- Unhealthy air days in 30 yrs
- 0 days/yr
Risk factors via First Street. Map © Google.
Why this score? — see what drove the B+ grade
The composite is a weighted blend of 9 inputs, each scored 0–100. Each bar is that input's sub-score; the figure is the points it added to the 100-point composite (weight × sub-score).
- Cash flow +30.0/30.0
- 1% rule +10.0/10.0
- DSCR +10.0/10.0
- ARV discount +7.5/15.0
- Appreciation +7.0/10.0
- Livability +3.3/5.0
- Schools +2.9/10.0
- Rent growth +2.5/5.0
- Condition / age +2.5/5.0
$29,000
🖨 Deal sheet (PDF) 📄 Offer letter ✓ Due diligence
Listing remarks
Opportunity awaits on Main Street in Tupper Lake! Located in the beautiful Adirondacks, this property offers potential for redevelopment, renovation, or investment. Convenient in-town location close to amenities and outdoor recreation. Property is in need of substantial repairs and is being sold as-is. Seller may consider seller financing for the right buyer. Offered at $29,000.
Key facts
- Outdoor recreation
- In-town location
- Sold as-is
Tags
Property features AI
Finance
- Financial info: Annual tax noted
Exterior
- Utilities: Public water; Public sewer
- Home design: Single-family house; Residential property; Fixer condition
- Construction: Vinyl siding; Wood siding; Built area above grade: 1,386
- Exterior features: Paved road access
Interior
- Kitchen: Microwave; Oven; Refrigerator
- Bathrooms: 2 full bathrooms; 1 main-level bathroom
- Interior features: Microwave; Oven; Refrigerator; 8 total rooms
Neighborhood map
What this means for you Summary
Snapshot
- This is a 3-bed/2.0-bath single-family listed at $29k.
Deal economics
- At list price, monthly cash flow is $753 ($9k/yr) — positive.
- The deal already cash-flows at list — no discount required.
- Meets the 1% rule at list price ($1k rent vs $29k).
- Recommended offer: $29k (1.5% below list) — sets the bar for market timing.
- Cap rate 37.4% vs local median 1.8% in Tupper Lake — top-decile yield for the area; either an underpriced asset or a hidden risk that comps aren't pricing in. Stress-test before assuming the spread holds.
Location & tenants
- Location reads 66/100 on livability (#661 in NY) — a middle-class / working-renter tenant base. Strengths: cost of living A+, housing B+, crime B; Watch: health & safety C-, employment D+, amenities F.
- Tupper Lake Central School District (rural): math 36% / reading 31% proficiency, ranked #561 of 590 in NY (top 95%) — families likely to look elsewhere, expect single-tenant / working-renter base with shorter leases.
- Zoned schools: L P Quinn Elementary School (math 32% / reading 32%, grade F, #1,646 of 2,108 statewide, top 80%, 353 students, 51% FRL); Tupper Lake Middle-High School (math 42% / reading 32%, grade F, #1,069 of 1,100 statewide, top 98%, 409 students, 52% FRL) — zoned schools average 52% FRL vs 34% district-wide (17 pts higher); higher-poverty schools than district average — tighter screening recommended.
- Market conditions: 64 active listings in the ZIP; 124 units permitted in Franklin County in 2024 (0 in 5+ unit buildings).
Forward outlook
- In year one you build about $1k of equity ($200 loan paydown + $1k appreciation (4.0% local appreciation)).
- Franklin County population projected at -14% by 2050 — secular population decline; favor cash flow + early exit over multi-decade hold.
- At projected returns (4.0% appreciation + 3.0% rent growth), your $8k cash investment doubles in ~1 year — after that, you're playing with house money.
Negotiation context
- It's been on market 23 days — a 2% lower offer ($29k) is reasonable based on typical stale-listing flexibility.
- Current owner paid $1; list at $29k implies a 2899900% gain — meaningful room to come down on a strong offer.
Risks & watch-outs
- Watch-outs: built in 1895 — expect roof / HVAC / electrical / plumbing capex.
- Climate carrying-cost: moderate flood risk — expect insurance premiums to compound above CPI over the hold.
Questions for the listing agent
- Built in 1895 — when were the roof, HVAC, electrical panel, plumbing, and water heater last replaced?
- Is there a deadline driving the sale (1031 exchange, divorce, estate, relocation)? That informs how much negotiation room exists.
- Schools are D-rated, which usually means shorter tenancies and higher turnover. Who's the typical renter profile here, and what's been the actual vacancy rate?
- What's the average days-on-market for RENTAL listings here right now (not sales)? A rising rental-DOM trend means longer vacancies and softer asking-rent achievability than the comps imply.
- What's the recent tenant-quality profile in this submarket — average credit score on applications, eviction rate, late-payment / NSF rate, and stable-employment percentage? A property-management company in the area should have these aggregated.
- How much new for-sale + rental construction is in the pipeline within 1–3 miles? Heavy new supply typically softens prices + rents 12–24 months out; constrained supply supports both.
Investment metrics
- 1% rule
- 4.16% ✓
- Cap rate
- 37.44%
- Cash-on-cash
- 111.23%
- DSCR
- 5.95
- GRM
- 2.0
CMA / ARV
- ARV (on-the-fly)
- $162,162
- Comps found
- 8
Show comp detail 8 sales within ~0.75 mi
| Address | Dist | Beds/Ba | Sqft | Sold | Price | $/sf | Match |
|---|---|---|---|---|---|---|---|
| 23 Lafayette St St | 0.32mi | 3/2.0 | 1,400 (+1%) | 12mo | $135,000 | $96 | 73 |
| 6 Underwood Rd | 0.37mi | 3/1.5 | 1,396 (+1%) | 15mo | $285,000 | $204 | 67 |
| 22 Prospect St St | 0.43mi | 3/2.0 | 1,404 (+1%) | 17mo | $115,000 | $82 | 63 |
| 2 Clement Ave Ave | 0.50mi | 3/1.5 | 1,260 (-9%) | 4mo | $51,000 | $40 | 56 |
| 46 Flanders St St | 0.53mi | 3/2.0 | 1,352 (-2%) | 20mo | $158,500 | $117 | 55 |
| 47 Washington St | 0.33mi | 3/1.5 | 1,228 (-11%) | 11mo | $170,000 | $138 | 54 |
| 2 Underwood Rd | 0.37mi | 3/2.0 | 1,560 (+13%) | 19mo | $260,000 | $167 | 46 |
| 167 Main St | 0.66mi | 2/1.5 (-1) | 1,179 (-15%) | 17mo | $125,000 | $106 | 23 |
Match score weights: distance 35% · size 25% · config 20% · recency 20%. Top-matched comps best support the ARV.
Projected returns pro-forma
3.95% appreciation · 3.0% rent growth · sell at horizon
- IRR
- —
- Equity multiple
- 7.52×
- Total profit
- $52,932
- Equity at exit
- $14,618
- IRR
- —
- Equity multiple
- 15.72×
- Total profit
- $119,521
- Equity at exit
- $23,842
Cash invested: $8,120 (down + closing). Projections, not guarantees.
Landlord ↔ Tenant lean methodology
- Overall (STATE)
- 15 Strongly Tenant-Friendly
- State New York
- 15 Strongly Tenant-Friendly · D+10
- County
- — inherits STATE
- City
- — inherits STATE
ZIP-level market 12986
- Home prices YoY
- 1.4%
- Active inventory
- 64
- Price-to-rent
- 2.0×
Monthly cashflow live
- Estimated rent
- $1,206 medium interval (Pro) →
- Mortgage (P&I)
- −$152
- Tax est. 1.5%
- −$36 /mo · $435/yr
- Insurance
- −$12
- HOA
- −$0
- Vacancy / Maint / Mgmt
- −$253
- Net cashflow
- $753
Break-even live
Sensitivity live
| Price | -10% $773 | -5% $763 | +0% $753 | +5% $743 | +10% $733 |
|---|---|---|---|---|---|
| Rent | -10% $657 | -5% $705 | +0% $753 | +5% $800 | +10% $848 |
| Rate | -1.0pp $767 | -0.5pp $760 | base $753 | +0.5pp $745 | +1.0pp $737 |
UW: 25.0% down · 7.5% · 30yr · 1.5% tax · 5.0% vac · 8.0% maint · 8.0% mgmt
Financing live
Cash to close
- Down payment
- $7,250
- Closing costs
- $870
- Reserves months
- —
- Total cash needed
- —
Loan-product check · same deal, 3 products live
Conventional
25% down · 7.5% · 30yr
- Down + closing
- —
- Monthly P&I
- —
- Monthly cashflow
- —
- DSCR
- —
- Eligible?
- —
Personal DTI + credit; lowest rate.
DSCR
20% down · 8.5% · 30yr
- Down + closing
- —
- Monthly P&I
- —
- Monthly cashflow
- —
- DSCR
- —
- Eligible?
- —
No personal income docs; deal must DSCR.
Hard money
10% down · 12.0% · 12mo
- Down + closing
- —
- Monthly P&I
- —
- Monthly cashflow
- —
- DSCR
- —
- Eligible?
- —
Short-term bridge; refi at stabilization.
Listing history 18 events
-
2026-06-21days on market $29,000 Active 23 DOM
-
2026-06-21days on market $29,000 Active 22 DOM
-
2026-06-18days on market $29,000 Active 20 DOM
-
2026-06-17days on market $29,000 Active 19 DOM
-
2026-06-16days on market $29,000 Active 18 DOM
-
2026-06-15days on market $29,000 Active 17 DOM
-
2026-06-13days on market $29,000 Active 15 DOM
-
2026-06-12days on market $29,000 Active 14 DOM
-
2026-06-09days on market $29,000 Active 11 DOM
-
2026-06-08days on market $29,000 Active 10 DOM
-
2026-06-07days on market $29,000 Active 9 DOM
-
2026-06-07days on market $29,000 Active 8 DOM
-
2026-06-04days on market $29,000 Active 5 DOM
-
2026-06-02days on market $29,000 Active 4 DOM
-
2026-06-01days on market $29,000 Active 3 DOM
-
2026-05-31days on market $29,000 Active 2 DOM
-
2026-05-27$29,000 Active
-
2025-09-25soldstatus $1
ⓘ Source: listings_history table (triggers on properties + properties_extension) + one-shot
backfill from property_details.listing_events for pre-trigger history.
Climate risk First Street
- Flood 5/10 Major FEMA zone X · 47% chance over 30 yrs
- Wildfire 3/10 Moderate
- Heat 1/10 Low 7 d/yr ≥88°F today · 17 d/yr by 30 yrs out
- Wind 1/10 Low
- Air quality 1/10 Low 0 unhealthy d/yr today · 0 by 30 yrs out
Nearby sold comps map
Loading sold comps map…
Walkable amenities ~0.75 mi
Loading nearby amenities…
Taxation est. · year 1
- Rental income
- $14,477
- − Mortgage interest
- −$1,624
- − Property taxes
- −$435
- − Insurance
- −$145
- − Repairs & maintenance
- −$1,158
- − Management
- −$1,158
- − Depreciation
- −$844
- Taxable income
- $9,113
- Est. tax owed @ 24.0%
- −$2,187
- After-tax cash flow
- $6,845/yr
For passive investors: Depreciation is non-cash, so a rental often shows a tax loss while cash-flowing — sheltering income. Rental losses are passive: they offset passive income freely, and up to $25,000/yr can offset ordinary (W-2) income if you actively participate and your MAGI is under $100k (phasing out to $0 by $150k); unused losses carry forward. On sale, claimed depreciation is recaptured at up to 25%, and gains may owe capital-gains tax (a 1031 exchange can defer both). Figures are a year-1 estimate at your 24.0% rate — not tax advice; consult a CPA.
Schools (NCES district)
- District
- Tupper Lake Central School District
- NCES district ID
- 3629160
- Math proficiency
- 36% ▲ 1.00%
- Reading proficiency
- 31% ▼ -1.00%
- Median HH income
- $50,543
- Composite
- 29.18/100
- National rank
- #6572
- State rank
- #561 of 590 in NY
Livability — Tupper Lake
- Score
- 66/100
- State rank
- #661
- US rank
- #12343
Category grades
Schools grade is shown separately in the Schools card above.
Census & demographics
- Census place
- Tupper Lake, NY
- City population
- 5,304
- Population (ZIP)
- 5,304
Population outlook (Franklin County) Hauer SSP2
- Today (2025)
- 48,098 people
- By 2030
- 46,790 · -2.7%
- By 2040
- 44,400 · -7.7%
- By 2050
- 41,256 · -14.2%
- By 2075
- 32,190 · -33.1%
- By 2100
- 23,407 · -51.3%
Race, ethnicity, and origin ACS 2023
- Neighborhood character
- Predominantly White (95%)
- Race & ethnicity
- White 95% Two or more races 2% Black 2% Hispanic / Latino 1%
- Common ancestry
- Lithuanian 20% Iranian 2% Slovak 2%
- Foreign-born
- 2% · Canada
- Languages at home
- 98% English-only · French/Haitian/Cajun 1%
Political lean MEDSL · Franklin
- 2024 margin
- Lean R (+9.0) · D 45.5% · R 54.5%
- 2008→2024 swing
- -31.2pp toward R · 2008: 22.2pp · 2024: -9.0pp
- All cycles
- 2024: R+9.0 2020: R+2.2 2016: R+7.4 2012: D+26.3 2008: D+22.2
Not yet ingested
- Civics
- —
Market trends
- HPI YoY
- ▲ 3.95%
- Current HPI
- 281.1979
- Rent YoY
- —
- Metro
- —
- State GDP YoY
- ▲ 2.60%
- F500 in state
- 92
Industry mix (Fortune 500 HQ in NY)
| Industry | F500 HQs | Revenue |
|---|---|---|
| Financial Services | 10 | $950B |
|
||
| Consumer Goods | 9 | $162B |
|
||
| Insurance | 4 | $225B |
|
||
| Telecommunications | 2 | $144B |
|
||
| Pharmaceuticals | 2 | $112B |
|
||
| Media / Entertainment | 2 | $69B |
|
||
Price history
2 events — show timeline
- 2026-05-27 Listed $29,000 ACVMLS
- 2025-09-25 Sold (Public Records) $1 Public Records
Property tax history
+2.3%/yrLatest (2025): $1,789 · +4.0% YoY. Source: county tax records.
Cash-flow waterfall
monthlySold comps — $/sqft
last 12 mo · ≤1 miLoading sold comps…