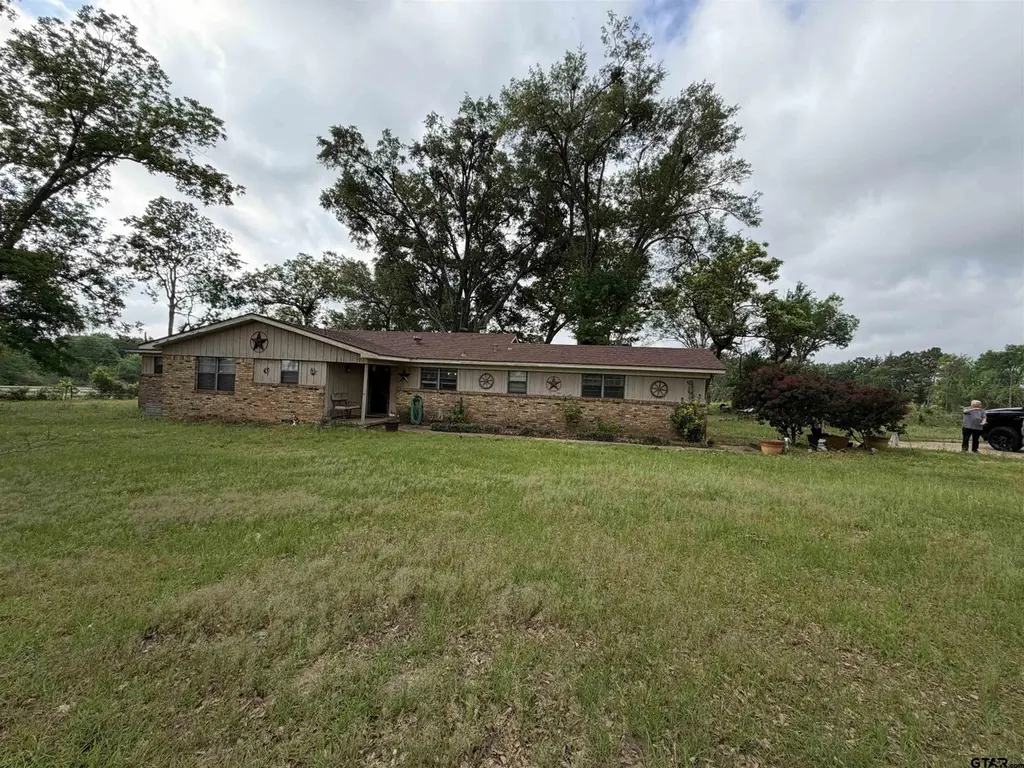
8584 Cr 334 · Tyler, TX
Flood risk 1/10 · Minimal
- FEMA flood zone
- X (unshaded)
- Chance of flooding over 30 yrs
- 0.0%
- Est. flood insurance / yr
- $507 – $1,088
Fire risk 5/10 · Moderate
- Est. fire insurance / yr
- $1,222 – $2,270
Heat risk 6/10 · Moderate
- Hot days now (above 109°F)
- 7 days/yr
- Hot days in 30 yrs
- 25 days/yr
Wind risk 6/10 · Moderate
- Chance of severe wind over 30 yrs
- 63.0%
Air-quality risk 2/10 · Minimal
- Unhealthy air days now
- 0 days/yr
- Unhealthy air days in 30 yrs
- 1 days/yr
Risk factors via First Street. Map © Google.
Why this score? — see what drove the D grade
The composite is a weighted blend of 9 inputs, each scored 0–100. Each bar is that input's sub-score; the figure is the points it added to the 100-point composite (weight × sub-score).
- ARV discount +15.0/15.0
- Appreciation +7.5/10.0
- Cash flow +6.6/30.0
- Livability +3.8/5.0
- Schools +3.3/10.0
- Rent growth +2.5/5.0
- Condition / age +2.5/5.0
- 1% rule +1.7/10.0
- DSCR +0.9/10.0
$235,000
🖨 Deal sheet (PDF) 📄 Offer letter ✓ Due diligence
Listing remarks
Charming 3-bedroom, 2-bath home nestled on 2.76 beautiful acres in Tyler. Enjoy the perfect blend of peaceful country living with the convenience of being just minutes from town. This property offers plenty of space for outdoor living, gardening, animals, or future additions. Inside, you'll find a comfortable layout with spacious living areas, a functional kitchen, and cozy bedrooms. Whether you're looking for a private retreat, starter home, or investment opportunity, this property offers endless potential in a great location.
Key facts
- Functional kitchen
- Great location
- 2.76 acres
Tags
Property features AI
Exterior
- Home design: Single-family detached residence; 1 story
- Construction: Brick and wood siding construction; Composition roof
- Exterior features: Deck; Outbuilding; Workshop
Interior
- Kitchen: Microwave
- Bathrooms: 2 full bathrooms
- Heating & cooling: Central heating (Natural Gas); Central air conditioning
- Interior features: Wood-burning fireplace; Microwave
Neighborhood map
What this means for you Summary
Snapshot
- This is a 3-bed/2.0-bath single-family listed at $235k.
Deal economics
- At list price, monthly cash flow is $-384 ($-5k/yr) — negative.
- To cash-flow at today's rent, offer at most $167k (28.9% below list).
- To meet the 1% rule (rent ≥ 1% of price), the offer needs to be $159k (32.5% below list).
- Recommended offer: $159k (32.5% below list) — sets the bar for 1% rule.
- Cap rate 4.3% vs local median 3.5% in Tyler — meaningfully above typical; check what's discounted (condition, days-on-market, listing class) to confirm the premium yield is real.
Location & tenants
- Location reads 75/100 on livability (#147 in TX, #4,181 nationally) — a middle-class / working-renter tenant base. Strengths: cost of living A+, housing A+, health & safety A+; Watch: employment C-, crime D+, commute F.
- Tyler ISD (urban): math 39% / reading 38% proficiency, ranked #449 of 826 in TX (top 54%) — families likely to look elsewhere, expect single-tenant / working-renter base with shorter leases; 66% free/reduced lunch — lower-income household profile, screen leases tightly.
- Zoned schools: Douglas El (math 45% / reading 27%, grade F, #1,921 of 4,322 statewide, top 45%, 585 students, 97% FRL); Moore Mst Magnet School (math 46% / reading 39%, grade D-, #553 of 1,662 statewide, top 34%, 1,113 students, 87% FRL); Tyler H S (math 26% / reading 27%, grade F, #1,228 of 1,632 statewide, top 76%, 2,164 students, 90% FRL) — zoned schools average 91% FRL vs 66% district-wide (25 pts higher); higher-poverty schools than district average — tighter screening recommended.
- Market conditions: 67 active listings in the ZIP; 595 units permitted in Smith County in 2024 (45 in 5+ unit buildings).
Forward outlook
- In year one you build about $13k of equity ($2k loan paydown + $12k appreciation (5.0% local appreciation)).
- Smith County population projected at +24% by 2050 — long-run rental-demand tailwind backs the buy-and-hold thesis.
- By year 3, paydown + projected appreciation supports a ~$33k cash-out refi (75% LTV) — recoverable capital for the next deal without selling this one.
Negotiation context
- It's been on market 41 days — a 3% lower offer ($228k) is reasonable based on typical stale-listing flexibility.
Risks & watch-outs
- Climate carrying-cost: major wind risk, 63% chance of damaging wind over 30y; moderate wildfire risk; extreme-heat days projected 7→25/yr by 2055 (HVAC capex compounding) — expect insurance premiums to compound above CPI over the hold.
Questions for the listing agent
- What do current leases actually rent for vs. the listed asking? Can we see a recent rent roll and the last 12 months of T-12 income?
- It's been on market 41 days. Have you received any prior offers? Is the seller open to a 33% concession, seller financing, or rate buy-down credit?
- Built in 1964 — when were the roof, HVAC, electrical panel, plumbing, and water heater last replaced?
- Is there a deadline driving the sale (1031 exchange, divorce, estate, relocation)? That informs how much negotiation room exists.
- Schools are D-rated, which usually means shorter tenancies and higher turnover. Who's the typical renter profile here, and what's been the actual vacancy rate?
- Crime grade is D in this area — have there been break-ins, vandalism, or insurance claims at this property in the last 3 years? What carrier currently insures it and at what premium?
- The area grade is low — what's the realistic commute time and amenity access for the typical tenant pool here? Any planned neighborhood developments (good or bad) we should know about?
- What's the average days-on-market for RENTAL listings here right now (not sales)? A rising rental-DOM trend means longer vacancies and softer asking-rent achievability than the comps imply.
- What's the recent tenant-quality profile in this submarket — average credit score on applications, eviction rate, late-payment / NSF rate, and stable-employment percentage? A property-management company in the area should have these aggregated.
- How much new for-sale + rental construction is in the pipeline within 1–3 miles? Heavy new supply typically softens prices + rents 12–24 months out; constrained supply supports both.
Investment metrics
- 1% rule
- 0.67% ✗
- Cap rate
- 4.33%
- Cash-on-cash
- -7.01%
- DSCR
- 0.69
- GRM
- 12.3
CMA / ARV
- ARV (median comp)
- $434,987
- List price
- $235,000
- Delta
- -45.98%
- Verdict
- UNDERPRICED
- Comps
- 2 within 1.0 mi
Projected returns pro-forma
4.96% appreciation · 3.0% rent growth · sell at horizon
- IRR
- 6.9%
- Equity multiple
- 1.44×
- Total profit
- $29,239
- Equity at exit
- $132,663
- IRR
- 9.0%
- Equity multiple
- 2.67×
- Total profit
- $109,889
- Equity at exit
- $228,540
Cash invested: $65,800 (down + closing). Projections, not guarantees.
Landlord ↔ Tenant lean methodology
- Overall (STATE)
- 87 Strongly Landlord-Friendly
- State Texas
- 87 Strongly Landlord-Friendly · R+5
- County
- — inherits STATE
- City
- — inherits STATE
ZIP-level market 75708
- Home prices YoY
- 2.4%
- Active inventory
- 67
- Price-to-rent
- 12.3×
Monthly cashflow live
- Estimated rent
- $1,586 medium interval (Pro) →
- Mortgage (P&I)
- −$1,232
- Tax from tax record
- −$307 /mo · $3,683/yr
- Insurance
- −$98
- HOA
- −$0
- Vacancy / Maint / Mgmt
- −$333
- Net cashflow
- $-384
Break-even live
Sensitivity live
| Price | -10% $-251 | -5% $-318 | +0% $-384 | +5% $-451 | +10% $-517 |
|---|---|---|---|---|---|
| Rent | -10% $-510 | -5% $-447 | +0% $-384 | +5% $-322 | +10% $-259 |
| Rate | -1.0pp $-266 | -0.5pp $-325 | base $-384 | +0.5pp $-445 | +1.0pp $-507 |
UW: 25.0% down · 7.5% · 30yr · 1.5% tax · 5.0% vac · 8.0% maint · 8.0% mgmt
Financing live
Cash to close
- Down payment
- $58,750
- Closing costs
- $7,050
- Reserves months
- —
- Total cash needed
- —
Loan-product check · same deal, 3 products live
Conventional
25% down · 7.5% · 30yr
- Down + closing
- —
- Monthly P&I
- —
- Monthly cashflow
- —
- DSCR
- —
- Eligible?
- —
Personal DTI + credit; lowest rate.
DSCR
20% down · 8.5% · 30yr
- Down + closing
- —
- Monthly P&I
- —
- Monthly cashflow
- —
- DSCR
- —
- Eligible?
- —
No personal income docs; deal must DSCR.
Hard money
10% down · 12.0% · 12mo
- Down + closing
- —
- Monthly P&I
- —
- Monthly cashflow
- —
- DSCR
- —
- Eligible?
- —
Short-term bridge; refi at stabilization.
Listing history 9 events
-
2026-06-01status $235,000 Pending 41 DOM
-
2026-05-31days on market $235,000 Active 41 DOM
-
2026-05-30days on market $235,000 Active 40 DOM
-
2026-05-15price $245,000 533-char remark
-
2026-05-06price $255,000 533-char remark
-
2026-04-28price $260,000 533-char remark
-
2026-04-21$270,000 Active 533-char remark
-
2025-10-30price $325,000
-
2005-09-20soldstatus
ⓘ Source: listings_history table (triggers on properties + properties_extension) + one-shot
backfill from property_details.listing_events for pre-trigger history.
Tax reassessment forecast TX · Resets to sale price
- Current annual tax
- $3,683 · $307/mo
- Projected year-2 tax
- $4,300 · $358/mo
- Expected delta
- +$617/yr (+$51/mo · 16.8%)
ⓘ Screening estimate from a state-policy table — verify with the county assessor before closing.
Climate risk First Street
- Flood 1/10 Low FEMA zone X (unshaded) · 0% chance over 30 yrs
- Wildfire 5/10 Major
- Heat 6/10 Major 7 d/yr ≥109°F today · 25 d/yr by 30 yrs out
- Wind 6/10 Major 63% chance of damaging wind over 30 yrs
- Air quality 2/10 Low 0 unhealthy d/yr today · 1 by 30 yrs out
Nearby sold comps map
Loading sold comps map…
Walkable amenities ~0.75 mi
Loading nearby amenities…
Taxation est. · year 1
- Rental income
- $19,031
- − Mortgage interest
- −$13,164
- − Property taxes
- −$3,683
- − Insurance
- −$1,175
- − Repairs & maintenance
- −$1,522
- − Management
- −$1,522
- − Depreciation
- −$6,836
- Taxable loss
- −$8,872
- Est. tax savings @ 24.0%
- +$2,129
- After-tax cash flow
- $-2,483/yr
For passive investors: Depreciation is non-cash, so a rental often shows a tax loss while cash-flowing — sheltering income. Rental losses are passive: they offset passive income freely, and up to $25,000/yr can offset ordinary (W-2) income if you actively participate and your MAGI is under $100k (phasing out to $0 by $150k); unused losses carry forward. On sale, claimed depreciation is recaptured at up to 25%, and gains may owe capital-gains tax (a 1031 exchange can defer both). Figures are a year-1 estimate at your 24.0% rate — not tax advice; consult a CPA.
Schools (NCES district)
- District
- Tyler ISD
- NCES district ID
- 4843470
- Math proficiency
- 39% ▼ -4.00%
- Reading proficiency
- 38% ▼ -1.00%
- Median HH income
- $44,090
- Composite
- 32.69/100
- National rank
- #5650
- State rank
- #449 of 826 in TX
Livability — Tyler
- Score
- 75/100
- State rank
- #147
- US rank
- #4181
Category grades
Schools grade is shown separately in the Schools card above.
Census & demographics
- City population
- 127,842
- Population (ZIP)
- 10,001
Population outlook (Smith County) Hauer SSP2
- Today (2025)
- 248,890 people
- By 2030
- 261,665 · +5.1%
- By 2040
- 286,114 · +15.0%
- By 2050
- 308,006 · +23.8%
- By 2075
- 354,171 · +42.3%
- By 2100
- 372,828 · +49.8%
Race, ethnicity, and origin ACS 2023
- Neighborhood character
- Diverse neighborhood (Simpson 0.58)
- Race & ethnicity
- Hispanic / Latino 51% White 39% Two or more races 9% Black 9% Asian 1%
- Hispanic origin (detail)
- Mexican 49%
- Common ancestry
- Danish 1%
- Foreign-born
- 15% · Canada, Vietnam
- Languages at home
- 62% English-only · Spanish 37% Vietnamese 1%
Political lean MEDSL · Smith
- 2024 margin
- Solid R (+45.1) · D 27.0% · R 72.1%
- 2008→2024 swing
- -5.6pp toward R · 2008: -39.5pp · 2024: -45.1pp
- All cycles
- 2024: R+45.1 2020: R+39.4 2016: R+43.9 2012: R+46.9 2008: R+39.5
Not yet ingested
- Civics
- —
Market trends
- HPI YoY
- ▲ 4.96%
- Current HPI
- 216.4494
- Rent YoY
- —
- Metro
- —
- State GDP YoY
- ▲ 3.95%
- F500 in state
- 110
Industry mix (Fortune 500 HQ in TX)
| Industry | F500 HQs | Revenue |
|---|---|---|
| Energy | 16 | $1,198B |
|
||
| Technology | 5 | $198B |
|
||
| Engineering / Construction | 4 | $72B |
|
||
| Energy Services | 3 | $60B |
|
||
| Utilities | 3 | $41B |
|
||
| Healthcare | 2 | $330B |
|
||
Price history
-27.7% since first listed9 events — show timeline
- 2026-06-14 Pending — GTAR
- 2026-05-31 Pending — GTAR
- 2026-05-20 Price Changed $235,000 GTAR
- 2026-05-15 Price Changed $245,000 GTAR
- 2026-05-06 Price Changed $255,000 GTAR
- 2026-04-28 Price Changed $260,000 GTAR
- 2026-04-21 Listed $270,000 GTAR
- 2025-10-30 Price Changed $325,000 GTAR
- 2005-09-20 Sold (Public Records) — Public Records
Property tax history
+4.1%/yrLatest (2024): $3,683 · +7.8% YoY. Source: county tax records.
Cash-flow waterfall
monthlySold comps — $/sqft
last 12 mo · ≤1 miLoading sold comps…