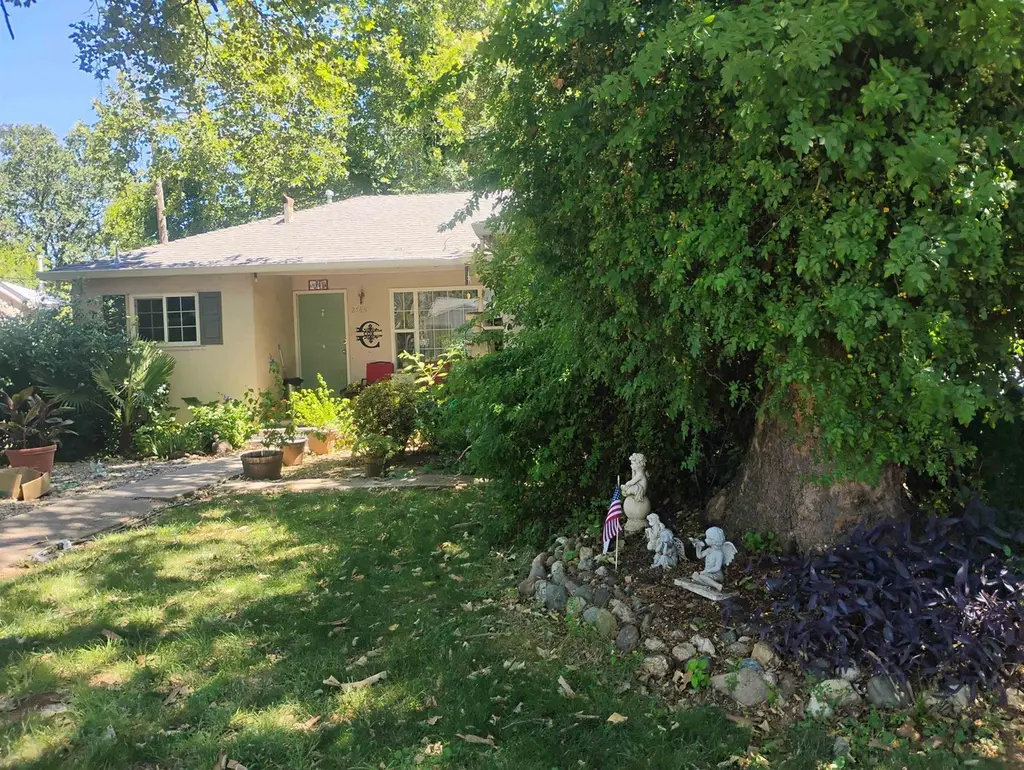
2745 Oak St · Anderson, CA
Flood risk 6/10 · Moderate
- FEMA flood zone
- X (unshaded)
- Chance of flooding over 30 yrs
- 0.27%
- Est. flood insurance / yr
- $507 – $1,088
Fire risk 8/10 · Major
- Est. fire insurance / yr
- $659 – $1,223
Heat risk 8/10 · Major
- Hot days now (above 104°F)
- 7 days/yr
- Hot days in 30 yrs
- 15 days/yr
Wind risk 1/10 · Minimal
- Chance of severe wind over 30 yrs
- —
Air-quality risk 10/10 · Severe
- Unhealthy air days now
- 35 days/yr
- Unhealthy air days in 30 yrs
- 42 days/yr
Risk factors via First Street. Map © Google.
Why this score? — see what drove the C- grade
The composite is a weighted blend of 9 inputs, each scored 0–100. Each bar is that input's sub-score; the figure is the points it added to the 100-point composite (weight × sub-score).
- Cash flow +21.8/30.0
- ARV discount +7.5/15.0
- DSCR +7.0/10.0
- 1% rule +5.3/10.0
- Livability +3.4/5.0
- Rent growth +2.5/5.0
- Condition / age +2.5/5.0
- Schools +2.4/10.0
- Appreciation +0.0/10.0
$145,000
🖨 Deal sheet 📄 Offer letter ✓ Due diligence
Listing remarks
Attention all flippers: This house needs a roof and some joist work. Alot of potential here with hard wood floors and a functional floor plan. Nearly new shed in back yard. Spacious backyard. Large kitchen and washroom. Nothing but up from here, come take a look and plan for success.
Key facts
- Hard wood floors
- Spacious backyard
- Nearly new shed
Tags
Property features AI
Exterior
- Parking: Asphalt parking
- Utilities: Public water; Public sewer; Electricity available; Natural gas available
- Home design: Single family residence; Residential property
- Construction: Stucco construction; Composition roof
- Exterior features: Deck; Back yard fencing; Shed(s); Landscaped and wooded yard; City lot; Paved road access
Interior
- Kitchen: Dishwasher; Electric oven; Electric range
- Flooring: Carpet; Vinyl; Wood
- Bathrooms: 1 full bathroom
- Heating & cooling: Wall furnace heating; Evaporative cooling
- Interior features: Laminate counters; Double pane windows
- Laundry & utility: Laundry room with electric dryer hookup
Neighborhood map
What this means for you Summary
Snapshot
- This is a 2-bed/1.0-bath single-family listed at $145k.
Deal economics
- At list price, monthly cash flow is $224 ($3k/yr) — positive.
- The deal already cash-flows at list — no discount required.
- Meets the 1% rule at list price ($1k rent vs $145k).
- Cap rate 8.2% vs local median 3.5% in Anderson — top-decile yield for the area; either an underpriced asset or a hidden risk that comps aren't pricing in. Stress-test before assuming the spread holds.
Location & tenants
- Location reads 68/100 on livability (#277 in CA) — a middle-class / working-renter tenant base. Strengths: commute A+, health & safety A+, housing A-; Watch: employment D, crime F, amenities F.
- Cascade Union Elementary (suburban): math 25% / reading 32% proficiency, ranked #377 of 517 in CA (top 73%) — low school quality limits family demand, transient renter base, plan for 1-2y turnover; 70% free/reduced lunch — lower-income household profile, screen leases tightly.
- Zoned schools: Meadow Lane Elementary (math 37% / reading 42%, grade F, #621 of 1,571 statewide, top 42%, 448 students, 73% FRL) — zoned schools at 73% FRL track the district average.
- Market conditions: 224 active listings in the ZIP; 8 comparable units currently listed for rent nearby; rentals leasing fast (median 14d on market — plan ~1-2 weeks tenant-placement turnaround); 246 units permitted in Shasta County in 2024 (0 in 5+ unit buildings).
Forward outlook
- Local home prices are declining (-3.0%/yr); year-one equity from $1k of loan paydown is wiped out by about $4k of value loss. Plan a longer hold.
- Shasta County population projected to shrink 9% by 2050 — rents likely to lag national; underwrite the cash flow, not the appreciation.
Negotiation context
- Only 10 days on market — expect competitive offers; lowballing is unlikely to land.
Risks & watch-outs
- Watch-outs: built in 1949 — expect roof / HVAC / electrical / plumbing capex.
- Climate carrying-cost: major flood risk; severe wildfire risk; extreme-heat days projected 7→15/yr by 2055 (HVAC capex compounding) — expect insurance premiums to compound above CPI over the hold.
Questions for the listing agent
- Built in 1949 — when were the roof, HVAC, electrical panel, plumbing, and water heater last replaced?
- Is there a deadline driving the sale (1031 exchange, divorce, estate, relocation)? That informs how much negotiation room exists.
- Crime grade is F in this area — have there been break-ins, vandalism, or insurance claims at this property in the last 3 years? What carrier currently insures it and at what premium?
- What's the average days-on-market for RENTAL listings here right now (not sales)? A rising rental-DOM trend means longer vacancies and softer asking-rent achievability than the comps imply.
- What's the recent tenant-quality profile in this submarket — average credit score on applications, eviction rate, late-payment / NSF rate, and stable-employment percentage? A property-management company in the area should have these aggregated.
- How much new for-sale + rental construction is in the pipeline within 1–3 miles? Heavy new supply typically softens prices + rents 12–24 months out; constrained supply supports both.
Investment metrics
- 1% rule
- 1.03% ✓
- Cap rate
- 8.15%
- Cash-on-cash
- 6.63%
- DSCR
- 1.30
- GRM
- 8.1
CMA / ARV
- ARV (on-the-fly)
- $292,656
- Comps found
- 12
Show comp detail 12 sales within ~0.75 mi
| Address | Dist | Beds/Ba | Sqft | Sold | Price | $/sf | Match |
|---|---|---|---|---|---|---|---|
| 2895 Church St | 0.52mi | 3/1.0 (+1) | 1,088 (-0%) | 4mo | $176,000 | $162 | 67 |
| 2820 Nicole Ct | 0.51mi | 3/1.5 (+1) | 1,100 (+1%) | 4mo | $314,900 | $286 | 65 |
| 2811 Lupine St | 0.56mi | 3/1.5 (+1) | 1,092 (0%) | 10mo | $290,000 | $266 | 58 |
| 2855 Red Bud Ln | 0.58mi | 3/1.5 (+1) | 1,100 (+1%) | 10mo | $309,900 | $282 | 56 |
| 2779 N Bailey Dr | 0.72mi | 3/1.0 (+1) | 1,058 (-3%) | 0mo | $225,000 | $213 | 56 |
| 2445 Toyon St | 0.66mi | 3/1.5 (+1) | 1,092 (0%) | 10mo | $320,000 | $293 | 54 |
| 3081 Sharon Ave | 0.70mi | 3/1.0 (+1) | 1,058 (-3%) | 4mo | $315,000 | $298 | 53 |
| 3244 Sharon Ave | 0.69mi | 3/1.0 (+1) | 1,058 (-3%) | 7mo | $260,000 | $246 | 52 |
| 2827 Stingy Ln | 0.67mi | 3/2.0 (+1) | 1,008 (-8%) | 4mo | $279,000 | $277 | 44 |
| 3258 Sharon Ave | 0.69mi | 3/1.0 (+1) | 1,200 (+10%) | 10mo | $322,000 | $268 | 38 |
| 2609 Albert Rd | 0.57mi | 3/2.0 (+1) | 1,200 (+10%) | 13mo | $193,000 | $161 | 37 |
| 3235 Sharon Ave | 0.72mi | 3/1.0 (+1) | 1,195 (+9%) | 12mo | $271,750 | $227 | 36 |
Match score weights: distance 35% · size 25% · config 20% · recency 20%. Top-matched comps best support the ARV.
Projected returns pro-forma
-3.0% appreciation · 3.0% rent growth · sell at horizon
- IRR
- -6.1%
- Equity multiple
- 0.77×
- Total profit
- $-9,211
- Equity at exit
- $21,620
- IRR
- 3.5%
- Equity multiple
- 1.25×
- Total profit
- $10,351
- Equity at exit
- $12,537
Cash invested: $40,600 (down + closing). Projections, not guarantees.
Landlord ↔ Tenant lean methodology
- Overall (STATE)
- 18 Strongly Tenant-Friendly
- State California
- 18 Strongly Tenant-Friendly · D+13
- County
- — inherits STATE
- City
- — inherits STATE
ZIP-level market 96007
- Active inventory
- 224
- Price-to-rent
- 8.1×
Monthly cashflow live
- Estimated rent
- $1,489 high interval (Pro) →
- Mortgage (P&I)
- −$760
- Tax from tax record
- −$131 /mo · $1,575/yr
- Insurance
- −$60
- HOA
- −$0
- Vacancy / Maint / Mgmt
- −$313
- Net cashflow
- $224
Break-even live
UW: 25.0% down · 7.5% · 30yr · 1.5% tax · 5.0% vac · 8.0% maint · 8.0% mgmt
Financing live
Cash to close
- Down payment
- $36,250
- Closing costs
- $4,350
- Reserves months
- —
- Total cash needed
- —
Loan-product check · same deal, 3 products live
Conventional
25% down · 7.5% · 30yr
- Down + closing
- —
- Monthly P&I
- —
- Monthly cashflow
- —
- DSCR
- —
- Eligible?
- —
Personal DTI + credit; lowest rate.
DSCR
20% down · 8.5% · 30yr
- Down + closing
- —
- Monthly P&I
- —
- Monthly cashflow
- —
- DSCR
- —
- Eligible?
- —
No personal income docs; deal must DSCR.
Hard money
10% down · 12.0% · 12mo
- Down + closing
- —
- Monthly P&I
- —
- Monthly cashflow
- —
- DSCR
- —
- Eligible?
- —
Short-term bridge; refi at stabilization.
Rent comps 8 comps
| Address | Beds | Baths | Sqft | Rent | $/sqft | DOM | Units | Dist |
|---|---|---|---|---|---|---|---|---|
| 2766 Oak St Unit 02 Anderson, CA | 2.0 | 1.5 | 1008 | $1,395 | $1.38 | 13d | 1 | 0.05mi |
| 2333 Ferry St Anderson, CA | 2.0 | 2.0 | 1100 | $1,500 | $1.36 | 13d | 1 | 0.21mi |
| 2810 East St Apt A Anderson, CA | 2.0 | 1.0 | 737 | $1,450 | $1.97 | 21d | 1 | 0.21mi |
| 2820 East St Unit A Anderson, CA | 2.0 | 1.0 | 703 | $1,200 | $1.71 | 13d | 1 | 0.21mi |
| 2343 Ferry St Anderson, CA | 2.0 | 2.0 | 1080 | $1,500 | $1.39 | 13d | 1 | 0.21mi |
| 1710 Bruce Dr Anderson, CA | 2.0 | 1.0 | 813 | $1,275 | $1.57 | 13d | 1 | 0.55mi |
| 3222 Camellia St Anderson, CA | 2.0 | 1.0 | 740 | $1,400 | $1.89 | 13d | 1 | 1.07mi |
| 1970 Spruce Cir Anderson, CA | 2.0 | 1.0 | 785 | $1,550 | $1.97 | 13d | 1 | 1.12mi |
Listing history 10 events
-
2026-06-17status $145,000 Pending 10 DOM
-
2026-06-16days on market $145,000 Active 10 DOM
-
2026-06-15days on market $145,000 Active 9 DOM
-
2026-06-14days on market $145,000 Active 7 DOM
-
2026-06-13days on market $145,000 Active 6 DOM
-
2026-06-10days on market $145,000 Active 4 DOM
-
2026-06-09days on market $145,000 Active 3 DOM
-
2026-06-08days on market $145,000 Active 2 DOM
-
2026-06-07remarks 284-char remark
-
2026-06-07$145,000 Active 1 DOM
ⓘ Source: listings_history table (triggers on properties + properties_extension) + one-shot
backfill from property_details.listing_events for pre-trigger history.
Tax reassessment forecast CA · Resets to sale price
- Current annual tax
- $1,575 · $131/mo
- Projected year-2 tax
- $1,575 · $131/mo
- Expected delta
- $0/yr ($0/mo · 0.0%)
ⓘ Screening estimate from a state-policy table — verify with the county assessor before closing.
Climate risk First Street
- Flood 6/10 Major FEMA zone X (unshaded) · 27% chance over 30 yrs
- Wildfire 8/10 Severe
- Heat 8/10 Severe 7 d/yr ≥104°F today · 15 d/yr by 30 yrs out
- Wind 1/10 Low
- Air quality 10/10 Extreme 35 unhealthy d/yr today · 42 by 30 yrs out
Nearby sold comps map
Loading sold comps map…
Walkable amenities ~0.75 mi
Loading nearby amenities…
Taxation est. · year 1
- Rental income
- $17,871
- − Mortgage interest
- −$8,122
- − Property taxes
- −$1,575
- − Insurance
- −$725
- − Repairs & maintenance
- −$1,430
- − Management
- −$1,430
- − Depreciation
- −$4,218
- Taxable income
- $371
- Est. tax owed @ 24.0%
- −$89
- After-tax cash flow
- $2,604/yr
For passive investors: Depreciation is non-cash, so a rental often shows a tax loss while cash-flowing — sheltering income. Rental losses are passive: they offset passive income freely, and up to $25,000/yr can offset ordinary (W-2) income if you actively participate and your MAGI is under $100k (phasing out to $0 by $150k); unused losses carry forward. On sale, claimed depreciation is recaptured at up to 25%, and gains may owe capital-gains tax (a 1031 exchange can defer both). Figures are a year-1 estimate at your 24.0% rate — not tax advice; consult a CPA.
Schools (NCES district)
- District
- Cascade Union Elementary
- NCES district ID
- 0607680
- Math proficiency
- 25% ▲ 1.00%
- Reading proficiency
- 32% ▲ 1.00%
- Median HH income
- $35,602
- Composite
- 23.56/100
- National rank
- #7856
- State rank
- #377 of 517 in CA
Livability — Anderson
- Score
- 68/100
- State rank
- #277
- US rank
- #9315
Category grades
Schools grade is shown separately in the Schools card above.
Census & demographics
- Census place
- Anderson, CA
- County
- Shasta County · 147,641 people
- City population
- 24,768
- Metro
- Redding, CA
- Population (ZIP)
- 24,768
- Household income
- $61,357
- Rent vs Own
- Severe rent burden
- 758.0
Population outlook (Shasta County) Hauer SSP2
- Today (2025)
- 179,231 people
- By 2030
- 176,953 · -1.3%
- By 2040
- 169,982 · -5.2%
- By 2050
- 162,547 · -9.3%
- By 2075
- 145,649 · -18.7%
- By 2100
- 123,025 · -31.4%
Race, ethnicity, and origin ACS 2023
- Neighborhood character
- Predominantly White (74%)
- Race & ethnicity
- White 74% Hispanic / Latino 15% Two or more races 12% Asian 3% Native American 2%
- Hispanic origin (detail)
- Mexican 11%
- Common ancestry
- Italian 6% Portuguese 2% Lithuanian 2%
- Foreign-born
- 6% · Canada, China, Vietnam
- Languages at home
- 90% English-only · Spanish 8% Other Indo-European 1% Chinese 1%
Political lean MEDSL · Shasta
- 2024 margin
- Solid R (+36.5) · D 30.5% · R 67.0% · Other 2.5%
- 2008→2024 swing
- -10.7pp toward R · 2008: -25.8pp · 2024: -36.5pp
- All cycles
- 2024: R+36.5 2020: R+33.1 2016: R+37.4 2012: R+30.3 2008: R+25.8
Not yet ingested
- Civics
- —
Market trends
- HPI YoY
- ▼ -191.70%
- Current HPI
- 179.6613
- Rent YoY
- —
- Metro
- Redding, CA
- State GDP YoY
- ▲ 3.21%
- F500 in state
- 116
Industry mix (Fortune 500 HQ in CA)
| Industry | F500 HQs | Revenue |
|---|---|---|
| Technology | 27 | $1,492B |
|
||
| Financial Services | 3 | $174B |
|
||
| Retail | 3 | $44B |
|
||
| Insurance | 3 | $26B |
|
||
| Media / Entertainment | 2 | $115B |
|
||
| Pharmaceuticals / Biotech | 2 | $62B |
|
||
Price history
-99.9% since first listed2 events — show timeline
- 2026-06-06 Price Changed $145,000 TCAOR
- 2026-06-06 Listed $145,000,000 TCAOR
Property tax history
+4.3%/yrLatest (2025): $1,575 · +13.6% YoY. Source: county tax records.
Cash-flow waterfall
monthlySold comps — $/sqft
last 12 mo · ≤1 miLoading sold comps…