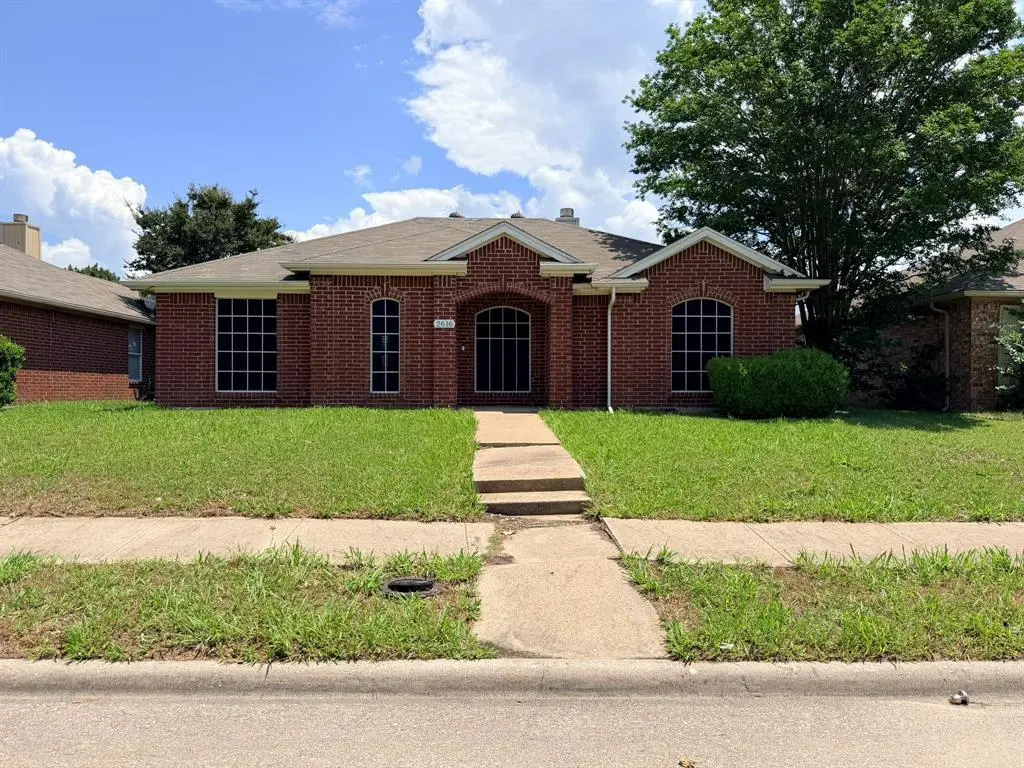
2616 Helen Ln · Mesquite, TX
Flood risk 1/10 · Minimal
- FEMA flood zone
- X (unshaded)
- Chance of flooding over 30 yrs
- 0.0%
- Est. flood insurance / yr
- $507 – $1,088
Fire risk 3/10 · Minor
- Est. fire insurance / yr
- $1,222 – $2,270
Heat risk 8/10 · Major
- Hot days now (above 110°F)
- 7 days/yr
- Hot days in 30 yrs
- 25 days/yr
Wind risk 6/10 · Moderate
- Chance of severe wind over 30 yrs
- 27.0%
Air-quality risk 2/10 · Minimal
- Unhealthy air days now
- 1 days/yr
- Unhealthy air days in 30 yrs
- 1 days/yr
Risk factors via First Street. Map © Google.
Why this score? — see what drove the C grade
The composite is a weighted blend of 9 inputs, each scored 0–100. Each bar is that input's sub-score; the figure is the points it added to the 100-point composite (weight × sub-score).
- Cash flow +19.4/30.0
- ARV discount +15.0/15.0
- 1% rule +6.4/10.0
- DSCR +6.1/10.0
- Livability +3.5/5.0
- Schools +2.9/10.0
- Rent growth +2.5/5.0
- Condition / age +2.5/5.0
- Appreciation +0.0/10.0
$215,250
🖨 Deal sheet 📄 Offer letter ✓ Due diligence
Listing remarks MLS
Great split bedroom floor plan with 3 bedrooms, 2 bathrooms, 2 living rooms, and 2 dining rooms. New carpet and laminates throughout as well as newer upgraded ceiling fans and 2 inch window blinds. Wonderful, sparkling pool in backyard with newer fence and locking, security fence separating pool area from patio. Location is just across the street from elementary school and playground.
Key facts
- Large backyard
- Functional floorplan
- Fixer-upper
Tags
Property features AI
Finance
- Other: Lot size approximately 0.134 acres; Subdivision lot: Creek Crossing Estates
- Financial info: Treat as clear loan type; No second mortgage
- HOA & community: No homeowners association
Exterior
- Parking: Attached 2-car garage; 2 covered spaces; 2-car carport; On-street parking available
- Utilities: City water; City sewer; Individual water meter; Individual gas meter
- Home design: Single-family residence; Residential property; One story; Subdivision: Creek Crossing Estates
- Construction: Built in 1993
- Exterior features: Alley access; Concrete driveway/paths; Curbs and sidewalks; City water; City sewer
Interior
- Kitchen: Electric cooktop; Electric oven; Microwave; Breakfast bar; Built-in cabinets
- Bedrooms: Primary bedroom (level 1) — approx. 12 x 14; Bedroom (level 1) — approx. 10 x 11; Bedroom (level 1) — approx. 10 x 11
- Bathrooms: 2 full bathrooms
- Heating & cooling: Individual gas meter
- Interior features: Built-in features; Eat-in kitchen; Walk-in closets; Two living areas; Two dining areas; 6 total rooms; One-story
Neighborhood map
What this means for you Summary
Snapshot
- This is a 3-bed/2.0-bath single-family listed at $215k.
Deal economics
- At list price, monthly cash flow is $242 ($3k/yr) — positive.
- The deal already cash-flows at list — no discount required.
- Meets the 1% rule at list price ($2k rent vs $215k).
- Recommended offer: $212k (1.5% below list) — sets the bar for market timing.
- Cap rate 7.6% vs local median 4.4% in Mesquite — top-decile yield for the area; either an underpriced asset or a hidden risk that comps aren't pricing in. Stress-test before assuming the spread holds.
Location & tenants
- Location reads 70/100 on livability (#358 in TX) — a middle-class / working-renter tenant base. Strengths: cost of living A+, housing A+, health & safety A-; Watch: crime F, commute F.
- Mesquite ISD (suburban): math 35% / reading 32% proficiency, ranked #536 of 826 in TX (top 65%) — families likely to look elsewhere, expect single-tenant / working-renter base with shorter leases; 63% free/reduced lunch — lower-income household profile, screen leases tightly.
- Zoned schools: Thompson El (math 20% / reading 27%, grade F, #3,247 of 4,322 statewide, top 76%, 608 students, 85% FRL) — zoned schools average 85% FRL vs 63% district-wide (22 pts higher); higher-poverty schools than district average — tighter screening recommended.
- Market conditions: Rents flat; 590 active listings in the ZIP; 22 comparable units currently listed for rent nearby; rentals at typical pace (median 21d on market — plan ~3-4 weeks tenant-placement turnaround); high-income renter base; 12,577 units permitted in Dallas County in 2024 (6,829 in 5+ unit buildings).
Forward outlook
- Local home prices are declining (-3.0%/yr); year-one equity from $1k of loan paydown is wiped out by about $6k of value loss. Plan a longer hold.
- Dallas County population projected at +35% by 2050 — long-run rental-demand tailwind backs the buy-and-hold thesis.
Negotiation context
- It's been on market 21 days — a 2% lower offer ($212k) is reasonable based on typical stale-listing flexibility.
- 4 sale attempts since 13y ago with the ask held roughly flat each time — persistent listings suggest the price (not the market) is what's stuck; bring a comps-based counter.
Risks & watch-outs
- Watch-outs: property tax is 2.7% of price.
- Climate carrying-cost: major wind risk, 27% chance of damaging wind over 30y; extreme-heat days projected 7→25/yr by 2055 (HVAC capex compounding) — expect insurance premiums to compound above CPI over the hold.
Questions for the listing agent
- Property tax is high relative to price — has the assessment been appealed recently, and will the sale trigger a re-assessment?
- Is there a deadline driving the sale (1031 exchange, divorce, estate, relocation)? That informs how much negotiation room exists.
- Crime grade is F in this area — have there been break-ins, vandalism, or insurance claims at this property in the last 3 years? What carrier currently insures it and at what premium?
- What's the average days-on-market for RENTAL listings here right now (not sales)? A rising rental-DOM trend means longer vacancies and softer asking-rent achievability than the comps imply.
- What's the recent tenant-quality profile in this submarket — average credit score on applications, eviction rate, late-payment / NSF rate, and stable-employment percentage? A property-management company in the area should have these aggregated.
- How much new for-sale + rental construction is in the pipeline within 1–3 miles? Heavy new supply typically softens prices + rents 12–24 months out; constrained supply supports both.
Investment metrics
- 1% rule
- 1.14% ✓
- Cap rate
- 7.64%
- Cash-on-cash
- 4.81%
- DSCR
- 1.21
- GRM
- 7.3
CMA / ARV
- ARV (on-the-fly)
- $260,652
- Comps found
- 12
Show comp detail 12 sales within ~0.75 mi
| Address | Dist | Beds/Ba | Sqft | Sold | Price | $/sf | Match |
|---|---|---|---|---|---|---|---|
| 2012 Creek Royal Dr | 0.11mi | 3/2.0 | 1,412 (-6%) | 0mo | $249,900 | $177 | 85 |
| 2121 Birch Bnd | 0.19mi | 4/2.5 (+1) | 1,547 (+3%) | 1mo | $283,900 | $184 | 78 |
| 2532 Spring Rain Dr | 0.17mi | 3/2.0 | 1,371 (-8%) | 3mo | $235,000 | $171 | 76 |
| 2833 Hidden Springs Dr | 0.24mi | 3/2.0 | 1,622 (+8%) | 1mo | $219,900 | $136 | 75 |
| 2012 Birch Bnd | 0.17mi | 3/2.0 | 1,347 (-10%) | 2mo | $248,000 | $184 | 74 |
| 1920 Walden Pl | 0.27mi | 3/2.0 | 1,622 (+8%) | 0mo | $299,000 | $184 | 73 |
| 2000 Creek Royal Dr | 0.10mi | 3/2.0 | 1,698 (+13%) | 2mo | $250,000 | $147 | 72 |
| 2216 Walden Pl | 0.35mi | 4/2.5 (+1) | 1,601 (+7%) | 0mo | $274,900 | $172 | 65 |
| 1837 Cool Springs Dr | 0.30mi | 3/2.0 | 1,316 (-12%) | 2mo | $260,000 | $198 | 64 |
| 2105 Highwood St | 0.33mi | 3/2.0 | 1,722 (+15%) | 3mo | $300,000 | $174 | 58 |
| 1905 Bent Brook Dr | 0.64mi | 3/2.0 | 1,664 (+11%) | 1mo | $275,000 | $165 | 51 |
| 1503 Springwood Dr | 0.54mi | 4/2.5 (+1) | 1,694 (+13%) | 2mo | $219,900 | $130 | 44 |
Match score weights: distance 35% · size 25% · config 20% · recency 20%. Top-matched comps best support the ARV.
Projected returns pro-forma
-3.0% appreciation · 0.07% rent growth · sell at horizon
- IRR
- -12.5%
- Equity multiple
- 0.56×
- Total profit
- $-26,385
- Equity at exit
- $32,094
- IRR
- -9.4%
- Equity multiple
- 0.51×
- Total profit
- $-29,790
- Equity at exit
- $18,611
Cash invested: $60,270 (down + closing). Projections, not guarantees.
Landlord ↔ Tenant lean methodology
- Overall (STATE)
- 87 Strongly Landlord-Friendly
- State Texas
- 87 Strongly Landlord-Friendly · R+5
- County
- — inherits STATE
- City
- — inherits STATE
ZIP-level market 75181
- Home prices YoY
- -9.4%
- Rents YoY
- 0.1%
- Active inventory
- 590
- Price-to-rent
- 7.3×
Monthly cashflow live
- Estimated rent
- $2,465 high interval (Pro) →
- Mortgage (P&I)
- −$1,129
- Tax from tax record
- −$487 /mo · $5,844/yr
- Insurance
- −$90
- HOA
- −$0
- Vacancy / Maint / Mgmt
- −$518
- Net cashflow
- $242
Break-even live
UW: 25.0% down · 7.5% · 30yr · 1.5% tax · 5.0% vac · 8.0% maint · 8.0% mgmt
Financing live
Cash to close
- Down payment
- $53,812
- Closing costs
- $6,458
- Reserves months
- —
- Total cash needed
- —
Loan-product check · same deal, 3 products live
Conventional
25% down · 7.5% · 30yr
- Down + closing
- —
- Monthly P&I
- —
- Monthly cashflow
- —
- DSCR
- —
- Eligible?
- —
Personal DTI + credit; lowest rate.
DSCR
20% down · 8.5% · 30yr
- Down + closing
- —
- Monthly P&I
- —
- Monthly cashflow
- —
- DSCR
- —
- Eligible?
- —
No personal income docs; deal must DSCR.
Hard money
10% down · 12.0% · 12mo
- Down + closing
- —
- Monthly P&I
- —
- Monthly cashflow
- —
- DSCR
- —
- Eligible?
- —
Short-term bridge; refi at stabilization.
Rent comps 22 comps
| Address | Beds | Baths | Sqft | Rent | $/sqft | DOM | Units | Dist |
|---|---|---|---|---|---|---|---|---|
| 2705 Hidden Springs Dr Mesquite, TX | 3.0 | 2.0 | 1656 | $2,280 | $1.38 | 2d | 1 | 0.06mi |
| 2632 Bent Brook Dr Mesquite, TX | 3.0 | 2.0 | 1622 | $1,995 | $1.23 | 5d | 1 | 0.11mi |
| 2008 Birch Bnd Mesquite, TX | 3.0 | 2.0 | 1580 | $2,799 | $1.77 | 7d | 1 | 0.15mi |
| 2524 Park Valley Dr Mesquite, TX | 3.0 | 2.0 | 1360 | $2,085 | $1.53 | 1d | 1 | 0.19mi |
| 2820 Bent Brook Dr Mesquite, TX | 3.0 | 2.0 | 1360 | $2,889 | $2.12 | 24d | 1 | 0.23mi |
| 2824 Bent Brook Dr Mesquite, TX | 3.0 | 2.0 | 1622 | $1,945 | $1.20 | 16d | 1 | 0.24mi |
| 2338 Stillwater Dr Mesquite, TX | 3.0 | 2.0 | 1765 | $2,300 | $1.30 | 20d | 1 | 0.24mi |
| 2213 Creek Royal Dr Mesquite, TX | 3.0 | 2.0 | 1505 | $1,850 | $1.23 | 22d | 1 | 0.25mi |
| 2213 Creek Royal Dr Mesquite, TX | 3.0 | 2.0 | 1505 | $1,850 | $1.23 | 43d | 1 | 0.25mi |
| 2136 Walden Pl Mesquite, TX | 3.0 | 2.0 | 1704 | $2,250 | $1.32 | 43d | 1 | 0.31mi |
| 2302 Highbank Dr Mesquite, TX | 3.0 | 2.0 | 1783 | $2,145 | $1.20 | 43d | 1 | 0.37mi |
| 1411 Sandalwood Dr Mesquite, TX | 3.0 | 2.0 | 1491 | $2,195 | $1.47 | 1d | 1 | 0.50mi |
| 1411 Springwood Dr Mesquite, TX | 4.0 | 2.5 | 1874 | $2,081 | $1.11 | 43d | 1 | 0.58mi |
| 2600 Waterloo Ln Mesquite, TX | 3.0 | 2.0 | 1460 | $1,900 | $1.30 | 43d | 1 | 0.81mi |
| 2013 Cranberry Ct Mesquite, TX | 3.0 | 2.5 | 1584 | $2,300 | $1.45 | 1d | 1 | 0.88mi |
| 2812 Clearmeadow Dr Mesquite, TX | 4.0 | 2.0 | 1837 | $2,800 | $1.52 | 1d | 1 | 0.91mi |
| 1233 Clear Creek Dr Mesquite, TX | 4.0 | 2.5 | 1749 | $2,289 | $1.31 | 7d | 1 | 0.93mi |
| 3613 Dove Ln Mesquite, TX | 4.0 | 2.0 | 1858 | $2,600 | $1.40 | 15d | 1 | 1.04mi |
| 2621 Ash Crk Mesquite, TX | 3.0 | 2.0 | 1843 | $2,299 | $1.25 | 43d | 1 | 1.14mi |
| 1729 Hazer Ln Mesquite, TX | 3.0 | 2.0 | 1498 | $2,400 | $1.60 | 20d | 1 | 1.44mi |
| 1217 Buckeye Dr Mesquite, TX | 3.0 | 2.0 | 1735 | $1,995 | $1.15 | 22d | 1 | 1.48mi |
| 1217 Buckeye Dr Mesquite, TX | 3.0 | 2.0 | 1735 | $1,995 | $1.15 | 43d | 1 | 1.48mi |
Listing history 32 events
-
2026-06-18days on market $215,250 Active 21 DOM
-
2026-06-17days on market $215,250 Active 20 DOM
-
2026-06-16days on market $215,250 Active 19 DOM
-
2026-06-15days on market $215,250 Active 18 DOM
-
2026-06-13days on market $215,250 Active 16 DOM
-
2026-06-13days on market $215,250 Active 15 DOM
-
2026-06-09days on market $215,250 Active 12 DOM
-
2026-06-08days on market $215,250 Active 11 DOM
-
2026-06-07days on market $215,250 Active 10 DOM
-
2026-06-04days on market $215,250 Active 7 DOM
-
2026-06-03days on market $215,250 Active 6 DOM
-
2026-06-02days on market $215,250 Active 5 DOM
-
2026-06-01days on market $215,250 Active 4 DOM
-
2026-05-31days on market $215,250 Active 3 DOM
-
2026-05-28$215,250 Active
-
2026-01-06historical
-
2025-12-19price $220,000
-
2025-12-04price $230,000
-
2025-11-11price $249,900
-
2025-11-03price $255,000
-
2025-07-18price $269,700
-
2025-07-02$275,000 Active
-
2016-10-18soldstatus
-
2016-10-17soldstatus Sold 387-char remark
Show marketing remark (387 chars)
Great split bedroom floor plan with 3 bedrooms, 2 bathrooms, 2 living rooms, and 2 dining rooms. New carpet and laminates throughout as well as newer upgraded ceiling fans and 2 inch window blinds. Wonderful, sparkling pool in backyard with newer fence and locking, security fence separating pool area from patio. Location is just across the street from elementary school and playground.
-
2016-09-15status Pending 387-char remark
Show marketing remark (387 chars)
Great split bedroom floor plan with 3 bedrooms, 2 bathrooms, 2 living rooms, and 2 dining rooms. New carpet and laminates throughout as well as newer upgraded ceiling fans and 2 inch window blinds. Wonderful, sparkling pool in backyard with newer fence and locking, security fence separating pool area from patio. Location is just across the street from elementary school and playground.
-
2016-09-08historical Active Contingent 387-char remark
Show marketing remark (387 chars)
Great split bedroom floor plan with 3 bedrooms, 2 bathrooms, 2 living rooms, and 2 dining rooms. New carpet and laminates throughout as well as newer upgraded ceiling fans and 2 inch window blinds. Wonderful, sparkling pool in backyard with newer fence and locking, security fence separating pool area from patio. Location is just across the street from elementary school and playground.
-
2016-08-30$160,000 Active 387-char remark
Show marketing remark (387 chars)
Great split bedroom floor plan with 3 bedrooms, 2 bathrooms, 2 living rooms, and 2 dining rooms. New carpet and laminates throughout as well as newer upgraded ceiling fans and 2 inch window blinds. Wonderful, sparkling pool in backyard with newer fence and locking, security fence separating pool area from patio. Location is just across the street from elementary school and playground.
-
2013-12-16soldstatus
-
2013-12-12soldstatus Closed
-
2013-11-14status Pending
-
2013-11-12$113,000 Active
-
1993-10-29soldstatus
ⓘ Source: listings_history table (triggers on properties + properties_extension) + one-shot
backfill from property_details.listing_events for pre-trigger history.
Tax reassessment forecast TX · Resets to sale price
- Current annual tax
- $5,844 · $487/mo
- Projected year-2 tax
- $5,844 · $487/mo
- Expected delta
- $0/yr ($0/mo · 0.0%)
ⓘ Screening estimate from a state-policy table — verify with the county assessor before closing.
Climate risk First Street
- Flood 1/10 Low FEMA zone X (unshaded) · 0% chance over 30 yrs
- Wildfire 3/10 Moderate
- Heat 8/10 Severe 7 d/yr ≥110°F today · 25 d/yr by 30 yrs out
- Wind 6/10 Major 27% chance of damaging wind over 30 yrs
- Air quality 2/10 Low 1 unhealthy d/yr today · 1 by 30 yrs out
Nearby sold comps map
Loading sold comps map…
Walkable amenities ~0.75 mi
Loading nearby amenities…
Taxation est. · year 1
- Rental income
- $29,574
- − Mortgage interest
- −$12,057
- − Property taxes
- −$5,844
- − Insurance
- −$1,076
- − Repairs & maintenance
- −$2,366
- − Management
- −$2,366
- − Depreciation
- −$6,262
- Taxable loss
- −$397
- Est. tax savings @ 24.0%
- +$95
- After-tax cash flow
- $2,993/yr
For passive investors: Depreciation is non-cash, so a rental often shows a tax loss while cash-flowing — sheltering income. Rental losses are passive: they offset passive income freely, and up to $25,000/yr can offset ordinary (W-2) income if you actively participate and your MAGI is under $100k (phasing out to $0 by $150k); unused losses carry forward. On sale, claimed depreciation is recaptured at up to 25%, and gains may owe capital-gains tax (a 1031 exchange can defer both). Figures are a year-1 estimate at your 24.0% rate — not tax advice; consult a CPA.
Schools (NCES district)
- District
- Mesquite ISD
- NCES district ID
- 4830390
- Math proficiency
- 35% ▼ -11.00%
- Reading proficiency
- 32% ▼ -7.00%
- Median HH income
- $49,372
- Composite
- 29.06/100
- National rank
- #6606
- State rank
- #536 of 826 in TX
Livability — Mesquite
- Score
- 70/100
- State rank
- #358
- US rank
- #7743
Category grades
Schools grade is shown separately in the Schools card above.
Census & demographics
- Census place
- Mesquite, TX
- County
- Dallas County · 2,612,404 people
- City population
- 150,788
- Metro
- Dallas-Fort Worth-Arlington, TX
- Population (ZIP)
- 29,788
- Household income
- $111,052
- Rent vs Own
- Severe rent burden
- 857.0
Population outlook (Dallas County) Hauer SSP2
- Today (2025)
- 2,979,839 people
- By 2030
- 3,191,823 · +7.1%
- By 2040
- 3,619,611 · +21.5%
- By 2050
- 4,026,915 · +35.1%
- By 2075
- 4,957,073 · +66.4%
- By 2100
- 5,508,725 · +84.9%
Race, ethnicity, and origin ACS 2023
- Neighborhood character
- Highly diverse neighborhood (Simpson 0.71)
- Race & ethnicity
- Black 39% Hispanic / Latino 32% Two or more races 21% White 16% Asian 5% Native American 1%
- Hispanic origin (detail)
- Mexican 27% Puerto Rican 1%
- Common ancestry
- Slovak 2% Italian 1%
- Foreign-born
- 22% · Canada, Vietnam
- Languages at home
- 64% English-only · Spanish 27% Tagalog/Filipino 3% Other Asian/Pacific 1%
Political lean MEDSL · Dallas
- 2024 margin
- Strong D (+22.2) · D 60.2% · R 38.0% · Other 1.8%
- 2008→2024 swing
- +6.9pp toward D · 2008: 15.3pp · 2024: 22.2pp
- All cycles
- 2024: D+22.2 2020: D+31.6 2016: D+26.2 2012: D+15.4 2008: D+15.3
Not yet ingested
- Civics
- —
Market trends
- HPI YoY
- ▼ -26.63%
- Current HPI
- 257.0959
- Rent YoY
- ▲ 0.07%
- Metro
- Dallas-Fort Worth-Arlington, TX
- State GDP YoY
- ▲ 3.95%
- F500 in state
- 110
Industry mix (Fortune 500 HQ in TX)
| Industry | F500 HQs | Revenue |
|---|---|---|
| Energy | 16 | $1,198B |
|
||
| Technology | 5 | $198B |
|
||
| Engineering / Construction | 4 | $72B |
|
||
| Energy Services | 3 | $60B |
|
||
| Utilities | 3 | $41B |
|
||
| Healthcare | 2 | $330B |
|
||
Price history
+90.5% since first listed18 events — show timeline
- 2026-05-28 Listed $215,250 NTREIS
- 2026-01-06 Listing Removed — NTREIS
- 2025-12-19 Price Changed $220,000 NTREIS
- 2025-12-04 Price Changed $230,000 NTREIS
- 2025-11-11 Price Changed $249,900 NTREIS
- 2025-11-03 Price Changed $255,000 NTREIS
- 2025-07-18 Price Changed $269,700 NTREIS
- 2025-07-02 Listed $275,000 NTREIS
- 2016-10-18 Sold (Public Records) — Public Records
- 2016-10-17 Sold (MLS) — NTREIS
- 2016-09-15 Pending — NTREIS
- 2016-09-08 Contingent — NTREIS
- 2016-08-30 Listed $160,000 NTREIS
- 2013-12-16 Sold (Public Records) — Public Records
- 2013-12-12 Sold (MLS) — NTREIS
- 2013-11-14 Pending — NTREIS
- 2013-11-12 Listed $113,000 NTREIS
- 1993-10-29 Sold (Public Records) — Public Records
Property tax history
+3.6%/yrLatest (2025): $5,844 · +1.1% YoY. Source: county tax records.
Cash-flow waterfall
monthlySold comps — $/sqft
last 12 mo · ≤1 miLoading sold comps…