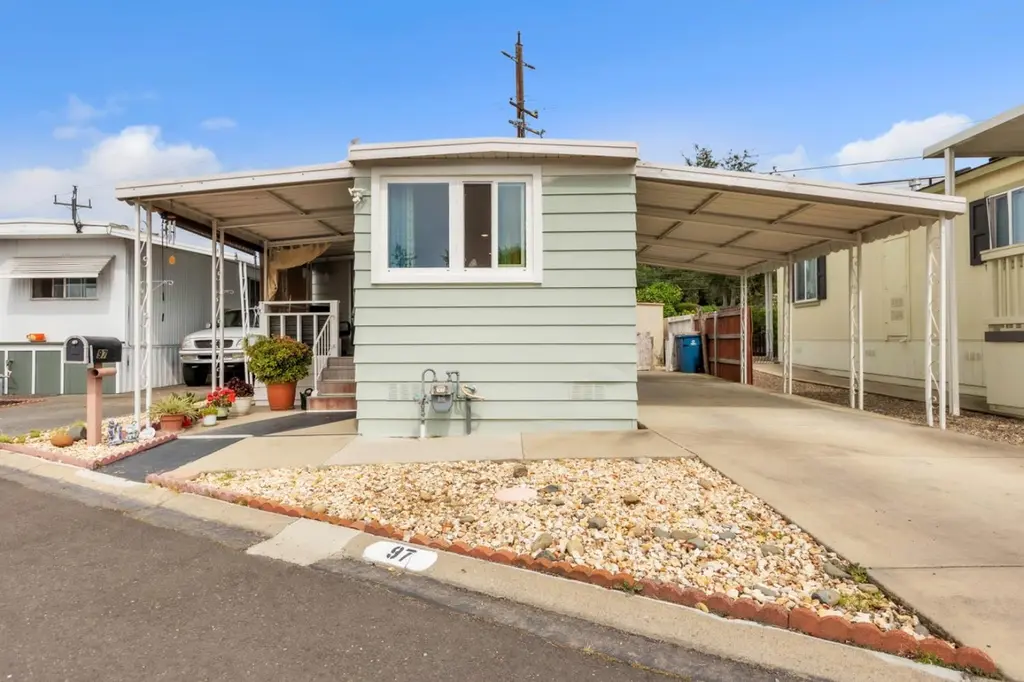
97 97 Wilderness Rd · Rancho Cordova, CA
Flood risk 4/10 · Minor
- FEMA flood zone
- X (unshaded)
- Chance of flooding over 30 yrs
- 0.22%
- Est. flood insurance / yr
- $507 – $1,088
Fire risk 4/10 · Minor
- Est. fire insurance / yr
- $659 – $1,223
Heat risk 7/10 · Major
- Hot days now (above 102°F)
- 7 days/yr
- Hot days in 30 yrs
- 16 days/yr
Wind risk 1/10 · Minimal
- Chance of severe wind over 30 yrs
- —
Air-quality risk 10/10 · Severe
- Unhealthy air days now
- 33 days/yr
- Unhealthy air days in 30 yrs
- 35 days/yr
Risk factors via First Street. Map © Google.
Why this score? — see what drove the B grade
The composite is a weighted blend of 9 inputs, each scored 0–100. Each bar is that input's sub-score; the figure is the points it added to the 100-point composite (weight × sub-score).
- Cash flow +30.0/30.0
- 1% rule +10.0/10.0
- DSCR +10.0/10.0
- ARV discount +8.9/15.0
- Schools +4.4/10.0
- Livability +3.4/5.0
- Rent growth +2.7/5.0
- Condition / age +2.5/5.0
- Appreciation +0.0/10.0
$58,900
🖨 Deal sheet 📄 Offer letter ✓ Due diligence
Listing remarks
Move-in ready 2 bedroom, 1 bath mobile home in a secure, gated 55+ community. Completely remodeled with new windows, fresh paint, and new flooring throughout. Bright, open living space, easy low‑maintenance layout, and a convenient central location within the park just minutes from shopping, restaurants, and services. Ideal for downsizers seeking comfort, security, and accessibility.
Key facts
- Gated community
- Fresh paint
- Completely remodeled
Tags
Neighborhood map
What this means for you Summary
Snapshot
- This is a 2-bed/1.0-bath manufactured listed at $59k.
Deal economics
- At list price, monthly cash flow is $1k ($14k/yr) — positive.
- The deal already cash-flows at list — no discount required.
- Meets the 1% rule at list price ($2k rent vs $59k).
- Cap rate 30.6% vs local median 3.0% in Rancho Cordova — top-decile yield for the area; either an underpriced asset or a hidden risk that comps aren't pricing in. Stress-test before assuming the spread holds.
Location & tenants
- Location reads 68/100 on livability (#268 in CA) — a middle-class / working-renter tenant base. Strengths: housing A+, employment B; Watch: schools C-, commute C-, crime D.
- San Juan Unified (suburban): math 40% / reading 62% proficiency, ranked #138 of 517 in CA (top 27%) — acceptable for families but not a draw, mixed tenant base, ~2y average lease.
- Market conditions: Rents flat; 223 active listings in the ZIP; 16 comparable units currently listed for rent nearby; rentals at typical pace (median 18d on market — plan ~3-4 weeks tenant-placement turnaround); solid renter incomes; 6,825 units permitted in Sacramento County in 2024 (1,752 in 5+ unit buildings).
Forward outlook
- Local home prices are declining (-3.0%/yr); year-one equity from $407 of loan paydown is wiped out by about $2k of value loss. Plan a longer hold.
- Sacramento County population projected at +17% by 2050 — long-run rental-demand tailwind backs the buy-and-hold thesis.
- At projected returns (-3.0% appreciation + 0.9% rent growth), your $16k cash investment doubles in ~2 years — after that, you're playing with house money.
Negotiation context
- Only 14 days on market — expect competitive offers; lowballing is unlikely to land.
Risks & watch-outs
- Climate carrying-cost: extreme-heat days projected 7→16/yr by 2055 (HVAC capex compounding) — expect insurance premiums to compound above CPI over the hold.
Questions for the listing agent
- Built in 1964 — when were the roof, HVAC, electrical panel, plumbing, and water heater last replaced?
- Is there a deadline driving the sale (1031 exchange, divorce, estate, relocation)? That informs how much negotiation room exists.
- Crime grade is D in this area — have there been break-ins, vandalism, or insurance claims at this property in the last 3 years? What carrier currently insures it and at what premium?
- What's the average days-on-market for RENTAL listings here right now (not sales)? A rising rental-DOM trend means longer vacancies and softer asking-rent achievability than the comps imply.
- What's the recent tenant-quality profile in this submarket — average credit score on applications, eviction rate, late-payment / NSF rate, and stable-employment percentage? A property-management company in the area should have these aggregated.
- How much new for-sale + rental construction is in the pipeline within 1–3 miles? Heavy new supply typically softens prices + rents 12–24 months out; constrained supply supports both.
Investment metrics
- 1% rule
- 3.44% ✓
- Cap rate
- 30.62%
- Cash-on-cash
- 86.89%
- DSCR
- 4.87
- GRM
- 2.4
CMA / ARV
- ARV (on-the-fly)
- $60,800
- Comps found
- 12
Show comp detail 12 sales within ~0.75 mi
| Address | Dist | Beds/Ba | Sqft | Sold | Price | $/sf | Match |
|---|---|---|---|---|---|---|---|
| 97 97 Wilderness Rd | 0.00mi | 2/1.0 | 760 (0%) | 1mo | $59,000 | $78 | 99 |
| 318 Sunny Hills Dr | 0.18mi | 2/1.0 | 720 (-5%) | 1mo | $41,500 | $58 | 82 |
| 28 Golden Inn Way | 0.02mi | 2/1.0 | 700 (-8%) | 8mo | $49,000 | $70 | 79 |
| 247 Rocky Hills Ln | 0.13mi | 2/1.0 | 720 (-5%) | 9mo | $72,000 | $100 | 78 |
| 19 Golden Inn Way | 0.05mi | 2/2.0 | 816 (+7%) | 10mo | $120,000 | $147 | 73 |
| 117 Floral Hills Way | 0.09mi | 1/1.0 (-1) | 800 (+5%) | 11mo | $66,800 | $84 | 73 |
| 245 Rocky Hills Ln | 0.13mi | 2/1.0 | 684 (-10%) | 8mo | $54,888 | $80 | 70 |
| 18 Golden Inn Way | 0.05mi | 1/1.0 (-1) | 828 (+9%) | 10mo | $35,000 | $42 | 70 |
| 328 Sierra Vista Dr | 0.19mi | 2/1.0 | 660 (-13%) | 6mo | $96,000 | $145 | 64 |
| 62 Pineacre Ln | 0.07mi | 1/1.0 (-1) | 832 (+10%) | 14mo | $48,888 | $59 | 64 |
| 134 Gumtree Dr | 0.11mi | 1/1.0 (-1) | 850 (+12%) | 9mo | $69,888 | $82 | 63 |
| 33 Sunbeam Way | 0.06mi | 2/1.0 | 870 (+14%) | 19mo | $50,000 | $57 | 57 |
Match score weights: distance 35% · size 25% · config 20% · recency 20%. Top-matched comps best support the ARV.
Projected returns pro-forma
-3.0% appreciation · 0.9% rent growth · sell at horizon
- IRR
- 85.0%
- Equity multiple
- 4.78×
- Total profit
- $62,346
- Equity at exit
- $8,782
- IRR
- 87.7%
- Equity multiple
- 9.24×
- Total profit
- $135,843
- Equity at exit
- $5,093
Cash invested: $16,492 (down + closing). Projections, not guarantees.
Landlord ↔ Tenant lean methodology
- Overall (STATE)
- 18 Strongly Tenant-Friendly
- State California
- 18 Strongly Tenant-Friendly · D+13
- County
- — inherits STATE
- City
- — inherits STATE
ZIP-level market 95670
- Rents YoY
- 0.9%
- Active inventory
- 223
- Price-to-rent
- 2.4×
Monthly cashflow live
- Estimated rent
- $2,027 high interval (Pro) →
- Mortgage (P&I)
- −$309
- Tax est. 1.5%
- −$74 /mo · $884/yr
- Insurance
- −$25
- HOA
- −$0
- Vacancy / Maint / Mgmt
- −$426
- Net cashflow
- $1,194
Break-even live
UW: 25.0% down · 7.5% · 30yr · 1.5% tax · 5.0% vac · 8.0% maint · 8.0% mgmt
Financing live
Cash to close
- Down payment
- $14,725
- Closing costs
- $1,767
- Reserves months
- —
- Total cash needed
- —
Loan-product check · same deal, 3 products live
Conventional
25% down · 7.5% · 30yr
- Down + closing
- —
- Monthly P&I
- —
- Monthly cashflow
- —
- DSCR
- —
- Eligible?
- —
Personal DTI + credit; lowest rate.
DSCR
20% down · 8.5% · 30yr
- Down + closing
- —
- Monthly P&I
- —
- Monthly cashflow
- —
- DSCR
- —
- Eligible?
- —
No personal income docs; deal must DSCR.
Hard money
10% down · 12.0% · 12mo
- Down + closing
- —
- Monthly P&I
- —
- Monthly cashflow
- —
- DSCR
- —
- Eligible?
- —
Short-term bridge; refi at stabilization.
Rent comps 16 comps
| Address | Beds | Baths | Sqft | Rent | $/sqft | DOM | Units | Dist |
|---|---|---|---|---|---|---|---|---|
| 2220 Cemo Cir Gold River, CA | 2.0–3.0 | 2.0 | 1203 | $2,499 | $2.08 | 2d | 7 | 0.32mi |
| 11150 Trinity River Dr Rancho Cordova, CA | 2.0–3.0 | 2.0 | 1091 | $1,850 | $1.69 | 43d | 2 | 0.34mi |
| 11150 Trinity River Dr #79 Rancho Cordova, CA | 2.0 | 1.0 | 941 | $1,980 | $2.10 | 23d | 1 | 0.37mi |
| 2330 Vehicle Dr Rancho Cordova, CA | 1.0–2.0 | 1.0–2.0 | 847 | $2,230 | $2.63 | 20d | 9 | 0.43mi |
| 2330 Vehicle Dr Rancho Cordova, CA | 1.0–2.0 | 1.0–2.0 | 847 | $2,225 | $2.63 | 2d | 1 | 0.43mi |
| 2437 Rashawn Dr Rancho Cordova, CA | 2.0 | 1.0 | 970 | $1,900 | $1.96 | 7d | 1 | 0.53mi |
| 11260 Point East Dr Rancho Cordova, CA | 1.0–2.0 | 1.0 | 615 | $1,985 | $3.23 | 2d | 29 | 0.54mi |
| 11070 Hirschfeld Way Rancho Cordova, CA | 1.0–2.0 | 1.0 | 800 | $1,880 | $2.35 | 2d | 4 | 0.60mi |
| 10890 Coloma Rd Rancho Cordova, CA | 2.0 | 1.0 | 925 | $1,499 | $1.62 | 23d | 3 | 0.84mi |
| 10870 Coloma Rd Rancho Cordova, CA | 2.0 | 1.0 | 950 | $1,499 | $1.58 | 3d | 1 | 0.93mi |
| 1990 Benita Dr Rancho Cordova, CA | 2.0 | 1.5 | 960 | $2,300 | $2.40 | 43d | 1 | 1.03mi |
| 10780 Coloma Rd Rancho Cordova, CA | 1.0–2.0 | 1.0 | 760 | $1,515 | $1.99 | 2d | 7 | 1.08mi |
| 10922 Scotsman Way Rancho Cordova, CA | 2.0 | 2.0 | 1100 | $2,050 | $1.86 | 17d | 1 | 1.12mi |
| 2652 Los Nogales Way Rancho Cordova, CA | 2.0 | 2.0 | 1000 | $2,000 | $2.00 | 43d | 1 | 1.19mi |
| 2657 McGregor Dr Rancho Cordova, CA | 2.0 | 2.0 | 1012 | $1,595 | $1.58 | 43d | 1 | 1.21mi |
| 10680 Coloma Rd Rancho Cordova, CA | 1.0–2.0 | 1.0 | 730 | $1,889 | $2.59 | 2d | 11 | 1.33mi |
Climate risk First Street
- Flood 4/10 Moderate FEMA zone X (unshaded) · 22% chance over 30 yrs
- Wildfire 4/10 Moderate
- Heat 7/10 Severe 7 d/yr ≥102°F today · 16 d/yr by 30 yrs out
- Wind 1/10 Low
- Air quality 10/10 Extreme 33 unhealthy d/yr today · 35 by 30 yrs out
Nearby sold comps map
Loading sold comps map…
Walkable amenities ~0.75 mi
Loading nearby amenities…
Taxation est. · year 1
- Rental income
- $24,321
- − Mortgage interest
- −$3,299
- − Property taxes
- −$884
- − Insurance
- −$294
- − Repairs & maintenance
- −$1,946
- − Management
- −$1,946
- − Depreciation
- −$1,713
- Taxable income
- $14,239
- Est. tax owed @ 24.0%
- −$3,417
- After-tax cash flow
- $10,912/yr
For passive investors: Depreciation is non-cash, so a rental often shows a tax loss while cash-flowing — sheltering income. Rental losses are passive: they offset passive income freely, and up to $25,000/yr can offset ordinary (W-2) income if you actively participate and your MAGI is under $100k (phasing out to $0 by $150k); unused losses carry forward. On sale, claimed depreciation is recaptured at up to 25%, and gains may owe capital-gains tax (a 1031 exchange can defer both). Figures are a year-1 estimate at your 24.0% rate — not tax advice; consult a CPA.
Schools (NCES district)
- District
- San Juan Unified
- NCES district ID
- 0634620
- Math proficiency
- 40% ▲ 3.00%
- Reading proficiency
- 62% ▲ 16.00%
- Median HH income
- $55,655
- Composite
- 44.07/100
- National rank
- #2878
- State rank
- #138 of 517 in CA
Livability — Rancho Cordova
- Score
- 68/100
- State rank
- #268
- US rank
- #9126
Category grades
Schools grade is shown separately in the Schools card above.
Census & demographics
- Census place
- Rancho Cordova, CA
- County
- Sacramento County · 1,539,646 people
- City population
- 98,329
- Metro
- Sacramento-Roseville-Folsom, CA
- Population (ZIP)
- 58,819
- Household income
- $89,484
- Rent vs Own
- Severe rent burden
- 2389.0
Population outlook (Sacramento County) Hauer SSP2
- Today (2025)
- 1,660,763 people
- By 2030
- 1,732,990 · +4.3%
- By 2040
- 1,855,755 · +11.7%
- By 2050
- 1,941,335 · +16.9%
- By 2075
- 2,046,162 · +23.2%
- By 2100
- 1,961,444 · +18.1%
Race, ethnicity, and origin ACS 2023
- Neighborhood character
- Diverse neighborhood (Simpson 0.67)
- Race & ethnicity
- White 51% Hispanic / Latino 21% Two or more races 12% Asian 12% Black 10% Native American 1%
- Hispanic origin (detail)
- Mexican 17%
- Common ancestry
- Scotch-Irish 2% Subsaharan African 2% Italian 2%
- Foreign-born
- 24% · Canada, Vietnam, South Korea
- Languages at home
- 66% English-only · Spanish 13% Other Indo-European 7% Russian/Polish/Slavic 5%
Political lean MEDSL · Sacramento
- 2024 margin
- D (+19.7) · D 58.1% · R 38.4% · Other 3.5%
- 2008→2024 swing
- +0.7pp no change · 2008: 19.0pp · 2024: 19.7pp
- All cycles
- 2024: D+19.7 2020: D+25.3 2016: D+23.7 2012: D+16.3 2008: D+19.0
Not yet ingested
- Civics
- —
Market trends
- HPI YoY
- ▼ -263.38%
- Current HPI
- 300.0788
- Rent YoY
- ▲ 0.90%
- Metro
- Sacramento-Roseville-Folsom, CA
- State GDP YoY
- ▲ 3.21%
- F500 in state
- 116
Industry mix (Fortune 500 HQ in CA)
| Industry | F500 HQs | Revenue |
|---|---|---|
| Technology | 27 | $1,492B |
|
||
| Financial Services | 3 | $174B |
|
||
| Retail | 3 | $44B |
|
||
| Insurance | 3 | $26B |
|
||
| Media / Entertainment | 2 | $115B |
|
||
| Pharmaceuticals / Biotech | 2 | $62B |
|
||
Cash-flow waterfall
monthlySold comps — $/sqft
last 12 mo · ≤1 miLoading sold comps…