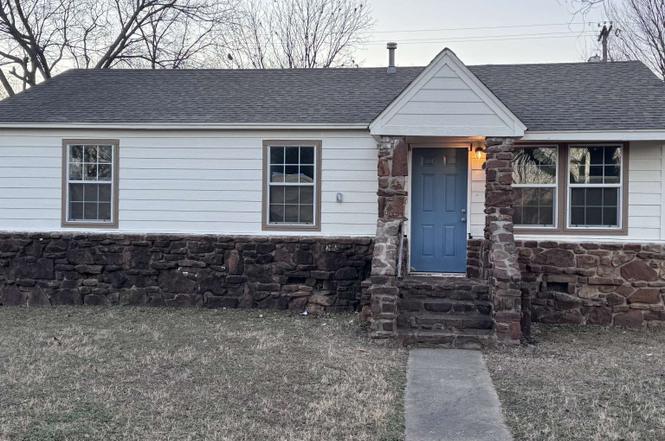
4252 N Hartford Ave · Tulsa, OK
Flood risk 1/10 · Minimal
- FEMA flood zone
- X (unshaded)
- Chance of flooding over 30 yrs
- 0.0%
- Est. flood insurance / yr
- $507 – $1,088
Fire risk 5/10 · Moderate
- Est. fire insurance / yr
- $2,463 – $4,575
Heat risk 6/10 · Moderate
- Hot days now (above 110°F)
- 7 days/yr
- Hot days in 30 yrs
- 18 days/yr
Wind risk 3/10 · Minor
- Chance of severe wind over 30 yrs
- 4.0%
Air-quality risk 2/10 · Minimal
- Unhealthy air days now
- 2 days/yr
- Unhealthy air days in 30 yrs
- 2 days/yr
Risk factors via First Street. Map © Google.
Why this score? — see what drove the D grade
The composite is a weighted blend of 9 inputs, each scored 0–100. Each bar is that input's sub-score; the figure is the points it added to the 100-point composite (weight × sub-score).
- Cash flow +14.1/30.0
- ARV discount +7.4/15.0
- DSCR +4.3/10.0
- Livability +3.8/5.0
- 1% rule +3.6/10.0
- Rent growth +3.4/5.0
- Appreciation +2.7/10.0
- Condition / age +2.5/5.0
- Schools +0.8/10.0
$149,500
🖨 Deal sheet (PDF) 📄 Offer letter ✓ Due diligence
Listing remarks MLS
Calling all investors. Charming 4-bedroom home for sale! This home features Granite Countertops, Hardwood Floors, washer & dryer hookups, and a beautiful large yard with a deck. Perfect for your long-term tenant to enjoy, with lots of newly improved features! Currently occupied with renters and professionally managed. Please do not disturb tenants. Text the agent for showing information and more details about the property.
Key facts
- New lighting
- New siding
- New paint
Tags
Property features AI
Exterior
- Parking: Asphalt parking
- Security: Smoke detectors; No safety shelter
- Utilities: Electricity available; Natural gas available; Public water; Public sewer
- Home design: Single-story home; Faces east; Entry on first floor
- Construction: Wood frame construction; Asphalt/fiberglass roof; Crawlspace foundation; Built per public records
- Exterior features: Deck; Porch; Chain link full fencing; Corner lot; Mature trees
Interior
- Kitchen: Dishwasher; Microwave; Oven; Range/Stove; Refrigerator; Plumbed for ice maker
- Bedrooms: Primary bedroom with private bath and walk-in closet (first floor); Three additional bedrooms without attached baths (first floor)
- Flooring: Carpet; Laminate
- Bathrooms: Two full bathrooms; Master bath with bathtub, double sink, fan/vent
- Heating & cooling: Gas heating; Heat pump; Central air conditioning
- Interior features: Butcher block counters; Granite counters; Ceiling fans; Electric oven connection; Aluminum window frames; Vinyl window frames
- Laundry & utility: Washer hookup; Electric dryer hookup; Utility room (first floor)
Neighborhood map
What this means for you Summary
Snapshot
- This is a 4-bed/1.0-bath single-family listed at $150k.
Deal economics
- At list price, monthly cash flow is $21 ($256/yr) — positive.
- The deal already cash-flows at list — no discount required.
- To meet the 1% rule (rent ≥ 1% of price), the offer needs to be $129k (14.0% below list).
- Recommended offer: $129k (14.0% below list) — sets the bar for 1% rule.
- Cap rate 6.5% vs local median 3.8% in Tulsa — top-decile yield for the area; either an underpriced asset or a hidden risk that comps aren't pricing in. Stress-test before assuming the spread holds.
Location & tenants
- Location reads 75/100 on livability (#13 in OK, #4,058 nationally) — a middle-class / working-renter tenant base. Strengths: amenities A+, commute A+, cost of living A+; Watch: crime F, employment D-.
- Tulsa (urban): math 7% / reading 12% proficiency, ranked #250 of 270 in OK (top 93%) — low school quality limits family demand, transient renter base, plan for 1-2y turnover; 76% free/reduced lunch — lower-income household profile, screen leases tightly.
- Zoned schools: Project Accept Traice Es (math 10% / reading 10%, grade F, #695 of 845 statewide, top 84%, 558 students, 0% FRL); Monroe Demonstration Ms (math 0% / reading 2%, grade F, #344 of 345 statewide, top 100%, 688 students, 0% FRL); Booker T. Washington Hs (math 41% / reading 61%, grade D+, #2 of 447 statewide, top 0%, 1,280 students, 0% FRL) — zoned schools average 0% FRL vs 76% district-wide (76 pts lower); this property's tenant base skews higher-income than the district average.
- Market conditions: Rents rising (+3.5%/yr); 137 active listings in the ZIP; 12 comparable units currently listed for rent nearby; rentals leasing fast (median 5d on market — plan ~1-2 weeks tenant-placement turnaround); lower-income renter base — watch delinquency; 2,818 units permitted in Tulsa County in 2024 (518 in 5+ unit buildings).
- This rent runs 38% of the median local income ($41k/yr) — at the standard rent-burdened threshold; future hikes will face affordability resistance.
Forward outlook
- Local home prices are declining (-3.0%/yr); year-one equity from $1k of loan paydown is wiped out by about $4k of value loss. Plan a longer hold.
- Tulsa County population projected at +30% by 2050 — long-run rental-demand tailwind backs the buy-and-hold thesis.
Negotiation context
- It's been on market 37 days — a 3% lower offer ($145k) is reasonable based on typical stale-listing flexibility.
- 8 sale attempts since 28y ago with the ask held roughly flat each time — persistent listings suggest the price (not the market) is what's stuck; bring a comps-based counter.
- Current owner paid $115k; 30% above their basis — modest negotiation headroom, anchor on the comps not their cost.
Risks & watch-outs
- Watch-outs: built in 1952 — expect roof / HVAC / electrical / plumbing capex.
- Climate carrying-cost: moderate wildfire risk; extreme-heat days projected 7→18/yr by 2055 (HVAC capex compounding) — expect insurance premiums to compound above CPI over the hold.
Questions for the listing agent
- It's been on market 37 days. Have you received any prior offers? Is the seller open to a 14% concession, seller financing, or rate buy-down credit?
- Built in 1952 — when were the roof, HVAC, electrical panel, plumbing, and water heater last replaced?
- Is there a deadline driving the sale (1031 exchange, divorce, estate, relocation)? That informs how much negotiation room exists.
- Schools are F-rated, which usually means shorter tenancies and higher turnover. Who's the typical renter profile here, and what's been the actual vacancy rate?
- Crime grade is F in this area — have there been break-ins, vandalism, or insurance claims at this property in the last 3 years? What carrier currently insures it and at what premium?
- The area grade is low — what's the realistic commute time and amenity access for the typical tenant pool here? Any planned neighborhood developments (good or bad) we should know about?
- What's the average days-on-market for RENTAL listings here right now (not sales)? A rising rental-DOM trend means longer vacancies and softer asking-rent achievability than the comps imply.
- What's the recent tenant-quality profile in this submarket — average credit score on applications, eviction rate, late-payment / NSF rate, and stable-employment percentage? A property-management company in the area should have these aggregated.
- How much new for-sale + rental construction is in the pipeline within 1–3 miles? Heavy new supply typically softens prices + rents 12–24 months out; constrained supply supports both.
Investment metrics
- 1% rule
- 0.86% ✗
- Cap rate
- 6.46%
- Cash-on-cash
- 0.61%
- DSCR
- 1.03
- GRM
- 9.7
CMA / ARV
- ARV (on-the-fly)
- $149,040
- Comps found
- 12
Show comp detail 12 sales within ~0.75 mi
| Address | Dist | Beds/Ba | Sqft | Sold | Price | $/sf | Match |
|---|---|---|---|---|---|---|---|
| 4107 N Frankfort Ave | 0.32mi | 4/1.5 | 1,232 (-5%) | 2mo | $148,000 | $120 | 73 |
| 4554 Iroquois Ave | 0.28mi | 4/1.0 | 1,192 (-8%) | 3mo | $134,900 | $113 | 71 |
| 4371 N Garrison Pl | 0.18mi | 4/1.0 | 1,128 (-13%) | 0mo | $96,000 | $85 | 69 |
| 4610 N Detroit Ave | 0.49mi | 4/1.0 | 1,350 (+4%) | 6mo | $75,000 | $56 | 66 |
| 4324 N Garrison Pl | 0.09mi | 3/1.0 (-1) | 1,116 (-14%) | 5mo | $65,000 | $58 | 63 |
| 554 E 48th Pl N | 0.54mi | 4/2.0 | 1,229 (-5%) | 0mo | $141,000 | $115 | 62 |
| 408 E 40th Pl | 0.41mi | 3/1.5 (-1) | 1,184 (-9%) | 3mo | $151,000 | $128 | 57 |
| 3748 N Hartford Ave | 0.48mi | 4/2.0 | 1,200 (-7%) | 6mo | $150,000 | $125 | 56 |
| 4670 N Hartford Ave | 0.46mi | 4/1.5 | 1,105 (-15%) | 0mo | $112,000 | $101 | 52 |
| 4440 N Detroit Ave | 0.46mi | 3/1.0 (-1) | 1,138 (-12%) | 4mo | $138,000 | $121 | 50 |
| 4038 N Cincinnati Dr | 0.55mi | 3/1.0 (-1) | 1,130 (-13%) | 2mo | $180,000 | $159 | 47 |
| 26 E 45th St N | 0.58mi | 4/2.0 | 1,128 (-13%) | 6mo | $122,000 | $108 | 42 |
Match score weights: distance 35% · size 25% · config 20% · recency 20%. Top-matched comps best support the ARV.
Projected returns pro-forma
-3.0% appreciation · 3.54% rent growth · sell at horizon
- IRR
- -14.7%
- Equity multiple
- 0.47×
- Total profit
- $-22,171
- Equity at exit
- $22,291
- IRR
- -5.3%
- Equity multiple
- 0.65×
- Total profit
- $-14,663
- Equity at exit
- $12,926
Cash invested: $41,860 (down + closing). Projections, not guarantees.
Landlord ↔ Tenant lean methodology
- Overall (STATE)
- 83 Strongly Landlord-Friendly
- State Oklahoma
- 83 Strongly Landlord-Friendly · R+20
- County
- — inherits STATE
- City
- — inherits STATE
ZIP-level market 74106
- Home prices YoY
- -2.5%
- Rents YoY
- 3.5%
- Active inventory
- 137
- Price-to-rent
- 9.7×
Monthly cashflow live
- Estimated rent
- $1,286 high interval (Pro) →
- Mortgage (P&I)
- −$784
- Tax from tax record
- −$148 /mo · $1,780/yr
- Insurance
- −$62
- HOA
- −$0
- Vacancy / Maint / Mgmt
- −$270
- Net cashflow
- $21
Break-even live
Sensitivity live
| Price | -10% $106 | -5% $64 | +0% $21 | +5% $-21 | +10% $-63 |
|---|---|---|---|---|---|
| Rent | -10% $-80 | -5% $-29 | +0% $21 | +5% $72 | +10% $123 |
| Rate | -1.0pp $97 | -0.5pp $59 | base $21 | +0.5pp $-17 | +1.0pp $-57 |
UW: 25.0% down · 7.5% · 30yr · 1.5% tax · 5.0% vac · 8.0% maint · 8.0% mgmt
Financing live
Cash to close
- Down payment
- $37,375
- Closing costs
- $4,485
- Reserves months
- —
- Total cash needed
- —
Loan-product check · same deal, 3 products live
Conventional
25% down · 7.5% · 30yr
- Down + closing
- —
- Monthly P&I
- —
- Monthly cashflow
- —
- DSCR
- —
- Eligible?
- —
Personal DTI + credit; lowest rate.
DSCR
20% down · 8.5% · 30yr
- Down + closing
- —
- Monthly P&I
- —
- Monthly cashflow
- —
- DSCR
- —
- Eligible?
- —
No personal income docs; deal must DSCR.
Hard money
10% down · 12.0% · 12mo
- Down + closing
- —
- Monthly P&I
- —
- Monthly cashflow
- —
- DSCR
- —
- Eligible?
- —
Short-term bridge; refi at stabilization.
Rent comps 12 comps
| Address | Beds | Baths | Sqft | Rent | $/sqft | DOM | Units | Dist |
|---|---|---|---|---|---|---|---|---|
| 4908 N Hartford Ave Tulsa, OK | 3.0 | 1.0 | 900 | $900 | $1.00 | 3d | 1 | 0.59mi |
| 4430 N Main St Tulsa, OK | 3.0 | 1.0 | 1100 | $950 | $0.86 | 3d | 1 | 0.65mi |
| 636 E 49th Pl N Tulsa, OK | 3.0 | 1.0 | 1152 | $1,000 | $0.87 | 16d | 1 | 0.72mi |
| 3120 N Hartford Pl Tulsa, OK | 4.0 | 1.0 | 1176 | $1,500 | $1.28 | 5d | 1 | 1.14mi |
| 5519 N Garrison Pl Tulsa, OK | 3.0 | 1.0 | 1076 | $1,200 | $1.12 | 23d | 1 | 1.22mi |
| 5510 N Johnstown Ave Tulsa, OK | 3.0 | 1.0 | 972 | $995 | $1.02 | 3d | 1 | 1.25mi |
| 1530 E 52nd St N Tulsa, OK | 3.0 | 2.0 | 1042 | $1,500 | $1.44 | 3d | 1 | 1.26mi |
| 5618 N Garrison Pl Tulsa, OK | 3.0 | 1.0 | 904 | $1,100 | $1.22 | 23d | 1 | 1.36mi |
| 2014 E 49th St N Tulsa, OK | 3.0 | 1.0 | 970 | $1,100 | $1.13 | 25d | 1 | 1.36mi |
| 1553 E 53rd St N Tulsa, OK | 3.0 | 1.0 | 1100 | $1,250 | $1.14 | 3d | 1 | 1.36mi |
| 1645 E 54th St Tulsa, OK | 4.0 | 2.0 | 1800 | $1,600 | $0.89 | 12d | 1 | 1.45mi |
| 5731 N Garrison Pl Tulsa, OK | 3.0 | 1.0 | 912 | $925 | $1.01 | 3d | 1 | 1.49mi |
Listing history 23 events
-
2026-04-26status Pending
-
2026-04-14price $149,500
-
2026-04-07status Active
-
2026-02-09status Pending
-
2026-01-21$150,000 Active
-
2023-09-19soldstatus $115,000
-
2023-09-05soldstatus $115,000 Closed 432-char remark
Show marketing remark (432 chars)
Calling all investors. Charming 4-bedroom home for sale! This home features Granite Countertops, Hardwood Floors, washer & dryer hookups, and a beautiful large yard with a deck. Perfect for your long-term tenant to enjoy, with lots of newly improved features! Currently occupied with renters and professionally managed. Please do not disturb tenants. Text the agent for showing information and more details about the property.
-
2023-08-12status Pending 432-char remark
Show marketing remark (432 chars)
Calling all investors. Charming 4-bedroom home for sale! This home features Granite Countertops, Hardwood Floors, washer & dryer hookups, and a beautiful large yard with a deck. Perfect for your long-term tenant to enjoy, with lots of newly improved features! Currently occupied with renters and professionally managed. Please do not disturb tenants. Text the agent for showing information and more details about the property.
-
2023-08-05$112,000 Active 432-char remark
Show marketing remark (432 chars)
Calling all investors. Charming 4-bedroom home for sale! This home features Granite Countertops, Hardwood Floors, washer & dryer hookups, and a beautiful large yard with a deck. Perfect for your long-term tenant to enjoy, with lots of newly improved features! Currently occupied with renters and professionally managed. Please do not disturb tenants. Text the agent for showing information and more details about the property.
-
2009-12-28historical
-
2009-06-27$89,900
-
2008-06-12soldstatus $7,667
-
2008-05-12historical
-
2008-05-08historical
-
2008-05-07$7,490
-
2007-10-27$17,850
-
1999-05-12soldstatus $30,000
-
1999-04-30soldstatus $29,900
-
1999-03-05historical
-
1999-01-21$29,900
-
1998-06-30soldstatus $15,000
-
1998-06-18historical
-
1998-06-14$21,000
ⓘ Source: listings_history table (triggers on properties + properties_extension) + one-shot
backfill from property_details.listing_events for pre-trigger history.
Tax reassessment forecast OK · Resets to sale price
- Current annual tax
- $1,780 · $148/mo
- Projected year-2 tax
- $1,780 · $148/mo
- Expected delta
- $0/yr ($0/mo · 0.0%)
ⓘ Screening estimate from a state-policy table — verify with the county assessor before closing.
Climate risk First Street
- Flood 1/10 Low FEMA zone X (unshaded) · 0% chance over 30 yrs
- Wildfire 5/10 Major
- Heat 6/10 Major 7 d/yr ≥110°F today · 18 d/yr by 30 yrs out
- Wind 3/10 Moderate 4% chance of damaging wind over 30 yrs
- Air quality 2/10 Low 2 unhealthy d/yr today · 2 by 30 yrs out
Nearby sold comps map
Loading sold comps map…
Walkable amenities ~0.75 mi
Loading nearby amenities…
Taxation est. · year 1
- Rental income
- $15,432
- − Mortgage interest
- −$8,374
- − Property taxes
- −$1,780
- − Insurance
- −$748
- − Repairs & maintenance
- −$1,235
- − Management
- −$1,235
- − Depreciation
- −$4,349
- Taxable loss
- −$2,288
- Est. tax savings @ 24.0%
- +$549
- After-tax cash flow
- $805/yr
For passive investors: Depreciation is non-cash, so a rental often shows a tax loss while cash-flowing — sheltering income. Rental losses are passive: they offset passive income freely, and up to $25,000/yr can offset ordinary (W-2) income if you actively participate and your MAGI is under $100k (phasing out to $0 by $150k); unused losses carry forward. On sale, claimed depreciation is recaptured at up to 25%, and gains may owe capital-gains tax (a 1031 exchange can defer both). Figures are a year-1 estimate at your 24.0% rate — not tax advice; consult a CPA.
Schools (NCES district)
- District
- Tulsa
- NCES district ID
- 4030240
- Math proficiency
- 7% ▼ -9.00%
- Reading proficiency
- 12% ▼ -7.00%
- Median HH income
- $37,895
- Composite
- 8.04/100
- National rank
- #9919
- State rank
- #250 of 270 in OK
Livability — Tulsa
- Score
- 75/100
- State rank
- #13
- US rank
- #4058
Category grades
Schools grade is shown separately in the Schools card above.
Census & demographics
- Census place
- Tulsa, OK
- County
- Tulsa County · 640,811 people
- City population
- 389,418
- Metro
- Tulsa, OK
- Population (ZIP)
- 15,655
- Household income
- $40,776
- Rent vs Own
- Severe rent burden
- 1055.0
Population outlook (Tulsa County) Hauer SSP2
- Today (2025)
- 723,846 people
- By 2030
- 766,033 · +5.8%
- By 2040
- 851,386 · +17.6%
- By 2050
- 938,389 · +29.6%
- By 2075
- 1,166,011 · +61.1%
- By 2100
- 1,350,277 · +86.5%
Race, ethnicity, and origin ACS 2023
- Neighborhood character
- Diverse neighborhood (Simpson 0.65)
- Race & ethnicity
- Black 55% White 17% Hispanic / Latino 14% Two or more races 13% Native American 4%
- Hispanic origin (detail)
- Mexican 11%
- Common ancestry
- Romanian 1% Serbian 1% Lithuanian 1%
- Foreign-born
- 5% · Canada
- Languages at home
- 87% English-only · Spanish 10% German/W. Germanic 1%
Political lean MEDSL · Tulsa
- 2024 margin
- R (+15.2) · D 41.3% · R 56.5% · Other 2.2%
- 2008→2024 swing
- +9.2pp toward D · 2008: -24.5pp · 2024: -15.2pp
- All cycles
- 2024: R+15.2 2020: R+15.6 2016: R+22.9 2012: R+27.4 2008: R+24.5
Not yet ingested
- Civics
- —
Market trends
- HPI YoY
- ▼ -4.58%
- Current HPI
- 179.5268
- Rent YoY
- ▲ 3.54%
- Metro
- Tulsa, OK
- State GDP YoY
- ▲ 1.55%
- F500 in state
- 6
Industry mix (Fortune 500 HQ in OK)
| Industry | F500 HQs | Revenue |
|---|---|---|
| Energy | 3 | $48B |
|
||
Price history
+611.9% since first listed23 events — show timeline
- 2026-04-26 Pending — MLS Technology, Inc.
- 2026-04-14 Price Changed $149,500 MLS Technology, Inc.
- 2026-04-07 Relisted — MLS Technology, Inc.
- 2026-02-09 Pending — MLS Technology, Inc.
- 2026-01-21 Listed $150,000 MLS Technology, Inc.
- 2023-09-19 Sold (Public Records) $115,000 Public Records
- 2023-09-05 Sold (MLS) $115,000 MLS Technology, Inc.
- 2023-08-12 Pending — MLS Technology, Inc.
- 2023-08-05 Listed $112,000 MLS Technology, Inc.
- 2009-12-28 Listing Removed — MLS Technology, Inc.
- 2009-06-27 Listed $89,900 MLS Technology, Inc.
- 2008-06-12 Sold (MLS) $7,667 MLS Technology, Inc.
- 2008-05-12 Listing Removed — MLS Technology, Inc.
- 2008-05-08 Listing Removed — MLS Technology, Inc.
- 2008-05-07 Listed $7,490 MLS Technology, Inc.
- 2007-10-27 Listed $17,850 MLS Technology, Inc.
- 1999-05-12 Sold (Public Records) $30,000 Public Records
- 1999-04-30 Sold (MLS) $29,900 MLS Technology, Inc.
- 1999-03-05 Listing Removed — MLS Technology, Inc.
- 1999-01-21 Listed $29,900 MLS Technology, Inc.
- 1998-06-30 Sold (MLS) $15,000 MLS Technology, Inc.
- 1998-06-18 Listing Removed — MLS Technology, Inc.
- 1998-06-14 Listed $21,000 MLS Technology, Inc.
Property tax history
+18.3%/yrLatest (2025): $1,780 · +8.7% YoY. Source: county tax records.
Cash-flow waterfall
monthlySold comps — $/sqft
last 12 mo · ≤1 miLoading sold comps…