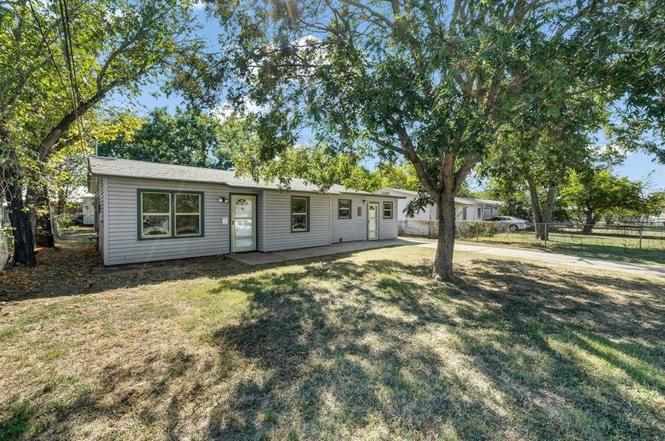
1404 SE 12th St · Mineral Wells, TX
Flood risk 1/10 · Minimal
- FEMA flood zone
- X (unshaded)
- Chance of flooding over 30 yrs
- 0.0%
- Est. flood insurance / yr
- $507 – $1,088
Fire risk 8/10 · Major
- Est. fire insurance / yr
- $1,222 – $2,270
Heat risk 7/10 · Major
- Hot days now (above 109°F)
- 7 days/yr
- Hot days in 30 yrs
- 23 days/yr
Wind risk 4/10 · Minor
- Chance of severe wind over 30 yrs
- 18.0%
Air-quality risk 2/10 · Minimal
- Unhealthy air days now
- 1 days/yr
- Unhealthy air days in 30 yrs
- 1 days/yr
Risk factors via First Street. Map © Google.
Why this score? — see what drove the C- grade
The composite is a weighted blend of 9 inputs, each scored 0–100. Each bar is that input's sub-score; the figure is the points it added to the 100-point composite (weight × sub-score).
- Cash flow +21.8/30.0
- ARV discount +7.6/15.0
- DSCR +7.0/10.0
- 1% rule +6.1/10.0
- Livability +3.6/5.0
- Rent growth +2.5/5.0
- Schools +2.5/10.0
- Condition / age +2.5/5.0
- Appreciation +0.0/10.0
$150,000
🖨 Deal sheet 📄 Offer letter ✓ Due diligence
Listing remarks MLS
3 bedroom 1 bath updated home ready to go. Granite countertops, new cabinets, new flooring, new paint. Recent Central HVAC ready to go.
Key facts
- Ample counter space
- Updated electrical
- Outdoor firepit
Tags
Neighborhood map
What this means for you Summary
Snapshot
- This is a 4-bed/1.0-bath single-family listed at $150k.
Deal economics
- At list price, monthly cash flow is $233 ($3k/yr) — positive.
- The deal already cash-flows at list — no discount required.
- Meets the 1% rule at list price ($2k rent vs $150k).
- Recommended offer: $148k (1.5% below list) — sets the bar for market timing.
- Cap rate 8.2% vs local median 2.7% in Mineral Wells — top-decile yield for the area; either an underpriced asset or a hidden risk that comps aren't pricing in. Stress-test before assuming the spread holds.
Location & tenants
- Location reads 72/100 on livability (#278 in TX) — a middle-class / working-renter tenant base. Strengths: cost of living A+, housing A+, health & safety A+; Watch: crime D+, employment D, schools F.
- Mineral Wells ISD (town): math 30% / reading 30% proficiency, ranked #636 of 826 in TX (top 77%) — families likely to look elsewhere, expect single-tenant / working-renter base with shorter leases.
- Market conditions: 277 active listings in the ZIP; 6 comparable units currently listed for rent nearby; rentals at typical pace (median 24d on market — plan ~3-4 weeks tenant-placement turnaround); 27 units permitted in Palo Pinto County in 2024 (0 in 5+ unit buildings).
- This rent runs 32% of the median local income ($62k/yr) — at the standard rent-burdened threshold; future hikes will face affordability resistance.
Forward outlook
- Local home prices are declining (-3.0%/yr); year-one equity from $1k of loan paydown is wiped out by about $4k of value loss. Plan a longer hold.
- Palo Pinto County population projected to shrink 8% by 2050 — rents likely to lag national; underwrite the cash flow, not the appreciation.
Negotiation context
- It's been on market 15 days — a 2% lower offer ($148k) is reasonable based on typical stale-listing flexibility.
- 8 sale attempts since 6y ago with the ask held roughly flat each time — persistent listings suggest the price (not the market) is what's stuck; bring a comps-based counter.
- Current owner paid $60k; list at $150k implies a 150% gain — meaningful room to come down on a strong offer.
Risks & watch-outs
- Watch-outs: built in 1950 — expect roof / HVAC / electrical / plumbing capex.
- Climate carrying-cost: severe wildfire risk; extreme-heat days projected 7→23/yr by 2055 (HVAC capex compounding) — expect insurance premiums to compound above CPI over the hold.
Questions for the listing agent
- Built in 1950 — when were the roof, HVAC, electrical panel, plumbing, and water heater last replaced?
- Is there a deadline driving the sale (1031 exchange, divorce, estate, relocation)? That informs how much negotiation room exists.
- Schools are F-rated, which usually means shorter tenancies and higher turnover. Who's the typical renter profile here, and what's been the actual vacancy rate?
- Crime grade is D in this area — have there been break-ins, vandalism, or insurance claims at this property in the last 3 years? What carrier currently insures it and at what premium?
- What's the average days-on-market for RENTAL listings here right now (not sales)? A rising rental-DOM trend means longer vacancies and softer asking-rent achievability than the comps imply.
- What's the recent tenant-quality profile in this submarket — average credit score on applications, eviction rate, late-payment / NSF rate, and stable-employment percentage? A property-management company in the area should have these aggregated.
- How much new for-sale + rental construction is in the pipeline within 1–3 miles? Heavy new supply typically softens prices + rents 12–24 months out; constrained supply supports both.
Investment metrics
- 1% rule
- 1.11% ✓
- Cap rate
- 8.16%
- Cash-on-cash
- 6.67%
- DSCR
- 1.30
- GRM
- 7.5
CMA / ARV
- ARV (on-the-fly)
- $150,234
- Comps found
- 12
Show comp detail 12 sales within ~0.75 mi
| Address | Dist | Beds/Ba | Sqft | Sold | Price | $/sf | Match |
|---|---|---|---|---|---|---|---|
| 1404 SE 12th St | 0.00mi | 4/1.0 | 1,022 (0%) | 1mo | $150,000 | $147 | 99 |
| 1405 SE 13th St | 0.02mi | 3/1.5 (-1) | 978 (-4%) | 7mo | $159,000 | $163 | 79 |
| 1405 SE 8 1/2 St | 0.22mi | 3/1.0 (-1) | 1,055 (+3%) | 6mo | $167,500 | $159 | 74 |
| 1616 SE Park Rd | 0.39mi | 3/1.0 (-1) | 1,034 (+1%) | 7mo | $119,000 | $115 | 69 |
| 1016 SE 3rd St | 0.58mi | 3/1.0 (-1) | 1,008 (-1%) | 7mo | $125,000 | $124 | 60 |
| 2108 SE 19th St | 0.55mi | 3/1.0 (-1) | 1,069 (+5%) | 2mo | $174,900 | $164 | 60 |
| 1007 SE 24th St | 0.62mi | 3/2.0 (-1) | 1,026 (+0%) | 4mo | $145,000 | $141 | 58 |
| 716 SE 7th Ave | 0.50mi | 3/1.0 (-1) | 1,050 (+3%) | 11mo | $149,900 | $143 | 58 |
| 1816 SE 18th St | 0.40mi | 3/1.0 (-1) | 1,111 (+9%) | 9mo | $119,900 | $108 | 54 |
| 1201 SE 11th Ave | 0.17mi | 3/1.5 (-1) | 1,160 (+14%) | 11mo | $62,500 | $54 | 53 |
| 812 SE 15th St | 0.34mi | 3/2.0 (-1) | 1,110 (+9%) | 10mo | $205,000 | $185 | 52 |
| 1705 11th St | 0.25mi | 3/2.0 (-1) | 1,173 (+15%) | 3mo | $205,000 | $175 | 52 |
Match score weights: distance 35% · size 25% · config 20% · recency 20%. Top-matched comps best support the ARV.
Projected returns pro-forma
-3.0% appreciation · 3.0% rent growth · sell at horizon
- IRR
- -6.0%
- Equity multiple
- 0.78×
- Total profit
- $-9,390
- Equity at exit
- $22,365
- IRR
- 3.7%
- Equity multiple
- 1.27×
- Total profit
- $11,183
- Equity at exit
- $12,969
Cash invested: $42,000 (down + closing). Projections, not guarantees.
Landlord ↔ Tenant lean methodology
- Overall (STATE)
- 87 Strongly Landlord-Friendly
- State Texas
- 87 Strongly Landlord-Friendly · R+5
- County
- — inherits STATE
- City
- — inherits STATE
ZIP-level market 76067
- Active inventory
- 277
- Price-to-rent
- 7.5×
Monthly cashflow live
- Estimated rent
- $1,669 high interval (Pro) →
- Mortgage (P&I)
- −$787
- Tax from tax record
- −$236 /mo · $2,833/yr
- Insurance
- −$62
- HOA
- −$0
- Vacancy / Maint / Mgmt
- −$351
- Net cashflow
- $233
Break-even live
UW: 25.0% down · 7.5% · 30yr · 1.5% tax · 5.0% vac · 8.0% maint · 8.0% mgmt
Financing live
Cash to close
- Down payment
- $37,500
- Closing costs
- $4,500
- Reserves months
- —
- Total cash needed
- —
Loan-product check · same deal, 3 products live
Conventional
25% down · 7.5% · 30yr
- Down + closing
- —
- Monthly P&I
- —
- Monthly cashflow
- —
- DSCR
- —
- Eligible?
- —
Personal DTI + credit; lowest rate.
DSCR
20% down · 8.5% · 30yr
- Down + closing
- —
- Monthly P&I
- —
- Monthly cashflow
- —
- DSCR
- —
- Eligible?
- —
No personal income docs; deal must DSCR.
Hard money
10% down · 12.0% · 12mo
- Down + closing
- —
- Monthly P&I
- —
- Monthly cashflow
- —
- DSCR
- —
- Eligible?
- —
Short-term bridge; refi at stabilization.
Rent comps 6 comps
| Address | Beds | Baths | Sqft | Rent | $/sqft | DOM | Units | Dist |
|---|---|---|---|---|---|---|---|---|
| 1106 SE 12th St Mineral Wells, TX | 3.0 | 2.0 | 1422 | $1,700 | $1.20 | 4d | 1 | 0.16mi |
| 1911 SE 14th St Mineral Wells, TX | 3.0 | 2.0 | 1256 | $1,600 | $1.27 | 24d | 1 | 0.34mi |
| 1912 SE 15th St Mineral Wells, TX | 3.0 | 1.5 | 1043 | $1,700 | $1.63 | 24d | 1 | 0.36mi |
| 3001 NE 2nd St Mineral Wells, TX | 1.0–3.0 | 1.0–2.0 | 909 | $1,200 | $1.32 | 1d | 10 | 1.20mi |
| 3116 SE Airport Rd Mineral Wells, TX | 4.0 | 2.0 | 1248 | $1,370 | $1.10 | 24d | 1 | 1.21mi |
| 5507 Racetrack Ln Mineral Wells, TX | 3.0 | 2.0 | 1216 | $1,360 | $1.12 | 24d | 1 | 1.22mi |
Listing history 19 events
-
2025-11-01status Pending
-
2025-10-30historical Active Option Contract
-
2025-10-15$150,000 Active
-
2024-03-26historical $1,395
-
2024-03-19$1,395
-
2024-03-16historical $1,395
-
2024-03-04$1,395
-
2024-02-28historical $1,395
-
2024-02-27status Active
-
2024-02-25$1,395
-
2024-02-20status Active
-
2024-02-17$169,300 Active
-
2020-12-15soldstatus
-
2020-12-11soldstatus Sold 135-char remark
Show marketing remark (135 chars)
3 bedroom 1 bath updated home ready to go. Granite countertops, new cabinets, new flooring, new paint. Recent Central HVAC ready to go.
-
2020-12-08status Pending 135-char remark
Show marketing remark (135 chars)
3 bedroom 1 bath updated home ready to go. Granite countertops, new cabinets, new flooring, new paint. Recent Central HVAC ready to go.
-
2020-11-30$109,900 Active 135-char remark
Show marketing remark (135 chars)
3 bedroom 1 bath updated home ready to go. Granite countertops, new cabinets, new flooring, new paint. Recent Central HVAC ready to go.
-
2020-10-20soldstatus $60,000
-
1997-05-05soldstatus
-
1994-06-13soldstatus
ⓘ Source: listings_history table (triggers on properties + properties_extension) + one-shot
backfill from property_details.listing_events for pre-trigger history.
Tax reassessment forecast TX · Resets to sale price
- Current annual tax
- $2,833 · $236/mo
- Projected year-2 tax
- $2,833 · $236/mo
- Expected delta
- $0/yr ($0/mo · 0.0%)
ⓘ Screening estimate from a state-policy table — verify with the county assessor before closing.
Climate risk First Street
- Flood 1/10 Low FEMA zone X (unshaded) · 0% chance over 30 yrs
- Wildfire 8/10 Severe
- Heat 7/10 Severe 7 d/yr ≥109°F today · 23 d/yr by 30 yrs out
- Wind 4/10 Moderate 18% chance of damaging wind over 30 yrs
- Air quality 2/10 Low 1 unhealthy d/yr today · 1 by 30 yrs out
Nearby sold comps map
Loading sold comps map…
Walkable amenities ~0.75 mi
Loading nearby amenities…
Taxation est. · year 1
- Rental income
- $20,029
- − Mortgage interest
- −$8,402
- − Property taxes
- −$2,833
- − Insurance
- −$750
- − Repairs & maintenance
- −$1,602
- − Management
- −$1,602
- − Depreciation
- −$4,364
- Taxable income
- $475
- Est. tax owed @ 24.0%
- −$114
- After-tax cash flow
- $2,686/yr
For passive investors: Depreciation is non-cash, so a rental often shows a tax loss while cash-flowing — sheltering income. Rental losses are passive: they offset passive income freely, and up to $25,000/yr can offset ordinary (W-2) income if you actively participate and your MAGI is under $100k (phasing out to $0 by $150k); unused losses carry forward. On sale, claimed depreciation is recaptured at up to 25%, and gains may owe capital-gains tax (a 1031 exchange can defer both). Figures are a year-1 estimate at your 24.0% rate — not tax advice; consult a CPA.
Schools (NCES district)
- District
- Mineral Wells ISD
- NCES district ID
- 4830950
- Math proficiency
- 30% ▼ -10.00%
- Reading proficiency
- 30% ▼ -5.00%
- Median HH income
- $40,027
- Composite
- 25.26/100
- National rank
- #7500
- State rank
- #636 of 826 in TX
Livability — Mineral Wells
- Score
- 72/100
- State rank
- #278
- US rank
- #6474
Category grades
Schools grade is shown separately in the Schools card above.
Census & demographics
- Census place
- Mineral Wells, TX
- County
- Palo Pinto County · 21,080 people
- City population
- 21,080
- Metro
- Mineral Wells, TX
- Population (ZIP)
- 21,080
- Household income
- $62,190
- Rent vs Own
- Severe rent burden
- 745.0
Population outlook (Palo Pinto County) Hauer SSP2
- Today (2025)
- 27,500 people
- By 2030
- 27,079 · -1.5%
- By 2040
- 26,135 · -5.0%
- By 2050
- 25,215 · -8.3%
- By 2075
- 23,416 · -14.9%
- By 2100
- 20,300 · -26.2%
Race, ethnicity, and origin ACS 2023
- Neighborhood character
- Predominantly White (70%)
- Race & ethnicity
- White 70% Hispanic / Latino 22% Two or more races 9% Black 4% Asian 1%
- Hispanic origin (detail)
- Mexican 19%
- Common ancestry
- Lithuanian 4% Italian 1% Slovak 1%
- Foreign-born
- 6% · Canada
- Languages at home
- 86% English-only · Spanish 13% Other Indo-European 1%
Political lean MEDSL · Palo Pinto
- 2024 margin
- Solid R (+67.1) · D 16.1% · R 83.2%
- 2008→2024 swing
- -18.9pp toward R · 2008: -48.2pp · 2024: -67.1pp
- All cycles
- 2024: R+67.1 2020: R+64.1 2016: R+64.1 2012: R+59.8 2008: R+48.2
Not yet ingested
- Civics
- —
Market trends
- HPI YoY
- ▼ -134.09%
- Current HPI
- 240.3647
- Rent YoY
- —
- Metro
- Mineral Wells, TX
- State GDP YoY
- ▲ 3.95%
- F500 in state
- 110
Industry mix (Fortune 500 HQ in TX)
| Industry | F500 HQs | Revenue |
|---|---|---|
| Energy | 16 | $1,198B |
|
||
| Technology | 5 | $198B |
|
||
| Engineering / Construction | 4 | $72B |
|
||
| Energy Services | 3 | $60B |
|
||
| Utilities | 3 | $41B |
|
||
| Healthcare | 2 | $330B |
|
||
Price history
+150.0% since first listed19 events — show timeline
- 2025-11-01 Pending — NTREIS
- 2025-10-30 Contingent — NTREIS
- 2025-10-15 Listed $150,000 NTREIS
- 2024-03-26 Rental Removed $1,395 Avail
- 2024-03-19 Listed for Rent $1,395 Avail
- 2024-03-16 Rental Removed $1,395 NTREIS
- 2024-03-04 Listed for Rent $1,395 NTREIS
- 2024-02-28 Rental Removed $1,395 NTREIS
- 2024-02-27 Relisted — NTREIS
- 2024-02-25 Listed for Rent $1,395 NTREIS
- 2024-02-20 Relisted — NTREIS
- 2024-02-17 Listed $169,300 NTREIS
- 2020-12-15 Sold (Public Records) — Public Records
- 2020-12-11 Sold (MLS) — NTREIS
- 2020-12-08 Pending — NTREIS
- 2020-11-30 Listed $109,900 NTREIS
- 2020-10-20 Sold (Public Records) $60,000 Public Records
- 1997-05-05 Sold (Public Records) — Public Records
- 1994-06-13 Sold (Public Records) — Public Records
Property tax history
+12.2%/yrLatest (2025): $2,833 · +14.8% YoY. Source: county tax records.
Cash-flow waterfall
monthlySold comps — $/sqft
last 12 mo · ≤1 miLoading sold comps…