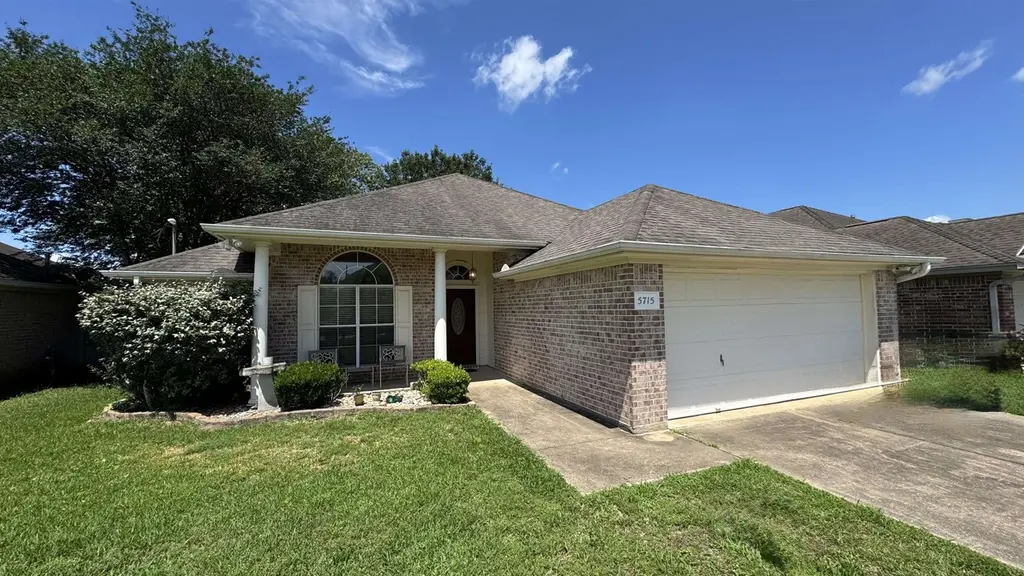
5715 Emily Ln · Beaumont, TX
Flood risk 7/10 · Major
- FEMA flood zone
- X
- Chance of flooding over 30 yrs
- 0.99%
- Est. flood insurance / yr
- $507 – $1,088
Fire risk 5/10 · Moderate
- Est. fire insurance / yr
- $1,222 – $2,270
Heat risk 9/10 · Severe
- Hot days now (above 111°F)
- 7 days/yr
- Hot days in 30 yrs
- 25 days/yr
Wind risk 9/10 · Severe
- Chance of severe wind over 30 yrs
- 99.0%
Air-quality risk 2/10 · Minimal
- Unhealthy air days now
- 1 days/yr
- Unhealthy air days in 30 yrs
- 1 days/yr
Risk factors via First Street. Map © Google.
Why this score? — see what drove the D+ grade
The composite is a weighted blend of 9 inputs, each scored 0–100. Each bar is that input's sub-score; the figure is the points it added to the 100-point composite (weight × sub-score).
- ARV discount +15.0/15.0
- Cash flow +14.6/30.0
- 1% rule +4.8/10.0
- DSCR +4.5/10.0
- Livability +3.2/5.0
- Rent growth +2.7/5.0
- Condition / age +2.5/5.0
- Schools +1.5/10.0
- Appreciation +0.0/10.0
$224,900
🖨 Deal sheet 📄 Offer letter ✓ Due diligence
Listing remarks
This charming home is now available. Featuring a spacious master suite with separate tub and shower plus his and her closets, this well kept home offers comfort and convenience throughout. High ceilings and a cozy gas lit fireplace create an inviting atmosphere in the living areas, while a bright sunroom off the living room provides the perfect spot for relaxation or entertaining. Additional highlights include a 2 car garage, a dedicated storage building, and a low maintenance small backyard. With wallpaper throughout adding character and style, this move in ready home is ideal for families seeking value and functionality in a desirable location. ????????????????????????????????????????????
Key facts
- Master suite
- His and her closets
- Gas lit fireplace
Tags
Property features AI
Exterior
- Parking: Attached 2-car garage
- Utilities: Public water; Public sewer
- Home design: Residential single-family home; Single story
- Construction: Brick veneer and frame construction; Composition roof; Slab foundation
- Exterior features: Composition roof; Brick veneer and frame construction; Slab foundation
Interior
- Kitchen: Dishwasher; Range
- Flooring: Tile
- Bathrooms: 2 full bathrooms; 1 half bathroom
- Heating & cooling: Central heating (natural gas); Central air; Ceiling fans
- Interior features: Pantry; Gas log fireplace; Therapeutic whirlpool; Storage
Neighborhood map
What this means for you Summary
Snapshot
- This is a 4-bed/2.5-bath single-family listed at $225k.
Deal economics
- At list price, monthly cash flow is $-12 ($-140/yr) — negative.
- To cash-flow at today's rent, offer at most $223k (0.9% below list).
- To meet the 1% rule (rent ≥ 1% of price), the offer needs to be $220k (2.3% below list).
- Recommended offer: $220k (2.3% below list) — sets the bar for 1% rule.
- Cap rate 6.6% vs local median 5.3% in Beaumont — meaningfully above typical; check what's discounted (condition, days-on-market, listing class) to confirm the premium yield is real.
Location & tenants
- Location reads 64/100 on livability (#739 in TX) — a middle-class / working-renter tenant base. Strengths: cost of living A+, housing A+, health & safety A+; Watch: employment D, schools D-, crime F.
- Beaumont ISD (urban): math 14% / reading 22% proficiency, ranked #789 of 826 in TX (top 96%) — low school quality limits family demand, transient renter base, plan for 1-2y turnover; 69% free/reduced lunch — lower-income household profile, screen leases tightly.
- Market conditions: Rents flat; 285 active listings in the ZIP; 6 comparable units currently listed for rent nearby; rentals at typical pace (median 21d on market — plan ~3-4 weeks tenant-placement turnaround); solid renter incomes; 343 units permitted in Jefferson County in 2024 (0 in 5+ unit buildings).
Forward outlook
- Local home prices are declining (-3.0%/yr); year-one equity from $2k of loan paydown is wiped out by about $7k of value loss. Plan a longer hold.
Negotiation context
- It's been on market 28 days — a 2% lower offer ($222k) is reasonable based on typical stale-listing flexibility.
Risks & watch-outs
- Watch-outs: flood insurance adds $66/mo.
- Climate carrying-cost: major flood risk; severe wind risk, 99% chance of damaging wind over 30y; moderate wildfire risk; extreme-heat days projected 7→25/yr by 2055 (HVAC capex compounding) — expect insurance premiums to compound above CPI over the hold.
Questions for the listing agent
- What do current leases actually rent for vs. the listed asking? Can we see a recent rent roll and the last 12 months of T-12 income?
- What's the actual annual flood-insurance premium (NFIP or private), and is the property in a SFHA with mandatory coverage?
- Is there a deadline driving the sale (1031 exchange, divorce, estate, relocation)? That informs how much negotiation room exists.
- Schools are D-rated, which usually means shorter tenancies and higher turnover. Who's the typical renter profile here, and what's been the actual vacancy rate?
- Crime grade is F in this area — have there been break-ins, vandalism, or insurance claims at this property in the last 3 years? What carrier currently insures it and at what premium?
- The area grade is low — what's the realistic commute time and amenity access for the typical tenant pool here? Any planned neighborhood developments (good or bad) we should know about?
- What's the average days-on-market for RENTAL listings here right now (not sales)? A rising rental-DOM trend means longer vacancies and softer asking-rent achievability than the comps imply.
- What's the recent tenant-quality profile in this submarket — average credit score on applications, eviction rate, late-payment / NSF rate, and stable-employment percentage? A property-management company in the area should have these aggregated.
- How much new for-sale + rental construction is in the pipeline within 1–3 miles? Heavy new supply typically softens prices + rents 12–24 months out; constrained supply supports both.
Investment metrics
- 1% rule
- 0.98% ✗
- Cap rate
- 6.59%
- Cash-on-cash
- 1.04%
- DSCR
- 1.05
- GRM
- 8.5
CMA / ARV
- ARV (on-the-fly)
- $311,040
- Comps found
- 12
Show comp detail 12 sales within ~0.75 mi
| Address | Dist | Beds/Ba | Sqft | Sold | Price | $/sf | Match |
|---|---|---|---|---|---|---|---|
| 8385 Vaquero Dr | 0.39mi | 4/2.0 | 2,034 (+6%) | 1mo | $345,000 | $170 | 69 |
| 5620 Essie Ln | 0.28mi | 3/3.0 (-1) | 2,000 (+4%) | 10mo | $344,900 | $172 | 65 |
| 5780 Kathy Ln | 0.16mi | 3/2.0 (-1) | 1,739 (-9%) | 14mo | $234,900 | $135 | 58 |
| 8075 Sheila Ln | 0.33mi | 4/3.0 | 2,100 (+9%) | 14mo | $339,900 | $162 | 55 |
| 6220 Windcrest Dr | 0.43mi | 4/3.0 | 2,041 (+6%) | 15mo | $306,990 | $150 | 55 |
| 7815 Windcastle Dr | 0.41mi | 4/2.0 | 2,035 (+6%) | 18mo | $296,990 | $146 | 54 |
| 7855 Windcastle Dr | 0.40mi | 4/2.0 | 1,796 (-6%) | 20mo | $281,990 | $157 | 52 |
| 6230 Windcrest Dr | 0.45mi | 4/2.0 | 2,031 (+6%) | 19mo | $297,990 | $147 | 52 |
| 8580 Sana Dr | 0.58mi | 3/2.5 (-1) | 1,981 (+3%) | 14mo | $340,732 | $172 | 51 |
| 7820 Windcastle Dr | 0.45mi | 4/2.0 | 1,796 (-6%) | 19mo | $284,620 | $158 | 51 |
| 8575 Sana Dr | 0.56mi | 3/2.5 (-1) | 2,080 (+8%) | 16mo | $363,515 | $175 | 42 |
| 8590 Sana Dr | 0.59mi | 3/2.5 (-1) | 2,115 (+10%) | 13mo | $363,800 | $172 | 40 |
Match score weights: distance 35% · size 25% · config 20% · recency 20%. Top-matched comps best support the ARV.
Projected returns pro-forma
-3.0% appreciation · 0.79% rent growth · sell at horizon
- IRR
- -19.4%
- Equity multiple
- 0.34×
- Total profit
- $-41,815
- Equity at exit
- $33,533
- IRR
- -18.3%
- Equity multiple
- 0.12×
- Total profit
- $-55,521
- Equity at exit
- $19,445
Cash invested: $62,972 (down + closing). Projections, not guarantees.
Landlord ↔ Tenant lean methodology
- Overall (STATE)
- 87 Strongly Landlord-Friendly
- State Texas
- 87 Strongly Landlord-Friendly · R+5
- County
- — inherits STATE
- City
- — inherits STATE
ZIP-level market 77713
- Home prices YoY
- -19.3%
- Rents YoY
- 0.8%
- Active inventory
- 285
- Price-to-rent
- 8.5×
Monthly cashflow live
- Estimated rent
- $2,198 high interval (Pro) →
- Mortgage (P&I)
- −$1,179
- Tax from tax record
- −$408 /mo · $4,902/yr
- Insurance
- −$94
- Flood insurance flood zone
- −$66 /mo · $798/yr
- HOA
- −$0
- Vacancy / Maint / Mgmt
- −$462
- Net cashflow
- $-12
Break-even live
UW: 25.0% down · 7.5% · 30yr · 1.5% tax · 5.0% vac · 8.0% maint · 8.0% mgmt
Financing live
Cash to close
- Down payment
- $56,225
- Closing costs
- $6,747
- Reserves months
- —
- Total cash needed
- —
Loan-product check · same deal, 3 products live
Conventional
25% down · 7.5% · 30yr
- Down + closing
- —
- Monthly P&I
- —
- Monthly cashflow
- —
- DSCR
- —
- Eligible?
- —
Personal DTI + credit; lowest rate.
DSCR
20% down · 8.5% · 30yr
- Down + closing
- —
- Monthly P&I
- —
- Monthly cashflow
- —
- DSCR
- —
- Eligible?
- —
No personal income docs; deal must DSCR.
Hard money
10% down · 12.0% · 12mo
- Down + closing
- —
- Monthly P&I
- —
- Monthly cashflow
- —
- DSCR
- —
- Eligible?
- —
Short-term bridge; refi at stabilization.
Rent comps 6 comps
| Address | Beds | Baths | Sqft | Rent | $/sqft | DOM | Units | Dist |
|---|---|---|---|---|---|---|---|---|
| 5745 Kathy Ln Beaumont, TX | 4.0 | 2.0 | 1934 | $2,485 | $1.28 | 23d | 1 | 0.19mi |
| 5750 N Major Dr Beaumont, TX | 1.0–3.0 | 1.0–2.0 | 941 | $1,659 | $1.76 | 13d | 1 | 0.69mi |
| 5585 Scenic Dr Beaumont, TX | 3.0 | 2.0 | 1451 | $1,800 | $1.24 | 43d | 1 | 0.71mi |
| 3945 Cheryl St Beaumont, TX | 3.0 | 2.0 | 1955 | $2,095 | $1.07 | 13d | 1 | 0.93mi |
| 3980 N Major Dr Beaumont, TX | 1.0–3.0 | 1.0–2.0 | 957 | $1,518 | $1.59 | 13d | 1 | 1.08mi |
| 6715 Riplee St Beaumont, TX | 4.0 | 2.0 | 1817 | $2,550 | $1.40 | 21d | 1 | 1.33mi |
Listing history 18 events
-
2026-06-18status $224,900 Pending 28 DOM
-
2026-06-18days on market $224,900 Active 28 DOM
-
2026-06-17days on market $224,900 Active 27 DOM
-
2026-06-16days on market $224,900 Active 26 DOM
-
2026-06-15days on market $224,900 Active 25 DOM
-
2026-06-14days on market $224,900 Active 23 DOM
-
2026-06-13days on market $224,900 Active 22 DOM
-
2026-06-10days on market $224,900 Active 20 DOM
-
2026-06-09days on market $224,900 Active 19 DOM
-
2026-06-08days on market $224,900 Active 18 DOM
-
2026-06-07days on market $224,900 Active 17 DOM
-
2026-06-03days on market $224,900 Active 13 DOM
-
2026-06-02days on market $224,900 Active 12 DOM
-
2026-06-01days on market $224,900 Active 11 DOM
-
2026-05-31days on market $224,900 Active 10 DOM
-
2026-05-30days on market $224,900 Active 9 DOM
-
2026-05-22$224,900 Active
-
2020-07-07soldstatus
ⓘ Source: listings_history table (triggers on properties + properties_extension) + one-shot
backfill from property_details.listing_events for pre-trigger history.
Tax reassessment forecast TX · Resets to sale price
- Current annual tax
- $4,902 · $408/mo
- Projected year-2 tax
- $4,902 · $408/mo
- Expected delta
- $0/yr ($0/mo · 0.0%)
ⓘ Screening estimate from a state-policy table — verify with the county assessor before closing.
Climate risk First Street
- Flood 7/10 Severe FEMA zone X · 99% chance over 30 yrs
- Wildfire 5/10 Major
- Heat 9/10 Extreme 7 d/yr ≥111°F today · 25 d/yr by 30 yrs out
- Wind 9/10 Extreme 99% chance of damaging wind over 30 yrs
- Air quality 2/10 Low 1 unhealthy d/yr today · 1 by 30 yrs out
Nearby sold comps map
Loading sold comps map…
Walkable amenities ~0.75 mi
Loading nearby amenities…
Taxation est. · year 1
- Rental income
- $26,376
- − Mortgage interest
- −$12,598
- − Property taxes
- −$4,902
- − Insurance
- −$1,922
- − Repairs & maintenance
- −$2,110
- − Management
- −$2,110
- − Depreciation
- −$6,543
- Taxable loss
- −$3,809
- Est. tax savings @ 24.0%
- +$914
- After-tax cash flow
- $774/yr
For passive investors: Depreciation is non-cash, so a rental often shows a tax loss while cash-flowing — sheltering income. Rental losses are passive: they offset passive income freely, and up to $25,000/yr can offset ordinary (W-2) income if you actively participate and your MAGI is under $100k (phasing out to $0 by $150k); unused losses carry forward. On sale, claimed depreciation is recaptured at up to 25%, and gains may owe capital-gains tax (a 1031 exchange can defer both). Figures are a year-1 estimate at your 24.0% rate — not tax advice; consult a CPA.
Schools (NCES district)
- District
- Beaumont ISD
- NCES district ID
- 4809670
- Math proficiency
- 14% ▼ -13.00%
- Reading proficiency
- 22% ▼ -7.00%
- Median HH income
- $41,683
- Composite
- 15.43/100
- National rank
- #9316
- State rank
- #789 of 826 in TX
Livability — Beaumont
- Score
- 64/100
- State rank
- #739
- US rank
- #13710
Category grades
Schools grade is shown separately in the Schools card above.
Census & demographics
- Census place
- Beaumont, TX
- County
- Jefferson County · 203,592 people
- City population
- 125,901
- Metro
- Beaumont-Port Arthur, TX
- Population (ZIP)
- 15,541
- Household income
- $91,330
- Rent vs Own
- Severe rent burden
- 444.0
Population outlook (Jefferson County) Hauer SSP2
- Today (2025)
- 259,015 people
- By 2030
- 260,685 · +0.6%
- By 2040
- 263,309 · +1.7%
- By 2050
- 265,237 · +2.4%
- By 2075
- 270,193 · +4.3%
- By 2100
- 255,628 · -1.3%
Race, ethnicity, and origin ACS 2023
- Neighborhood character
- Diverse neighborhood (Simpson 0.68)
- Race & ethnicity
- White 46% Black 25% Hispanic / Latino 22% Two or more races 16% Asian 3%
- Hispanic origin (detail)
- Mexican 18%
- Common ancestry
- Lithuanian 6% Serbian 2% Italian 1%
- Foreign-born
- 10% · Canada
- Languages at home
- 81% English-only · Spanish 16% Tagalog/Filipino 1% Other Asian/Pacific 1%
Political lean MEDSL · Jefferson
- 2024 margin
- Lean R (+8.9) · D 45.1% · R 54.0%
- 2008→2024 swing
- -11.1pp toward R · 2008: 2.2pp · 2024: -8.9pp
- All cycles
- 2024: R+8.9 2020: R+1.6 2016: R+0.5 2012: D+1.6 2008: D+2.2
Not yet ingested
- Civics
- —
Market trends
- HPI YoY
- ▼ -41.58%
- Current HPI
- 173.8851
- Rent YoY
- ▲ 0.79%
- Metro
- Beaumont-Port Arthur, TX
- State GDP YoY
- ▲ 3.95%
- F500 in state
- 110
Industry mix (Fortune 500 HQ in TX)
| Industry | F500 HQs | Revenue |
|---|---|---|
| Energy | 16 | $1,198B |
|
||
| Technology | 5 | $198B |
|
||
| Engineering / Construction | 4 | $72B |
|
||
| Energy Services | 3 | $60B |
|
||
| Utilities | 3 | $41B |
|
||
| Healthcare | 2 | $330B |
|
||
Price history
2 events — show timeline
- 2026-05-22 Listed $224,900 BBOR
- 2020-07-07 Sold (Public Records) — Public Records
Property tax history
+1.6%/yrLatest (2025): $4,902 · -0.8% YoY. Source: county tax records.
Cash-flow waterfall
monthlySold comps — $/sqft
last 12 mo · ≤1 miLoading sold comps…