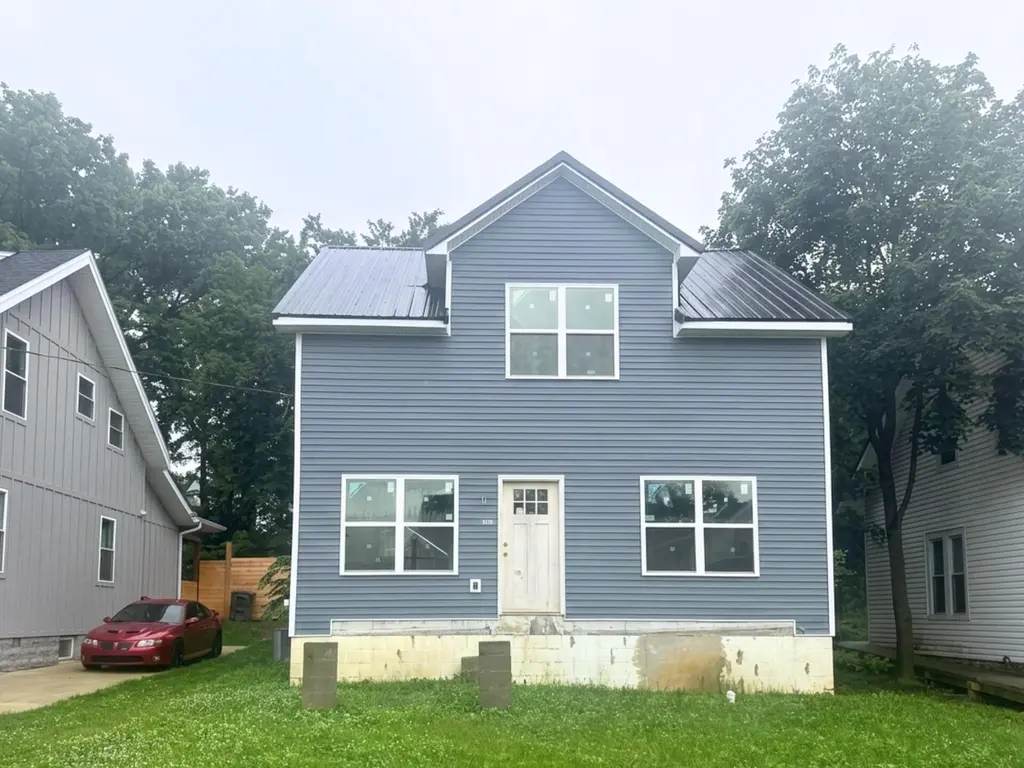
310 W Hickman St · Winchester, KY
Flood risk 5/10 · Moderate
- FEMA flood zone
- X (unshaded)
- Chance of flooding over 30 yrs
- 0.67%
- Est. flood insurance / yr
- $473 – $860
Fire risk 3/10 · Minor
- Est. fire insurance / yr
- $839 – $1,559
Heat risk 4/10 · Minor
- Hot days now (above 101°F)
- 7 days/yr
- Hot days in 30 yrs
- 19 days/yr
Wind risk 2/10 · Minimal
- Chance of severe wind over 30 yrs
- 3.0%
Air-quality risk 2/10 · Minimal
- Unhealthy air days now
- 0 days/yr
- Unhealthy air days in 30 yrs
- 1 days/yr
Risk factors via First Street. Map © Google.
Why this score? — see what drove the B- grade
The composite is a weighted blend of 9 inputs, each scored 0–100. Each bar is that input's sub-score; the figure is the points it added to the 100-point composite (weight × sub-score).
- Cash flow +30.0/30.0
- 1% rule +10.0/10.0
- DSCR +10.0/10.0
- ARV discount +7.5/15.0
- Schools +3.0/10.0
- Livability +3.0/5.0
- Rent growth +2.5/5.0
- Condition / age +2.5/5.0
- Appreciation +0.0/10.0
$109,900
🖨 Deal sheet (PDF) 📄 Offer letter ✓ Due diligence
Listing remarks
Opportunity knocks for the buyer with vision! This spacious 4-bedroom, 2.5-bath home is mid renovation and is well on its way to becoming something truly special. With a first-floor primary suite, walk-in closets, partial basement with sump pump already installed, many major systems already in place, and a storage shed in the backyard, many of the big-ticket features are done for you. The home is currently unfinished, with flooring, wall finishes, the kitchen, and the bathrooms still needing completion, gives you the rare chance to customize the final touches to your own style and preferences. The heavy lifting has already begun - now it's your opportunity to bring the project across the fi
Key facts
- Partial basement
- Walk-in closets
- Storage shed
Tags
Property features AI
Exterior
- Parking: Off-street parking
- Utilities: Public sewer; Public water
- Home design: House; Two levels
- Construction: Vinyl siding; Metal roof; Concrete perimeter foundation; Built area approximately 1,391 total
- Exterior features: Partial fencing; Shed(s) on the property; Public water
Interior
- Kitchen: No appliances listed
- Bedrooms: Primary bedroom on the first floor
- Bathrooms: 2 full bathrooms; 1 half bathroom
- Heating & cooling: Heat pump; Central air; Multi-unit cooling
- Interior features: Primary bedroom on the first floor; Walk-in closet(s); 9 total rooms; Unfinished basement with interior entry and sump pump; No fireplace
- Laundry & utility: Washer/dryer not specified
Neighborhood map
What this means for you Summary
Snapshot
- This is a 4-bed/2.5-bath other listed at $110k.
Deal economics
- At list price, monthly cash flow is $572 ($7k/yr) — positive.
- The deal already cash-flows at list — no discount required.
- Meets the 1% rule at list price ($2k rent vs $110k).
- Recommended offer: $108k (1.5% below list) — sets the bar for market timing.
- Cap rate 12.5% vs local median 4.0% in Winchester — top-decile yield for the area; either an underpriced asset or a hidden risk that comps aren't pricing in. Stress-test before assuming the spread holds.
Location & tenants
- Location reads 60/100 on livability (#393 in KY) — a middle-class / working-renter tenant base. Strengths: cost of living A+, housing A+; Watch: amenities F, commute F, employment F.
- Clark County (town): math 28% / reading 41% proficiency, ranked #64 of 165 in KY (top 39%) — families likely to look elsewhere, expect single-tenant / working-renter base with shorter leases.
- Zoned schools: Willis H. Justice Elementary School (math 27% / reading 27%, grade F, #434 of 676 statewide, top 69%, 427 students, 66% FRL); Robert D. Campbell Jr. High (math 28% / reading 47%, grade F, #73 of 217 statewide, top 36%, 820 students, 57% FRL); George Rogers Clark High School (math 28% / reading 34%, grade F, #118 of 254 statewide, top 47%, 1,645 students, 53% FRL).
- Market conditions: 291 active listings in the ZIP; 5 comparable units currently listed for rent nearby; rentals at typical pace (median 16d on market — plan ~3-4 weeks tenant-placement turnaround); 160 units permitted in Clark County in 2024 (61 in 5+ unit buildings).
- This rent runs 32% of the median local income ($64k/yr) — at the standard rent-burdened threshold; future hikes will face affordability resistance.
Forward outlook
- Local home prices are declining (-3.0%/yr); year-one equity from $760 of loan paydown is wiped out by about $3k of value loss. Plan a longer hold.
- Clark County population projected to shrink 7% by 2050 — rents likely to lag national; underwrite the cash flow, not the appreciation.
- At projected returns (-3.0% appreciation + 3.0% rent growth), your $31k cash investment doubles in ~6 years — after that, you're playing with house money.
Negotiation context
- It's been on market 18 days — a 2% lower offer ($108k) is reasonable based on typical stale-listing flexibility.
- 6 sale attempts since 20y ago with the ask held roughly flat each time — persistent listings suggest the price (not the market) is what's stuck; bring a comps-based counter.
Risks & watch-outs
- Watch-outs: built in 1940 — expect roof / HVAC / electrical / plumbing capex.
- Climate carrying-cost: moderate flood risk — expect insurance premiums to compound above CPI over the hold.
Questions for the listing agent
- Built in 1940 — when were the roof, HVAC, electrical panel, plumbing, and water heater last replaced?
- Is there a deadline driving the sale (1031 exchange, divorce, estate, relocation)? That informs how much negotiation room exists.
- Schools are D-rated, which usually means shorter tenancies and higher turnover. Who's the typical renter profile here, and what's been the actual vacancy rate?
- What's the average days-on-market for RENTAL listings here right now (not sales)? A rising rental-DOM trend means longer vacancies and softer asking-rent achievability than the comps imply.
- What's the recent tenant-quality profile in this submarket — average credit score on applications, eviction rate, late-payment / NSF rate, and stable-employment percentage? A property-management company in the area should have these aggregated.
- How much new for-sale + rental construction is in the pipeline within 1–3 miles? Heavy new supply typically softens prices + rents 12–24 months out; constrained supply supports both.
Investment metrics
- 1% rule
- 1.54% ✓
- Cap rate
- 12.53%
- Cash-on-cash
- 22.29%
- DSCR
- 1.99
- GRM
- 5.4
CMA / ARV
No comps found within radius.
Projected returns pro-forma
-3.0% appreciation · 3.0% rent growth · sell at horizon
- IRR
- 15.1%
- Equity multiple
- 1.61×
- Total profit
- $18,623
- Equity at exit
- $16,386
- IRR
- 23.8%
- Equity multiple
- 3.05×
- Total profit
- $63,207
- Equity at exit
- $9,502
Cash invested: $30,772 (down + closing). Projections, not guarantees.
Landlord ↔ Tenant lean methodology
- Overall (STATE)
- 83 Strongly Landlord-Friendly
- State Kentucky
- 83 Strongly Landlord-Friendly · R+16
- County
- — inherits STATE
- City
- — inherits STATE
ZIP-level market 40391
- Home prices YoY
- -17.0%
- Active inventory
- 291
- Price-to-rent
- 5.4×
Monthly cashflow live
- Estimated rent
- $1,691 high interval (Pro) →
- Mortgage (P&I)
- −$576
- Tax from tax record
- −$142 /mo · $1,703/yr
- Insurance
- −$46
- HOA
- −$0
- Vacancy / Maint / Mgmt
- −$355
- Net cashflow
- $572
Break-even live
Sensitivity live
| Price | -10% $634 | -5% $603 | +0% $572 | +5% $540 | +10% $509 |
|---|---|---|---|---|---|
| Rent | -10% $438 | -5% $505 | +0% $572 | +5% $638 | +10% $705 |
| Rate | -1.0pp $627 | -0.5pp $600 | base $572 | +0.5pp $543 | +1.0pp $514 |
UW: 25.0% down · 7.5% · 30yr · 1.5% tax · 5.0% vac · 8.0% maint · 8.0% mgmt
Financing live
Cash to close
- Down payment
- $27,475
- Closing costs
- $3,297
- Reserves months
- —
- Total cash needed
- —
Loan-product check · same deal, 3 products live
Conventional
25% down · 7.5% · 30yr
- Down + closing
- —
- Monthly P&I
- —
- Monthly cashflow
- —
- DSCR
- —
- Eligible?
- —
Personal DTI + credit; lowest rate.
DSCR
20% down · 8.5% · 30yr
- Down + closing
- —
- Monthly P&I
- —
- Monthly cashflow
- —
- DSCR
- —
- Eligible?
- —
No personal income docs; deal must DSCR.
Hard money
10% down · 12.0% · 12mo
- Down + closing
- —
- Monthly P&I
- —
- Monthly cashflow
- —
- DSCR
- —
- Eligible?
- —
Short-term bridge; refi at stabilization.
Rent comps 5 comps
| Address | Beds | Baths | Sqft | Rent | $/sqft | DOM | Units | Dist |
|---|---|---|---|---|---|---|---|---|
| 161 Milwood Dr Unit Na Winchester, KY | 3.0 | 2.0 | 1750 | $1,650 | $0.94 | 15d | 1 | 0.26mi |
| 308 Graves St Winchester, KY | 3.0 | 1.5 | 1670 | $1,549 | $0.93 | 25d | 1 | 0.36mi |
| 502 Evans St Unit 3 Winchester, KY | 3.0 | 1.0 | 1200 | $1,400 | $1.17 | 25d | 1 | 0.58mi |
| 135 Winn Ave Unit A Winchester, KY | 3.0 | 2.0 | 1600 | $1,800 | $1.12 | 15d | 1 | 0.89mi |
| 1419 Westwood Dr Winchester, KY | 3.0 | 2.5 | 1255 | $1,450 | $1.16 | 15d | 1 | 1.43mi |
Listing history 13 events
-
2026-06-21days on market $109,900 Active 18 DOM
-
2026-06-18days on market $109,900 Active 15 DOM
-
2026-06-17days on market $109,900 Active 14 DOM
-
2026-06-16days on market $109,900 Active 13 DOM
-
2026-06-15days on market $109,900 Active 12 DOM
-
2026-06-14days on market $109,900 Active 10 DOM
-
2026-06-13days on market $109,900 Active 9 DOM
-
2026-06-10days on market $109,900 Active 7 DOM
-
2026-06-09days on market $109,900 Active 6 DOM
-
2026-06-08days on market $109,900 Active 5 DOM
-
2026-06-07days on market $109,900 Active 4 DOM
-
2026-06-05remarks 699-char remark
-
2026-06-05$109,900 Active 1 DOM
ⓘ Source: listings_history table (triggers on properties + properties_extension) + one-shot
backfill from property_details.listing_events for pre-trigger history.
Tax reassessment forecast KY · Resets to sale price
- Current annual tax
- $1,703 · $142/mo
- Projected year-2 tax
- $1,703 · $142/mo
- Expected delta
- $0/yr ($0/mo · 0.0%)
ⓘ Screening estimate from a state-policy table — verify with the county assessor before closing.
Climate risk First Street
- Flood 5/10 Major FEMA zone X (unshaded) · 67% chance over 30 yrs
- Wildfire 3/10 Moderate
- Heat 4/10 Moderate 7 d/yr ≥101°F today · 19 d/yr by 30 yrs out
- Wind 2/10 Low 3% chance of damaging wind over 30 yrs
- Air quality 2/10 Low 0 unhealthy d/yr today · 1 by 30 yrs out
Nearby sold comps map
Loading sold comps map…
Walkable amenities ~0.75 mi
Loading nearby amenities…
Taxation est. · year 1
- Rental income
- $20,288
- − Mortgage interest
- −$6,156
- − Property taxes
- −$1,703
- − Insurance
- −$550
- − Repairs & maintenance
- −$1,623
- − Management
- −$1,623
- − Depreciation
- −$3,197
- Taxable income
- $5,436
- Est. tax owed @ 24.0%
- −$1,305
- After-tax cash flow
- $5,554/yr
For passive investors: Depreciation is non-cash, so a rental often shows a tax loss while cash-flowing — sheltering income. Rental losses are passive: they offset passive income freely, and up to $25,000/yr can offset ordinary (W-2) income if you actively participate and your MAGI is under $100k (phasing out to $0 by $150k); unused losses carry forward. On sale, claimed depreciation is recaptured at up to 25%, and gains may owe capital-gains tax (a 1031 exchange can defer both). Figures are a year-1 estimate at your 24.0% rate — not tax advice; consult a CPA.
Schools (NCES district)
- District
- Clark County
- NCES district ID
- 2101200
- Math proficiency
- 28% ▼ -25.00%
- Reading proficiency
- 41% ▼ -18.00%
- Median HH income
- $47,282
- Composite
- 29.63/100
- National rank
- #6469
- State rank
- #64 of 165 in KY
Livability — Winchester
- Score
- 60/100
- State rank
- #393
- US rank
- #18931
Category grades
Schools grade is shown separately in the Schools card above.
Census & demographics
- Census place
- Winchester, KY
- County
- Clark County · 36,796 people
- City population
- 36,796
- Metro
- Lexington-Fayette, KY
- Population (ZIP)
- 36,796
- Household income
- $64,144
- Rent vs Own
- Severe rent burden
- 854.0
Population outlook (Clark County) Hauer SSP2
- Today (2025)
- 35,849 people
- By 2030
- 35,616 · -0.6%
- By 2040
- 34,727 · -3.1%
- By 2050
- 33,195 · -7.4%
- By 2075
- 29,439 · -17.9%
- By 2100
- 24,744 · -31.0%
Race, ethnicity, and origin ACS 2023
- Neighborhood character
- Predominantly White (88%)
- Race & ethnicity
- White 88% Black 4% Hispanic / Latino 4% Two or more races 3%
- Common ancestry
- Slovak 3% Italian 2% Serbian 2%
- Foreign-born
- 2% · Canada
- Languages at home
- 97% English-only · Spanish 2%
Political lean MEDSL · Clark
- 2024 margin
- Solid R (+35.3) · D 31.6% · R 66.9% · Other 1.6%
- 2008→2024 swing
- -10.3pp toward R · 2008: -25.1pp · 2024: -35.3pp
- All cycles
- 2024: R+35.3 2020: R+32.0 2016: R+37.1 2012: R+30.5 2008: R+25.1
Not yet ingested
- Civics
- —
Market trends
- HPI YoY
- ▼ -58.24%
- Current HPI
- 283.7839
- Rent YoY
- —
- Metro
- Lexington-Fayette, KY
- State GDP YoY
- ▲ 1.81%
- F500 in state
- 4
Industry mix (Fortune 500 HQ in KY)
| Industry | F500 HQs | Revenue |
|---|---|---|
| Healthcare | 1 | $118B |
|
||
| Food / Beverage | 1 | $7B |
|
||
Price history
+70.5% since first listed20 events — show timeline
- 2026-06-03 Listed $109,900 ImagineMLS
- 2024-05-31 Listing Removed — ImagineMLS
- 2023-11-24 Listed $200,000 ImagineMLS
- 2023-03-01 Listing Removed — ImagineMLS
- 2022-12-12 Price Changed $209,000 ImagineMLS
- 2022-09-29 Listed $225,000 ImagineMLS
- 2020-03-02 Sold (MLS) $176,000 ImagineMLS
- 2020-01-27 Pending — ImagineMLS
- 2020-01-14 Price Changed $169,900 ImagineMLS
- 2019-11-19 Price Changed $174,900 ImagineMLS
- 2019-10-19 Price Changed $179,900 ImagineMLS
- 2019-09-25 Listed $189,900 ImagineMLS
- 2019-05-24 Sold (Public Records) $35,000 Public Records
- 2019-05-24 Sold (MLS) $35,000 ImagineMLS
- 2019-05-06 Pending — ImagineMLS
- 2019-04-28 Listed $38,900 ImagineMLS
- 2006-04-13 Sold (Public Records) $56,000 Public Records
- 2006-04-13 Sold (MLS) $56,000 ImagineMLS
- 2006-03-13 Listing Removed — ImagineMLS
- 2006-01-02 Listed $64,450 ImagineMLS
Property tax history
+9.7%/yrLatest (2025): $1,703 · +33.5% YoY. Source: county tax records.
Cash-flow waterfall
monthlySold comps — $/sqft
last 12 mo · ≤1 miLoading sold comps…