 Multi-family
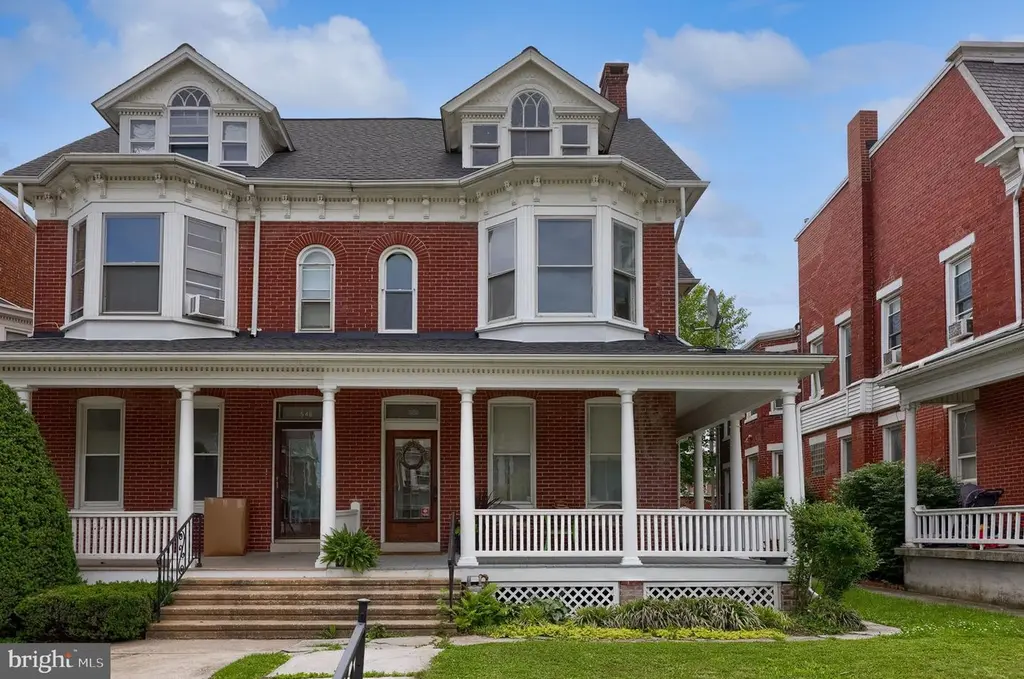
550 Madison Ave · York, PA
Flood risk 1/10 · Minimal
- FEMA flood zone
- X (unshaded)
- Chance of flooding over 30 yrs
- 0.0%
- Est. flood insurance / yr
- $473 – $860
Fire risk 1/10 · Minimal
- Est. fire insurance / yr
- $511 – $949
Heat risk 6/10 · Moderate
- Hot days now (above 103°F)
- 7 days/yr
- Hot days in 30 yrs
- 15 days/yr
Wind risk 4/10 · Minor
- Chance of severe wind over 30 yrs
- 12.0%
Air-quality risk 3/10 · Minor
- Unhealthy air days now
- 3 days/yr
- Unhealthy air days in 30 yrs
- 5 days/yr
Risk factors via First Street. Map © Google.
Why this score? — see what drove the C grade
The composite is a weighted blend of 9 inputs, each scored 0–100. Each bar is that input's sub-score; the figure is the points it added to the 100-point composite (weight × sub-score).
- Cash flow +26.6/30.0
- DSCR +9.1/10.0
- 1% rule +7.2/10.0
- Rent growth +4.1/5.0
- Livability +3.8/5.0
- Condition / age +2.5/5.0
- ARV discount +1.0/15.0
- Schools +0.8/10.0
- Appreciation +0.0/10.0
$236,900
🖨 Deal sheet 📄 Offer letter ✓ Due diligence
Multi-family units
County records classify this as Multi-Family (2-4 Unit). Listing-text estimate: 1 unit. estimate disagrees with records
Listing remarks MLS
2 unit investment opportunity on the Avenues. Great location! Solid brick multifamily home with a first floor and second floor apartment. Live in one and rent the other! The first floor apartment has 2 bedrooms, living room, and kitchen. The apartment has a rear door that walks out to the back yard. The second floor apartment has 4 bedrooms and a balcony off of the kitchen. Hardwood floors throughout! Detached garage in the rear. There are washer/dryer hookups in the basements for tenants to have access to. Agents please read agent remarks. Please call for a private tour!
Key facts
- 4,356 sq ft lot
- 2 garage spots
- Built 1900
Property features AI
Finance
- Financial info: Two-unit building with one unit leased and one unit vacant; Total actual rent reported: $28,440; Existing leases are month-to-month
Exterior
- Parking: Detached garage (rear entry) with 2 spaces
- Utilities: Public water; Public sewer; Electric hot water; Municipal trash service
- Home design: End of row townhouse; Fee simple ownership; Estimated year built
- Construction: Brick and stone construction; Rubber and slate roof; Other foundation
- Exterior features: No tidal water
Interior
- Bedrooms: One 2-bedroom unit; One 3-bedroom unit
- Flooring: Hardwood; Luxury vinyl plank
- Heating & cooling: Radiator heating (natural gas); Window air conditioning units (electric)
- Interior features: Wood floors; Hardwood and luxury vinyl plank flooring; Full poured concrete basement
- Laundry & utility: Laundry located in the basement
Neighborhood map
What this means for you Summary
Snapshot
- This is a 6-bed/2.0-bath multifamily listed at $237k.
Deal economics
- At list price, monthly cash flow is $637 ($8k/yr) — positive.
- The deal already cash-flows at list — no discount required.
- Meets the 1% rule at list price ($3k rent vs $237k).
- Cap rate 9.5% vs local median 5.0% in York — top-decile yield for the area; either an underpriced asset or a hidden risk that comps aren't pricing in. Stress-test before assuming the spread holds.
Location & tenants
- Location reads 75/100 on livability (#427 in PA, #3,987 nationally) — a middle-class / working-renter tenant base. Strengths: cost of living A+, health & safety A+, housing A; Watch: amenities D+, crime F, employment F.
- York City SD (urban): math 4% / reading 16% proficiency, ranked #534 of 539 in PA (top 99%) — low school quality limits family demand, transient renter base, plan for 1-2y turnover; 72% free/reduced lunch — lower-income household profile, screen leases tightly.
- Market conditions: Rents rising fast (+6.4%/yr); 249 active listings in the ZIP; 1 comparable units currently listed for rent nearby; solid renter incomes; 1,328 units permitted in York County in 2024 (338 in 5+ unit buildings).
- This rent runs 44% of the median local income ($79k/yr) — at the standard rent-burdened threshold; future hikes will face affordability resistance.
Forward outlook
- Local home prices are declining (-3.0%/yr); year-one equity from $2k of loan paydown is wiped out by about $7k of value loss. Plan a longer hold.
- At projected returns (-3.0% appreciation + 6.4% rent growth), your $66k cash investment doubles in ~8 years — after that, you're playing with house money.
Negotiation context
- Only 5 days on market — expect competitive offers; lowballing is unlikely to land.
- 2 sale attempts since 5y ago; this cycle's ask is 69% above the opening price — seller raised mid-cycle; expect resistance to lowballs.
- Current owner paid $132k; list at $237k implies a 79% gain — meaningful room to come down on a strong offer.
Risks & watch-outs
- Watch-outs: built in 1900 — expect roof / HVAC / electrical / plumbing capex.
- Climate carrying-cost: extreme-heat days projected 7→15/yr by 2055 (HVAC capex compounding) — expect insurance premiums to compound above CPI over the hold.
Questions for the listing agent
- Built in 1900 — when were the roof, HVAC, electrical panel, plumbing, and water heater last replaced?
- Is there a deadline driving the sale (1031 exchange, divorce, estate, relocation)? That informs how much negotiation room exists.
- Crime grade is F in this area — have there been break-ins, vandalism, or insurance claims at this property in the last 3 years? What carrier currently insures it and at what premium?
- What's the average days-on-market for RENTAL listings here right now (not sales)? A rising rental-DOM trend means longer vacancies and softer asking-rent achievability than the comps imply.
- What's the recent tenant-quality profile in this submarket — average credit score on applications, eviction rate, late-payment / NSF rate, and stable-employment percentage? A property-management company in the area should have these aggregated.
- How much new apartment / multifamily construction is in the pipeline within 1–3 miles? Heavy new supply (>2% of stock underway) typically softens rents 12–24 months out; light construction supports rent growth.
Investment metrics
- 1% rule
- 1.22% ✓
- Cap rate
- 9.52%
- Cash-on-cash
- 11.53%
- DSCR
- 1.51
- GRM
- 6.8
CMA / ARV
- ARV (on-the-fly)
- $206,904
- Comps found
- 12
Show comp detail 12 sales within ~0.75 mi
| Address | Dist | Beds/Ba | Sqft | Sold | Price | $/sf | Match |
|---|---|---|---|---|---|---|---|
| 526 W Philadelphia St | 0.34mi | 7/— (+1) | 2,896 (+4%) | 2mo | $200,000 | $69 | 71 |
| 19 Carlisle Ave | 0.39mi | 5/2.0 (-1) | 2,754 (-2%) | 4mo | $250,000 | $91 | 71 |
| 449 Park St | 0.27mi | 5/— (-1) | 2,911 (+4%) | 7mo | $130,000 | $45 | 70 |
| 659 Madison Ave | 0.17mi | 5/2.0 (-1) | 2,899 (+4%) | 17mo | $190,000 | $66 | 67 |
| 742 Madison Ave | 0.25mi | 5/2.0 (-1) | 2,628 (-6%) | 9mo | $227,500 | $87 | 66 |
| 746 W Philadelphia St | 0.34mi | 7/— (+1) | 2,764 (-1%) | 14mo | $170,000 | $62 | 66 |
| 569 W Philadelphia St | 0.29mi | 5/— (-1) | 2,540 (-9%) | 8mo | $255,000 | $100 | 60 |
| 339 W Philadelphia St | 0.53mi | 6/2.0 | 2,522 (-10%) | 6mo | $180,000 | $71 | 54 |
| 804 Pennsylvania Ave | 0.30mi | 5/— (-1) | 2,520 (-10%) | 18mo | $210,000 | $83 | 50 |
| 202 N Penn St | 0.41mi | 5/2.5 (-1) | 2,508 (-10%) | 11mo | $186,500 | $74 | 47 |
| 456-1/2 W Princess St | 0.66mi | 5/— (-1) | 2,565 (-8%) | 10mo | $130,000 | $51 | 42 |
| 668 W King St | 0.51mi | 7/3.0 (+1) | 2,429 (-13%) | 18mo | $240,000 | $99 | 30 |
Match score weights: distance 35% · size 25% · config 20% · recency 20%. Top-matched comps best support the ARV.
Projected returns pro-forma
-3.0% appreciation · 6.38% rent growth · sell at horizon
- IRR
- 4.7%
- Equity multiple
- 1.19×
- Total profit
- $12,413
- Equity at exit
- $35,323
- IRR
- 17.1%
- Equity multiple
- 2.63×
- Total profit
- $107,987
- Equity at exit
- $20,483
Cash invested: $66,332 (down + closing). Projections, not guarantees.
Landlord ↔ Tenant lean methodology
- Overall (STATE)
- 62 Landlord-Friendly
- State Pennsylvania
- 62 Landlord-Friendly · EVEN
- County
- — inherits STATE
- City
- — inherits STATE
ZIP-level market 17404
- Rents YoY
- 6.4%
- Active inventory
- 249
- Price-to-rent
- 14.6×
Monthly cashflow live
- Estimated rent
- $2,891 high interval (Pro) →
- Mortgage (P&I)
- −$1,242
- Tax from tax record
- −$306 /mo · $3,667/yr
- Insurance
- −$99
- HOA
- −$0
- Vacancy / Maint / Mgmt
- −$607
- Net cashflow
- $637
Break-even live
2-unit breakdown (identical units grouped — click to expand)
| Units | Beds | Baths | Est. rent |
|---|---|---|---|
| 1× unit | 2 | 1 | $1,352 |
| 1× unit | 4 | 1 | $1,539 |
| Total (2 units) | $2,891 | ||
UW: 25.0% down · 7.5% · 30yr · 1.5% tax · 5.0% vac · 8.0% maint · 8.0% mgmt
Financing live
Cash to close
- Down payment
- $59,225
- Closing costs
- $7,107
- Reserves months
- —
- Total cash needed
- —
Loan-product check · same deal, 3 products live
Conventional
25% down · 7.5% · 30yr
- Down + closing
- —
- Monthly P&I
- —
- Monthly cashflow
- —
- DSCR
- —
- Eligible?
- —
Personal DTI + credit; lowest rate.
DSCR
20% down · 8.5% · 30yr
- Down + closing
- —
- Monthly P&I
- —
- Monthly cashflow
- —
- DSCR
- —
- Eligible?
- —
No personal income docs; deal must DSCR.
Hard money
10% down · 12.0% · 12mo
- Down + closing
- —
- Monthly P&I
- —
- Monthly cashflow
- —
- DSCR
- —
- Eligible?
- —
Short-term bridge; refi at stabilization.
Rent comps 1 comps
| Address | Beds | Baths | Sqft | Rent | $/sqft | DOM | Units | Dist |
|---|---|---|---|---|---|---|---|---|
| 26 N West St York, PA | 6.0 | 2.0 | 2100 | $2,200 | $1.05 | 21d | 1 | 0.38mi |
Listing history 6 events
-
2026-06-09status $236,900 Pending 5 DOM
-
2026-06-08days on market $236,900 Active 5 DOM
-
2026-06-07statusdays on market $236,900 Active 4 DOM
-
2026-06-03days on market $236,900 Coming Soon 2 DOM
-
2026-06-02remarks 693-char remark
-
2026-06-02$236,900 Coming Soon 1 DOM
ⓘ Source: listings_history table (triggers on properties + properties_extension) + one-shot
backfill from property_details.listing_events for pre-trigger history.
Tax reassessment forecast PA · Partial reset (capped growth)
- Current annual tax
- $3,667 · $306/mo
- Projected year-2 tax
- $3,705 · $309/mo
- Expected delta
- +$38/yr (+$3/mo · 1.0%)
ⓘ Screening estimate from a state-policy table — verify with the county assessor before closing.
Climate risk First Street
- Flood 1/10 Low FEMA zone X (unshaded) · 0% chance over 30 yrs
- Wildfire 1/10 Low
- Heat 6/10 Major 7 d/yr ≥103°F today · 15 d/yr by 30 yrs out
- Wind 4/10 Moderate 12% chance of damaging wind over 30 yrs
- Air quality 3/10 Moderate 3 unhealthy d/yr today · 5 by 30 yrs out
Nearby sold comps map
Loading sold comps map…
Walkable amenities ~0.75 mi
Loading nearby amenities…
Taxation est. · year 1
- Rental income
- $34,692
- − Mortgage interest
- −$13,270
- − Property taxes
- −$3,667
- − Insurance
- −$1,184
- − Repairs & maintenance
- −$2,775
- − Management
- −$2,775
- − Depreciation
- −$6,892
- Taxable income
- $4,128
- Est. tax owed @ 24.0%
- −$991
- After-tax cash flow
- $6,656/yr
For passive investors: Depreciation is non-cash, so a rental often shows a tax loss while cash-flowing — sheltering income. Rental losses are passive: they offset passive income freely, and up to $25,000/yr can offset ordinary (W-2) income if you actively participate and your MAGI is under $100k (phasing out to $0 by $150k); unused losses carry forward. On sale, claimed depreciation is recaptured at up to 25%, and gains may owe capital-gains tax (a 1031 exchange can defer both). Figures are a year-1 estimate at your 24.0% rate — not tax advice; consult a CPA.
Schools (NCES district)
- District
- York City SD
- NCES district ID
- 4226820
- Math proficiency
- 4% ▼ -7.00%
- Reading proficiency
- 16% ▼ -9.00%
- Median HH income
- $29,470
- Composite
- 7.61/100
- National rank
- #9943
- State rank
- #534 of 539 in PA
Livability — York
- Score
- 75/100
- State rank
- #427
- US rank
- #3987
Category grades
Schools grade is shown separately in the Schools card above.
Census & demographics
- Census place
- York, PA
- County
- York County · 278,806 people
- City population
- 184,764
- Metro
- York-Hanover, PA
- Population (ZIP)
- 39,374
- Household income
- $78,506
- Rent vs Own
- Severe rent burden
- 722.0
Population outlook (York County) Hauer SSP2
- Today (2025)
- 454,205 people
- By 2030
- 457,407 · +0.7%
- By 2040
- 457,529 · +0.7%
- By 2050
- 448,261 · -1.3%
- By 2075
- 427,388 · -5.9%
- By 2100
- 384,218 · -15.4%
Race, ethnicity, and origin ACS 2023
- Neighborhood character
- Majority White (65%)
- Race & ethnicity
- White 65% Hispanic / Latino 19% Black 12% Two or more races 8%
- Hispanic origin (detail)
- Mexican 2% Puerto Rican 9% Dominican 4%
- Common ancestry
- Romanian 2% Slovak 2% Lithuanian 1%
- Foreign-born
- 6% · Canada, Vietnam
- Languages at home
- 85% English-only · Spanish 12% Russian/Polish/Slavic 1%
Political lean MEDSL · York
- 2024 margin
- Strong R (+25.3) · D 36.9% · R 62.1%
- 2008→2024 swing
- -11.7pp toward R · 2008: -13.6pp · 2024: -25.3pp
- All cycles
- 2024: R+25.3 2020: R+24.6 2016: R+29.3 2012: R+21.2 2008: R+13.6
Not yet ingested
- Civics
- —
Market trends
- HPI YoY
- ▼ -135.44%
- Current HPI
- 237.5683
- Rent YoY
- ▲ 6.38%
- Metro
- York-Hanover, PA
- State GDP YoY
- ▲ 1.68%
- F500 in state
- 34
Industry mix (Fortune 500 HQ in PA)
| Industry | F500 HQs | Revenue |
|---|---|---|
| Healthcare | 2 | $309B |
|
||
| Insurance | 2 | $27B |
|
||
| Telecommunications / Media | 1 | $124B |
|
||
| Industrial Distribution | 1 | $22B |
|
||
| Financial Services | 1 | $20B |
|
||
| Chemicals / Materials | 1 | $18B |
|
||
Price history
+69.3% since first listed8 events — show timeline
- 2026-06-02 Coming Soon $236,900 BRIGHT MLS
- 2021-10-18 Sold (Public Records) $132,500 Public Records
- 2021-10-15 Sold (MLS) $132,500 BRIGHT MLS
- 2021-10-15 Sold (MLS) $132,500 BRIGHT MLS
- 2021-07-03 Pending — BRIGHT MLS
- 2021-07-03 Pending — BRIGHT MLS
- 2021-06-17 Listed $139,900 BRIGHT MLS
- 2021-06-17 Listed $139,900 BRIGHT MLS
Property tax history
-2.8%/yrLatest (2025): $3,667 · +0.9% YoY. Source: county tax records.
Cash-flow waterfall
monthlySold comps — $/sqft
last 12 mo · ≤1 miLoading sold comps…