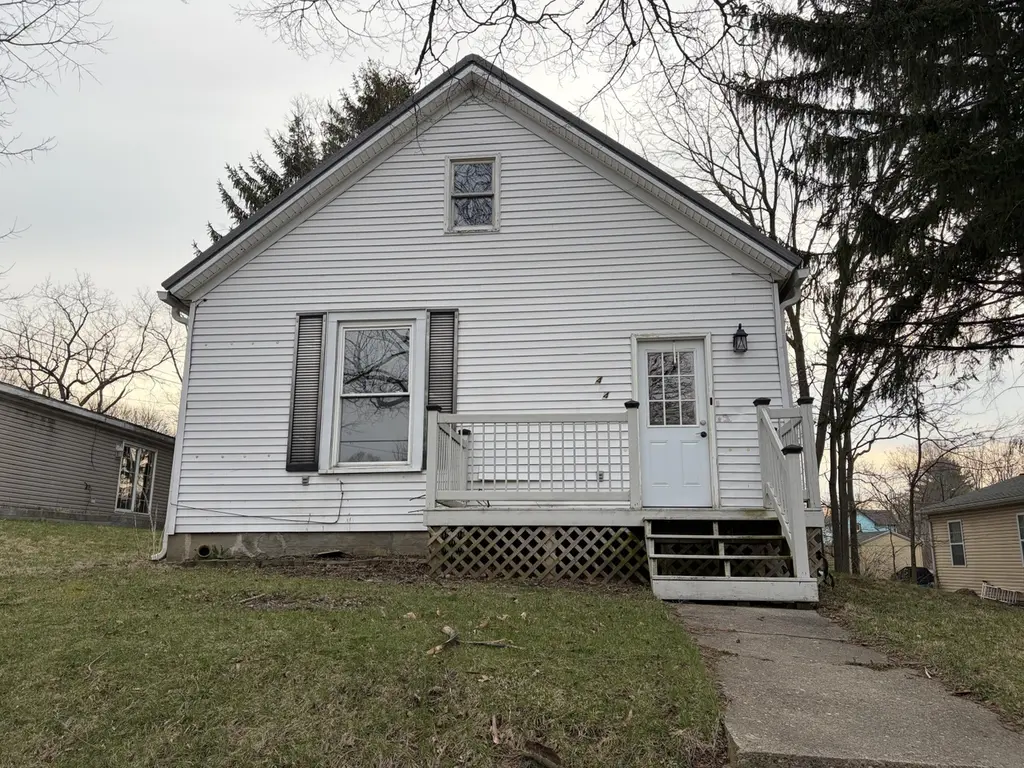
404 N Troy St · Bellefontaine, OH
Flood risk 1/10 · Minimal
- FEMA flood zone
- X (unshaded)
- Chance of flooding over 30 yrs
- 0.0%
- Est. flood insurance / yr
- $473 – $860
Fire risk 1/10 · Minimal
- Est. fire insurance / yr
- $713 – $1,323
Heat risk 3/10 · Minor
- Hot days now (above 98°F)
- 7 days/yr
- Hot days in 30 yrs
- 18 days/yr
Wind risk 2/10 · Minimal
- Chance of severe wind over 30 yrs
- —
Air-quality risk 2/10 · Minimal
- Unhealthy air days now
- 1 days/yr
- Unhealthy air days in 30 yrs
- 2 days/yr
Risk factors via First Street. Map © Google.
Why this score? — see what drove the B- grade
The composite is a weighted blend of 9 inputs, each scored 0–100. Each bar is that input's sub-score; the figure is the points it added to the 100-point composite (weight × sub-score).
- Cash flow +24.7/30.0
- ARV discount +15.0/15.0
- DSCR +8.0/10.0
- 1% rule +6.1/10.0
- Schools +4.8/10.0
- Livability +3.8/5.0
- Rent growth +2.5/5.0
- Condition / age +2.5/5.0
- Appreciation +0.0/10.0
$110,000
🖨 Deal sheet 📄 Offer letter ✓ Due diligence
Listing remarks MLS
Opportunity knocks in Bellefontaine! This 404 N Troy St property, priced at just $136,000, is the perfect chance for investors, flippers, or first-time buyers ready to build equity. Featuring solid bones and plenty of potential, this home offers a blank canvas to update, renovate, and make your own. Conveniently located near downtown, parks, and local amenities, it's ideal for a rental, flip, or affordable starter home. With comparable homes in the area selling at higher price points, this is a value-add opportunity you don't want to miss. Bring your vision and unlock the potential!
Key facts
- 0.26 acre lot
- Built 1930
- Listed 71 days
Neighborhood map
What this means for you Summary
Snapshot
- This is a 3-bed/1.0-bath single-family listed at $110k.
Deal economics
- At list price, monthly cash flow is $230 ($3k/yr) — positive.
- The deal already cash-flows at list — no discount required.
- Meets the 1% rule at list price ($1k rent vs $110k).
- Recommended offer: $103k (6.0% below list) — sets the bar for market timing.
- Cap rate 8.8% vs local median 3.6% in Bellefontaine — top-decile yield for the area; either an underpriced asset or a hidden risk that comps aren't pricing in. Stress-test before assuming the spread holds.
Location & tenants
- Location reads 76/100 on livability (#213 in OH, #3,316 nationally) — a middle-class / working-renter tenant base. Strengths: crime A+, cost of living A+, housing A+; Watch: employment D+, amenities F, commute F.
- Bellefontaine City (town): math 55% / reading 59% proficiency, ranked #348 of 656 in OH (top 53%) — acceptable for families but not a draw, mixed tenant base, ~2y average lease.
- Market conditions: 152 active listings in the ZIP; 3 comparable units currently listed for rent nearby; rentals lingering (median 44d on market — plan ~5-8 weeks vacancy on turnover, expect pricing pressure); 67% of comp listings sitting > 30 days — soft ceiling on asking rent; 121 units permitted in Logan County in 2024 (0 in 5+ unit buildings).
Forward outlook
- Local home prices are declining (-3.0%/yr); year-one equity from $761 of loan paydown is wiped out by about $3k of value loss. Plan a longer hold.
- Logan County population projected at -15% by 2050 — secular population decline; favor cash flow + early exit over multi-decade hold.
Negotiation context
- It's been on market 71 days — a 6% lower offer ($103k) is reasonable based on typical stale-listing flexibility.
- 6 sale attempts since 13y ago; this cycle's ask has dropped $26k (19%) from the opening price — seller is motivated, your offer sets the floor, not the list.
Risks & watch-outs
- Watch-outs: built in 1930 — expect roof / HVAC / electrical / plumbing capex.
Questions for the listing agent
- It's been on market 71 days. Have you received any prior offers? Is the seller open to a 6% concession, seller financing, or rate buy-down credit?
- Built in 1930 — when were the roof, HVAC, electrical panel, plumbing, and water heater last replaced?
- Why hasn't it sold? Are there any deal-killer items the seller is aware of (foundation, flood, title, zoning, code violations)?
- Is there a deadline driving the sale (1031 exchange, divorce, estate, relocation)? That informs how much negotiation room exists.
- What's the average days-on-market for RENTAL listings here right now (not sales)? A rising rental-DOM trend means longer vacancies and softer asking-rent achievability than the comps imply.
- What's the recent tenant-quality profile in this submarket — average credit score on applications, eviction rate, late-payment / NSF rate, and stable-employment percentage? A property-management company in the area should have these aggregated.
- How much new for-sale + rental construction is in the pipeline within 1–3 miles? Heavy new supply typically softens prices + rents 12–24 months out; constrained supply supports both.
Investment metrics
- 1% rule
- 1.11% ✓
- Cap rate
- 8.80%
- Cash-on-cash
- 8.96%
- DSCR
- 1.40
- GRM
- 7.5
CMA / ARV
- ARV (median comp)
- $165,172
- List price
- $110,000
- Delta
- -33.40%
- Verdict
- UNDERPRICED
- Comps
- 20 within 1.0 mi
Show comp detail 12 sales within ~0.75 mi
| Address | Dist | Beds/Ba | Sqft | Sold | Price | $/sf | Match |
|---|---|---|---|---|---|---|---|
| 825 W Williams Ave | 0.07mi | 3/1.0 | 1,186 (+0%) | 6mo | $165,000 | $139 | 91 |
| 417 N West St | 0.07mi | 3/1.0 | 1,288 (+9%) | 2mo | $175,000 | $136 | 81 |
| 320 Walker St | 0.33mi | 3/2.0 | 1,264 (+7%) | 2mo | $165,000 | $131 | 68 |
| 641 N Detroit St | 0.65mi | 3/1.0 | 1,231 (+4%) | 1mo | $172,000 | $140 | 62 |
| 541 W Columbus Ave | 0.40mi | 3/2.0 | 1,300 (+10%) | 1mo | $185,000 | $142 | 60 |
| 304 Kennedy St | 0.47mi | 3/1.0 | 1,264 (+7%) | 9mo | $175,000 | $138 | 59 |
| 524 N Elm St | 0.53mi | 3/1.0 | 1,269 (+7%) | 6mo | $137,500 | $108 | 58 |
| 1121 W Sandusky Ave | 0.31mi | 2/1.0 (-1) | 1,008 (-15%) | 2mo | $226,000 | $224 | 54 |
| 317 N Elm St | 0.49mi | 4/1.0 (+1) | 1,311 (+11%) | 1mo | $60,000 | $46 | 53 |
| 120 Pratt St | 0.47mi | 3/1.5 | 1,355 (+15%) | 3mo | $189,900 | $140 | 50 |
| 526 W Chillicothe Ave | 0.47mi | 2/1.0 (-1) | 1,016 (-14%) | 1mo | $187,500 | $185 | 49 |
| 704 N Detroit St | 0.70mi | 4/2.0 (+1) | 1,226 (+4%) | 10mo | $237,000 | $193 | 44 |
Match score weights: distance 35% · size 25% · config 20% · recency 20%. Top-matched comps best support the ARV.
Projected returns pro-forma
-3.0% appreciation · 3.0% rent growth · sell at horizon
- IRR
- -2.7%
- Equity multiple
- 0.90×
- Total profit
- $-3,172
- Equity at exit
- $16,401
- IRR
- 7.0%
- Equity multiple
- 1.52×
- Total profit
- $16,109
- Equity at exit
- $9,511
Cash invested: $30,800 (down + closing). Projections, not guarantees.
Landlord ↔ Tenant lean methodology
- Overall (STATE)
- 73 Landlord-Friendly
- State Ohio
- 73 Landlord-Friendly · R+6
- County
- — inherits STATE
- City
- — inherits STATE
ZIP-level market 43311
- Active inventory
- 152
- Price-to-rent
- 7.5×
Monthly cashflow live
- Estimated rent
- $1,217 medium interval (Pro) →
- Mortgage (P&I)
- −$577
- Tax from tax record
- −$109 /mo · $1,308/yr
- Insurance
- −$46
- HOA
- −$0
- Vacancy / Maint / Mgmt
- −$256
- Net cashflow
- $230
Break-even live
UW: 25.0% down · 7.5% · 30yr · 1.5% tax · 5.0% vac · 8.0% maint · 8.0% mgmt
Financing live
Cash to close
- Down payment
- $27,500
- Closing costs
- $3,300
- Reserves months
- —
- Total cash needed
- —
Loan-product check · same deal, 3 products live
Conventional
25% down · 7.5% · 30yr
- Down + closing
- —
- Monthly P&I
- —
- Monthly cashflow
- —
- DSCR
- —
- Eligible?
- —
Personal DTI + credit; lowest rate.
DSCR
20% down · 8.5% · 30yr
- Down + closing
- —
- Monthly P&I
- —
- Monthly cashflow
- —
- DSCR
- —
- Eligible?
- —
No personal income docs; deal must DSCR.
Hard money
10% down · 12.0% · 12mo
- Down + closing
- —
- Monthly P&I
- —
- Monthly cashflow
- —
- DSCR
- —
- Eligible?
- —
Short-term bridge; refi at stabilization.
Rent comps 3 comps
| Address | Beds | Baths | Sqft | Rent | $/sqft | DOM | Units | Dist |
|---|---|---|---|---|---|---|---|---|
| 904 N Main St Bellefontaine, OH | 2.0 | 1.0 | 850 | $1,171 | $1.38 | 43d | 1 | 0.88mi |
| 904 N Main St Unit 5 Bellefontaine, OH | 2.0 | 1.0 | 850 | $1,171 | $1.38 | 43d | 1 | 0.88mi |
| 649 S Main St Bellefontaine, OH | 2.0 | 1.5 | 808 | $1,349 | $1.67 | 1d | 1 | 1.19mi |
Listing history 25 events
-
2026-06-03status $110,000 Pending 71 DOM
-
2026-06-02days on market $110,000 Contingency - Finance and Inspections 71 DOM
-
2026-06-01days on market $110,000 Contingency - Finance and Inspections 70 DOM
-
2026-05-31days on market $110,000 Contingency - Finance and Inspections 69 DOM
-
2026-05-12historical Contingency - Finance and Inspections 589-char remark
Show marketing remark (589 chars)
Opportunity knocks in Bellefontaine! This 404 N Troy St property, priced at just $136,000, is the perfect chance for investors, flippers, or first-time buyers ready to build equity. Featuring solid bones and plenty of potential, this home offers a blank canvas to update, renovate, and make your own. Conveniently located near downtown, parks, and local amenities, it's ideal for a rental, flip, or affordable starter home. With comparable homes in the area selling at higher price points, this is a value-add opportunity you don't want to miss. Bring your vision and unlock the potential!
-
2026-04-25price $110,000 589-char remark
Show marketing remark (589 chars)
Opportunity knocks in Bellefontaine! This 404 N Troy St property, priced at just $136,000, is the perfect chance for investors, flippers, or first-time buyers ready to build equity. Featuring solid bones and plenty of potential, this home offers a blank canvas to update, renovate, and make your own. Conveniently located near downtown, parks, and local amenities, it's ideal for a rental, flip, or affordable starter home. With comparable homes in the area selling at higher price points, this is a value-add opportunity you don't want to miss. Bring your vision and unlock the potential!
-
2026-04-16price $129,000 589-char remark
Show marketing remark (589 chars)
Opportunity knocks in Bellefontaine! This 404 N Troy St property, priced at just $136,000, is the perfect chance for investors, flippers, or first-time buyers ready to build equity. Featuring solid bones and plenty of potential, this home offers a blank canvas to update, renovate, and make your own. Conveniently located near downtown, parks, and local amenities, it's ideal for a rental, flip, or affordable starter home. With comparable homes in the area selling at higher price points, this is a value-add opportunity you don't want to miss. Bring your vision and unlock the potential!
-
2026-03-23$136,000 Active 589-char remark
Show marketing remark (589 chars)
Opportunity knocks in Bellefontaine! This 404 N Troy St property, priced at just $136,000, is the perfect chance for investors, flippers, or first-time buyers ready to build equity. Featuring solid bones and plenty of potential, this home offers a blank canvas to update, renovate, and make your own. Conveniently located near downtown, parks, and local amenities, it's ideal for a rental, flip, or affordable starter home. With comparable homes in the area selling at higher price points, this is a value-add opportunity you don't want to miss. Bring your vision and unlock the potential!
-
2022-04-07soldstatus $97,200
-
2022-04-04soldstatus $97,250
-
2022-03-30soldstatus $97,200 Closed
-
2022-03-30soldstatus $97,200 Sold
-
2022-03-25$97,200
-
2022-02-24status Pending
-
2022-02-18$88,500 Active
-
2021-10-08soldstatus $86,000 Closed
-
2021-09-22status Pending
-
2021-09-21status Active
-
2021-08-25historical Contingency - Finance and Inspections
-
2021-08-23price $87,500
-
2021-08-12price $89,900
-
2021-06-28$94,900 Active
-
2013-08-21historical
-
2013-02-21$39,900
-
2004-01-13soldstatus $31,000
ⓘ Source: listings_history table (triggers on properties + properties_extension) + one-shot
backfill from property_details.listing_events for pre-trigger history.
Tax reassessment forecast OH · Partial reset (capped growth)
- Current annual tax
- $1,308 · $109/mo
- Projected year-2 tax
- $1,512 · $126/mo
- Expected delta
- +$204/yr (+$17/mo · 15.6%)
ⓘ Screening estimate from a state-policy table — verify with the county assessor before closing.
Climate risk First Street
- Flood 1/10 Low FEMA zone X (unshaded) · 0% chance over 30 yrs
- Wildfire 1/10 Low
- Heat 3/10 Moderate 7 d/yr ≥98°F today · 18 d/yr by 30 yrs out
- Wind 2/10 Low
- Air quality 2/10 Low 1 unhealthy d/yr today · 2 by 30 yrs out
Nearby sold comps map
Loading sold comps map…
Walkable amenities ~0.75 mi
Loading nearby amenities…
Taxation est. · year 1
- Rental income
- $14,609
- − Mortgage interest
- −$6,162
- − Property taxes
- −$1,308
- − Insurance
- −$550
- − Repairs & maintenance
- −$1,169
- − Management
- −$1,169
- − Depreciation
- −$3,200
- Taxable income
- $1,052
- Est. tax owed @ 24.0%
- −$252
- After-tax cash flow
- $2,508/yr
For passive investors: Depreciation is non-cash, so a rental often shows a tax loss while cash-flowing — sheltering income. Rental losses are passive: they offset passive income freely, and up to $25,000/yr can offset ordinary (W-2) income if you actively participate and your MAGI is under $100k (phasing out to $0 by $150k); unused losses carry forward. On sale, claimed depreciation is recaptured at up to 25%, and gains may owe capital-gains tax (a 1031 exchange can defer both). Figures are a year-1 estimate at your 24.0% rate — not tax advice; consult a CPA.
Schools (NCES district)
- District
- Bellefontaine City
- NCES district ID
- 3904358
- Math proficiency
- 55% ▼ -10.00%
- Reading proficiency
- 59% ▼ -6.00%
- Median HH income
- $43,270
- Composite
- 47.94/100
- National rank
- #2207
- State rank
- #348 of 656 in OH
Livability — Bellefontaine
- Score
- 76/100
- State rank
- #213
- US rank
- #3316
Category grades
Schools grade is shown separately in the Schools card above.
Census & demographics
- Census place
- Bellefontaine, OH
- County
- Logan · 47,256 people
- City population
- 20,074
- Population (ZIP)
- 20,074
- Household income
- $64,217
- Rent vs Own
- Severe rent burden
- 10.1
Population outlook (Logan County) Hauer SSP2
- Today (2025)
- 44,240 people
- By 2030
- 43,166 · -2.4%
- By 2040
- 40,495 · -8.5%
- By 2050
- 37,511 · -15.2%
- By 2075
- 30,453 · -31.2%
- By 2100
- 23,081 · -47.8%
Race, ethnicity, and origin ACS 2023
- Neighborhood character
- Predominantly White (90%)
- Race & ethnicity
- White 90% Two or more races 5% Black 3% Hispanic / Latino 2%
- Common ancestry
- Italian 4% Slovak 4% Lithuanian 2%
- Foreign-born
- 2% · Canada
- Languages at home
- 98% English-only · Spanish 1%
Political lean MEDSL · Logan
- 2024 margin
- Solid R (+56.2) · D 21.5% · R 77.7%
- 2008→2024 swing
- -29.6pp toward R · 2008: -26.6pp · 2024: -56.2pp
- All cycles
- 2024: R+56.2 2020: R+55.2 2016: R+52.6 2012: R+31.8 2008: R+26.6
Not yet ingested
- Civics
- —
Market trends
- HPI YoY
- ▼ -182.18%
- Current HPI
- 243.9954
- Rent YoY
- —
- Metro
- —
- State GDP YoY
- ▲ 1.98%
- F500 in state
- 48
Industry mix (Fortune 500 HQ in OH)
| Industry | F500 HQs | Revenue |
|---|---|---|
| Insurance | 3 | $145B |
|
||
| Industrial Machinery | 3 | $49B |
|
||
| Financial Services | 3 | $24B |
|
||
| Consumer Goods | 2 | $93B |
|
||
| Aerospace / Defense | 2 | $47B |
|
||
| Utilities | 2 | $33B |
|
||
Price history
+254.8% since first listed21 events — show timeline
- 2026-05-12 Contingent — WRIST
- 2026-04-25 Price Changed $110,000 WRIST
- 2026-04-16 Price Changed $129,000 WRIST
- 2026-03-23 Listed $136,000 WRIST
- 2022-04-07 Sold (MLS) $97,200 CBRMLS
- 2022-04-04 Sold (Public Records) $97,250 Public Records
- 2022-03-30 Sold (MLS) $97,200 Dayton MLS
- 2022-03-30 Sold (MLS) $97,200 Dayton MLS
- 2022-03-25 Listed $97,200 CBRMLS
- 2022-02-24 Pending — Dayton MLS
- 2022-02-18 Listed $88,500 Dayton MLS
- 2021-10-08 Sold (MLS) $86,000 WRIST
- 2021-09-22 Pending — WRIST
- 2021-09-21 Relisted — WRIST
- 2021-08-25 Contingent — WRIST
- 2021-08-23 Price Changed $87,500 WRIST
- 2021-08-12 Price Changed $89,900 WRIST
- 2021-06-28 Listed $94,900 WRIST
- 2013-08-21 Listing Removed — WRIST
- 2013-02-21 Listed $39,900 WRIST
- 2004-01-13 Sold (Public Records) $31,000 Public Records
Property tax history
+6.4%/yrLatest (2025): $1,308 · +38.7% YoY. Source: county tax records.
Cash-flow waterfall
monthlySold comps — $/sqft
last 12 mo · ≤1 miLoading sold comps…