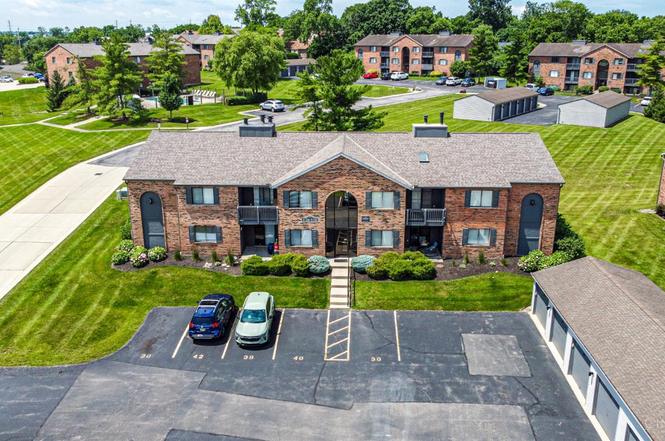
5138 Cassidy Pass Dr #38 · Beckett Ridge, OH
Flood risk 1/10 · Minimal
- FEMA flood zone
- X (unshaded)
- Chance of flooding over 30 yrs
- 0.0%
- Est. flood insurance / yr
- $507 – $1,088
Fire risk 1/10 · Minimal
- Est. fire insurance / yr
- $713 – $1,323
Heat risk 5/10 · Moderate
- Hot days now (above 104°F)
- 7 days/yr
- Hot days in 30 yrs
- 19 days/yr
Wind risk 2/10 · Minimal
- Chance of severe wind over 30 yrs
- 1.0%
Air-quality risk 4/10 · Minor
- Unhealthy air days now
- 4 days/yr
- Unhealthy air days in 30 yrs
- 7 days/yr
Risk factors via First Street. Map © Google.
Why this score? — see what drove the D grade
The composite is a weighted blend of 9 inputs, each scored 0–100. Each bar is that input's sub-score; the figure is the points it added to the 100-point composite (weight × sub-score).
- Cash flow +11.4/30.0
- ARV discount +7.5/15.0
- Schools +6.3/10.0
- 1% rule +4.8/10.0
- Livability +3.5/5.0
- DSCR +3.3/10.0
- Rent growth +3.2/5.0
- Condition / age +2.5/5.0
- Appreciation +0.0/10.0
$198,000
🖨 Deal sheet (PDF) 📄 Offer letter ✓ Due diligence
Listing remarks MLS
Great condo in a very convenient area. Minutes from Union Center Blvd/I-75 and I-275. 2 bed, 2 full bath with kitchen/dining combo. Spacious family room with skylight/balcony access add lots of natural light. Newer flooring and paint. In unit laundry. Balcony redone in 2021. One car garage with one additional assigned parking spot.
Key facts
- Open-concept design
- Community pool
- Private balcony
Tags
Property features AI
Finance
- Other: Residential zoning
- HOA & community: HOA present; owner pays HOA; HOA fee approximately $300 monthly
Exterior
- Parking: Detached garage; 1 assigned garage space
- Utilities: Public water; Public sewer; Electric service
- Home design: Traditional style; One level unit in a 2-story building; Unit entry on level 2
- Construction: Brick construction; Shingle roof; Slab foundation
- Exterior features: Balcony; Slider and vinyl windows
Interior
- Kitchen: Dishwasher; Microwave; Oven/Range; Refrigerator
- Bedrooms: 2 bedrooms total; Primary bedroom on level 1, approximately 16 x 14; Second bedroom on level 1, approximately 14 x 12
- Flooring: Laminate flooring in living room
- Bathrooms: 2 full bathrooms (both on level 2)
- Heating & cooling: Heat pump heating; Central air conditioning; Electric water heating
- Interior features: Cathedral ceiling; Skylight; Fireplace (wood); Common hallway entry; Laundry in unit
- Laundry & utility: In-unit laundry room (about 7 x 6)
Neighborhood map
What this means for you Summary
Snapshot
- This is a 2-bed/2.0-bath condo listed at $198k.
Deal economics
- At list price, monthly cash flow is $-70 ($-844/yr) — negative.
- To cash-flow at today's rent, offer at most $186k (6.3% below list).
- To meet the 1% rule (rent ≥ 1% of price), the offer needs to be $194k (1.9% below list).
- Recommended offer: $186k (6.3% below list) — sets the bar for cash-flow.
Location & tenants
- Location reads 70/100 on livability (#479 in OH) — a middle-class / working-renter tenant base. Strengths: crime A+, employment A+, housing A+; Watch: amenities D-, commute F, health & safety F.
- Lakota Local (suburban): math 68% / reading 72% proficiency, ranked #107 of 656 in OH (top 16%) — strong family-tenant draw, lease renewals of 3-5y typical; only 18% free/reduced lunch — higher-income household profile.
- Zoned schools: Freedom Elementary School (math 72% / reading 70%, grade A-, #371 of 1,584 statewide, top 24%, 677 students, 29% FRL); Lakota Ridge Junior School (math 56% / reading 68%, grade B+, #242 of 654 statewide, top 38%, 679 students, 30% FRL); Lakota West High School (math 54% / reading 75%, grade B-, #164 of 781 statewide, top 24%, 2,740 students, 22% FRL).
- Market conditions: Rents rising (+3.0%/yr); 197 active listings in the ZIP; 3 comparable units currently listed for rent nearby; rentals leasing fast (median 6d on market — plan ~1-2 weeks tenant-placement turnaround); solid renter incomes; 1,163 units permitted in Butler County in 2024 (356 in 5+ unit buildings).
Forward outlook
- Local home prices are declining (-3.0%/yr); year-one equity from $1k of loan paydown is wiped out by about $6k of value loss. Plan a longer hold.
Negotiation context
- Only 6 days on market — expect competitive offers; lowballing is unlikely to land.
- 3 sale attempts since 14y ago with the ask held roughly flat each time — persistent listings suggest the price (not the market) is what's stuck; bring a comps-based counter.
Risks & watch-outs
- Climate carrying-cost: extreme-heat days projected 7→19/yr by 2055 (HVAC capex compounding) — expect insurance premiums to compound above CPI over the hold.
Questions for the listing agent
- What do current leases actually rent for vs. the listed asking? Can we see a recent rent roll and the last 12 months of T-12 income?
- What does the HOA fee cover, when was the last increase, and are there any pending special assessments or reserve-fund shortfalls?
- Any open or pending special assessments — roof, HVAC, plumbing, elevator, façade? What's the per-unit balance and payoff schedule, and is the seller paying it off at close or rolling it to the buyer?
- Is there a deadline driving the sale (1031 exchange, divorce, estate, relocation)? That informs how much negotiation room exists.
- Schools are A-rated — typically a magnet for longer-tenancy family renters. What's the average tenant stay here, and is there a school-zone premium baked into asking?
- The area grade is low — what's the realistic commute time and amenity access for the typical tenant pool here? Any planned neighborhood developments (good or bad) we should know about?
- What's the average days-on-market for RENTAL listings here right now (not sales)? A rising rental-DOM trend means longer vacancies and softer asking-rent achievability than the comps imply.
- What's the recent tenant-quality profile in this submarket — average credit score on applications, eviction rate, late-payment / NSF rate, and stable-employment percentage? A property-management company in the area should have these aggregated.
- How much new apartment / multifamily construction is in the pipeline within 1–3 miles? Heavy new supply (>2% of stock underway) typically softens rents 12–24 months out; light construction supports rent growth.
Investment metrics
- 1% rule
- 0.98% ✗
- Cap rate
- 5.87%
- Cash-on-cash
- -1.52%
- DSCR
- 0.93
- GRM
- 8.5
CMA / ARV
No comps found within radius.
Projected returns pro-forma
-3.0% appreciation · 2.95% rent growth · sell at horizon
- IRR
- -18.8%
- Equity multiple
- 0.34×
- Total profit
- $-36,486
- Equity at exit
- $29,522
- IRR
- -11.1%
- Equity multiple
- 0.33×
- Total profit
- $-37,228
- Equity at exit
- $17,119
Cash invested: $55,440 (down + closing). Projections, not guarantees.
Landlord ↔ Tenant lean methodology
- Overall (STATE)
- 73 Landlord-Friendly
- State Ohio
- 73 Landlord-Friendly · R+6
- County
- — inherits STATE
- City
- — inherits STATE
ZIP-level market 45011
- Rents YoY
- 3.0%
- Active inventory
- 197
- Price-to-rent
- 8.5×
Monthly cashflow live
- Estimated rent
- $1,943 medium interval (Pro) →
- Mortgage (P&I)
- −$1,038
- Tax from tax record
- −$185 /mo · $2,215/yr
- Insurance
- −$82
- HOA
- −$300
- Vacancy / Maint / Mgmt
- −$408
- Net cashflow
- $-70
Break-even live
Sensitivity live
| Price | -10% $42 | -5% $-14 | +0% $-70 | +5% $-126 | +10% $-182 |
|---|---|---|---|---|---|
| Rent | -10% $-224 | -5% $-147 | +0% $-70 | +5% $6 | +10% $83 |
| Rate | -1.0pp $29 | -0.5pp $-20 | base $-70 | +0.5pp $-122 | +1.0pp $-174 |
UW: 25.0% down · 7.5% · 30yr · 1.5% tax · 5.0% vac · 8.0% maint · 8.0% mgmt
Financing live
Cash to close
- Down payment
- $49,500
- Closing costs
- $5,940
- Reserves months
- —
- Total cash needed
- —
Loan-product check · same deal, 3 products live
Conventional
25% down · 7.5% · 30yr
- Down + closing
- —
- Monthly P&I
- —
- Monthly cashflow
- —
- DSCR
- —
- Eligible?
- —
Personal DTI + credit; lowest rate.
DSCR
20% down · 8.5% · 30yr
- Down + closing
- —
- Monthly P&I
- —
- Monthly cashflow
- —
- DSCR
- —
- Eligible?
- —
No personal income docs; deal must DSCR.
Hard money
10% down · 12.0% · 12mo
- Down + closing
- —
- Monthly P&I
- —
- Monthly cashflow
- —
- DSCR
- —
- Eligible?
- —
Short-term bridge; refi at stabilization.
Rent comps 3 comps
| Address | Beds | Baths | Sqft | Rent | $/sqft | DOM | Units | Dist |
|---|---|---|---|---|---|---|---|---|
| 5215 Westwind Ave Hamilton, OH | 3.0 | 2.5 | 1315 | $1,790 | $1.36 | 5d | 1 | 0.21mi |
| 9050 W Chester Blvd West Chester, OH | 3.0 | 1.0–2.0 | 977 | $2,192 | $2.24 | 5d | 24 | 1.03mi |
| 9365 Clocktower Sq West Chester Township, OH | 1.0–2.0 | 1.0–2.5 | 1172 | $2,775 | $2.37 | 3d | 47 | 1.29mi |
HOA detail condo
- Monthly dues
- $300 · $3,600/yr
- Likely covers
- parking
- Assessments
- None detected in remarks — confirm with the listing agent.
Listing history 5 events
-
2026-06-21days on market $198,000 Active 6 DOM
-
2026-06-18days on market $198,000 Active 3 DOM
-
2026-06-17days on market $198,000 Active 2 DOM
-
2026-06-16remarks 699-char remark
-
2026-06-16$198,000 Active 1 DOM
ⓘ Source: listings_history table (triggers on properties + properties_extension) + one-shot
backfill from property_details.listing_events for pre-trigger history.
Tax reassessment forecast OH · Partial reset (capped growth)
- Current annual tax
- $2,215 · $185/mo
- Projected year-2 tax
- $2,652 · $221/mo
- Expected delta
- +$437/yr (+$36/mo · 19.7%)
ⓘ Screening estimate from a state-policy table — verify with the county assessor before closing.
Climate risk First Street
- Flood 1/10 Low FEMA zone X (unshaded) · 0% chance over 30 yrs
- Wildfire 1/10 Low
- Heat 5/10 Major 7 d/yr ≥104°F today · 19 d/yr by 30 yrs out
- Wind 2/10 Low 100% chance of damaging wind over 30 yrs
- Air quality 4/10 Moderate 4 unhealthy d/yr today · 7 by 30 yrs out
Nearby sold comps map
Loading sold comps map…
Walkable amenities ~0.75 mi
Loading nearby amenities…
Taxation est. · year 1
- Rental income
- $23,317
- − Mortgage interest
- −$11,091
- − Property taxes
- −$2,215
- − Insurance
- −$990
- − Repairs & maintenance
- −$1,865
- − Management
- −$1,865
- − HOA
- −$3,600
- − Depreciation
- −$5,760
- Taxable loss
- −$4,069
- Est. tax savings @ 24.0%
- +$977
- After-tax cash flow
- $133/yr
For passive investors: Depreciation is non-cash, so a rental often shows a tax loss while cash-flowing — sheltering income. Rental losses are passive: they offset passive income freely, and up to $25,000/yr can offset ordinary (W-2) income if you actively participate and your MAGI is under $100k (phasing out to $0 by $150k); unused losses carry forward. On sale, claimed depreciation is recaptured at up to 25%, and gains may owe capital-gains tax (a 1031 exchange can defer both). Figures are a year-1 estimate at your 24.0% rate — not tax advice; consult a CPA.
Schools (NCES district)
- District
- Lakota Local
- NCES district ID
- 3904611
- Math proficiency
- 68% ▼ -10.00%
- Reading proficiency
- 72% ▼ -5.00%
- Median HH income
- $90,743
- Composite
- 63.25/100
- National rank
- #631
- State rank
- #107 of 656 in OH
Livability — Beckett Ridge
- Score
- 70/100
- State rank
- #479
- US rank
- #7982
Category grades
Schools grade is shown separately in the Schools card above.
Census & demographics
- County
- Butler County · 381,674 people
- Metro
- Cincinnati, OH-KY-IN
- Population (ZIP)
- 75,864
- Household income
- $91,873
- Rent vs Own
- Severe rent burden
- 1795.0
Population outlook (Butler County) Hauer SSP2
- Today (2025)
- 387,706 people
- By 2030
- 392,028 · +1.1%
- By 2040
- 395,307 · +2.0%
- By 2050
- 391,116 · +0.9%
- By 2075
- 378,642 · -2.3%
- By 2100
- 343,248 · -11.5%
Race, ethnicity, and origin ACS 2023
- Neighborhood character
- Predominantly White (68%)
- Race & ethnicity
- White 68% Hispanic / Latino 12% Black 11% Two or more races 9% Asian 4%
- Hispanic origin (detail)
- Mexican 7%
- Common ancestry
- Romanian 2% Italian 2% Slovak 2%
- Foreign-born
- 11% · Canada, Vietnam, China
- Languages at home
- 86% English-only · Spanish 8% Other Indo-European 2% Vietnamese 1%
Political lean MEDSL · Butler
- 2024 margin
- Strong R (+26.3) · D 36.4% · R 62.7%
- 2008→2024 swing
- -3.6pp toward R · 2008: -22.6pp · 2024: -26.3pp
- All cycles
- 2024: R+26.3 2020: R+24.0 2016: R+28.3 2012: R+26.2 2008: R+22.6
Not yet ingested
- Civics
- —
Market trends
- HPI YoY
- ▼ -188.67%
- Current HPI
- 259.7868
- Rent YoY
- ▲ 2.95%
- Metro
- Cincinnati, OH-KY-IN
- State GDP YoY
- ▲ 1.98%
- F500 in state
- 48
Industry mix (Fortune 500 HQ in OH)
| Industry | F500 HQs | Revenue |
|---|---|---|
| Insurance | 3 | $145B |
|
||
| Industrial Machinery | 3 | $49B |
|
||
| Financial Services | 3 | $24B |
|
||
| Consumer Goods | 2 | $93B |
|
||
| Aerospace / Defense | 2 | $47B |
|
||
| Utilities | 2 | $33B |
|
||
Price history
+250.4% since first listed10 events — show timeline
- 2026-06-15 Listed $198,000 Cincy MLS
- 2025-02-27 Sold (Public Records) $175,000 Public Records
- 2025-02-26 Sold (MLS) $175,000 Cincy MLS
- 2025-01-22 Contingent — Cincy MLS
- 2025-01-20 Listed $172,000 Cincy MLS
- 2020-06-04 Sold (Public Records) $96,000 Public Records
- 2013-03-08 Sold (Public Records) $58,000 Public Records
- 2013-02-25 Sold (MLS) $58,000 Cincy MLS
- 2012-09-29 Listed $65,000 Cincy MLS
- 1994-04-07 Sold (Public Records) $56,500 Public Records
Property tax history
+5.2%/yrLatest (2025): $2,215 · +22.7% YoY. Source: county tax records.
Cash-flow waterfall
monthlySold comps — $/sqft
last 12 mo · ≤1 miLoading sold comps…