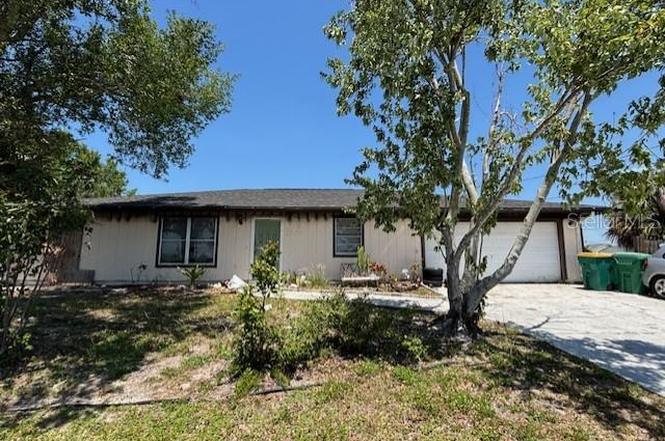
3538 Pinetree St · Port Charlotte, FL
Flood risk 9/10 · Severe
- FEMA flood zone
- AE
- Chance of flooding over 30 yrs
- 0.99%
- Est. flood insurance / yr
- $1,737 – $8,500
Fire risk 1/10 · Minimal
- Est. fire insurance / yr
- $947 – $1,759
Heat risk 10/10 · Severe
- Hot days now (above 107°F)
- 7 days/yr
- Hot days in 30 yrs
- 28 days/yr
Wind risk 10/10 · Severe
- Chance of severe wind over 30 yrs
- 99.0%
Air-quality risk 3/10 · Minor
- Unhealthy air days now
- 2 days/yr
- Unhealthy air days in 30 yrs
- 2 days/yr
Risk factors via First Street. Map © Google.
Why this score? — see what drove the B- grade
The composite is a weighted blend of 9 inputs, each scored 0–100. Each bar is that input's sub-score; the figure is the points it added to the 100-point composite (weight × sub-score).
- Cash flow +30.0/30.0
- 1% rule +10.0/10.0
- DSCR +10.0/10.0
- ARV discount +7.5/15.0
- Schools +4.6/10.0
- Livability +3.2/5.0
- Condition / age +2.5/5.0
- Rent growth +2.2/5.0
- Appreciation +0.0/10.0
$155,000
🖨 Deal sheet 📄 Offer letter ✓ Due diligence
Listing remarks
Opportunity is at your door. Multi-generational living, rental income potential, sibling/best friend investment, etc. , etc. , etc. This home has the potential to have not one but TWO in-law suites or rental units, each with their own separate entrances. The 2,110 square feet can also easily accommodate a 4th bedroom, den, or office. There are 2 kitchens and 4 full bathrooms. The options are endless. Located on an oversized corner lot, there are 2 very large separate driveways, great for extra vehicles, RV's, boats, etc. There are no HOA fees or deed restrictions. There is fire damage to a portion of the property and this home is being sold AS IS with no warranties provided. Don't miss out
Key facts
- In-law suites
- Oversized corner lot
- Rental units
Tags
Property features AI
Finance
- Other: Zoning: RSF 3.5; Lot size approximately 0.26 acres (92 x 125); Number of rooms: 7; Number of lots: 1; Other structures: shed(s)
- Financial info: No lease restrictions reported
- HOA & community: No HOA association; Street lights in the community; Pets allowed
Exterior
- Parking: Driveway with ground-level, oversized parking; RV access/parking; Attached garage (2 spaces)
- Security: No specific security features listed
- Utilities: Public water; Public sewer; Electricity connected; Sewer connected; Water connected; Phone available; Broadband/high-speed internet available
- Home design: Single-family residence; Residential property; Fixer condition; One story; Home faces south
- Construction: Frame construction with wood siding; Shingle roof; Slab foundation; Building area about 2,560 (public records); Living area about 2,110 (public records)
- Exterior features: Private mailbox; Sliding doors; Storage shed(s); Chain link fencing; Corner lot; Flood zone; Landscaped yard with mature trees; Oversized, private lot; Paved lot and driveway; Public maintained road access
Interior
- Kitchen: No appliances listed
- Bedrooms: 3 bedrooms
- Flooring: Tile flooring
- Bathrooms: 4 full bathrooms
- Heating & cooling: Central heating; Central air conditioning
- Interior features: Kitchen and family room combined; Living and dining room combined; Solid surface counters; Stone counters; Split bedroom floorplan; Walk-in closets; Family room; Interior in-law suite with private entry
- Laundry & utility: Laundry inside the home; Laundry area in the garage
Neighborhood map
What this means for you Summary
Snapshot
- This is a 3-bed/4.0-bath single-family listed at $155k.
Deal economics
- At list price, monthly cash flow is $792 ($10k/yr) — positive.
- The deal already cash-flows at list — no discount required.
- Meets the 1% rule at list price ($3k rent vs $155k).
- Recommended offer: $136k (12.0% below list) — sets the bar for market timing.
- Cap rate 15.7% vs local median 4.4% in Port Charlotte — top-decile yield for the area; either an underpriced asset or a hidden risk that comps aren't pricing in. Stress-test before assuming the spread holds.
Location & tenants
- Location reads 65/100 on livability (#655 in FL) — a middle-class / working-renter tenant base. Strengths: cost of living A+, housing A+; Watch: employment D, amenities F, commute F.
- Charlotte (suburban): math 54% / reading 54% proficiency, ranked #22 of 73 in FL (top 30%) — acceptable for families but not a draw, mixed tenant base, ~2y average lease.
- Zoned schools: Peace River Elementary School (math 56% / reading 54%, grade C, #872 of 2,144 statewide, top 42%, 581 students, 64% FRL); Port Charlotte High School (math 23% / reading 38%, grade F, #434 of 667 statewide, top 66%, 1,649 students, 43% FRL) — zoned schools at 54% FRL track the district average.
- Market conditions: Rents soft (-1.4%/yr); 707 active listings in the ZIP; 19 comparable units currently listed for rent nearby; rentals at typical pace (median 21d on market — plan ~3-4 weeks tenant-placement turnaround); 4,585 units permitted in Charlotte County in 2024 (703 in 5+ unit buildings).
- At $3,101/mo this rent would consume 61% of the median local household income ($61k/yr) (locally 733% of renters already pay >50% of income on rent) — very limited rent-growth headroom before tenants either downsize or default.
Forward outlook
- Local home prices are declining (-3.0%/yr); year-one equity from $1k of loan paydown is wiped out by about $5k of value loss. Plan a longer hold.
- Charlotte County population projected at +24% by 2050 — long-run rental-demand tailwind backs the buy-and-hold thesis.
- At projected returns (-3.0% appreciation + 0.0% rent growth), your $43k cash investment doubles in ~8 years — after that, you're playing with house money.
Negotiation context
- It's been on market 361 days — a 12% lower offer ($136k) is reasonable based on typical stale-listing flexibility.
- 6 sale attempts since 10y ago; this cycle's ask has dropped $25k (14%) from the opening price — seller is motivated, your offer sets the floor, not the list.
Risks & watch-outs
- Watch-outs: property tax is 2.7% of price; flood insurance adds $427/mo.
- Climate carrying-cost: in FEMA flood zone AE (mandatory federal flood insurance); severe wind risk, 99% chance of damaging wind over 30y; extreme-heat days projected 7→28/yr by 2055 (HVAC capex compounding) — expect insurance premiums to compound above CPI over the hold.
Questions for the listing agent
- It's been on market 361 days. Have you received any prior offers? Is the seller open to a 12% concession, seller financing, or rate buy-down credit?
- Property tax is high relative to price — has the assessment been appealed recently, and will the sale trigger a re-assessment?
- What's the actual annual flood-insurance premium (NFIP or private), and is the property in a SFHA with mandatory coverage?
- Why hasn't it sold? Are there any deal-killer items the seller is aware of (foundation, flood, title, zoning, code violations)?
- Is there a deadline driving the sale (1031 exchange, divorce, estate, relocation)? That informs how much negotiation room exists.
- Schools are D-rated, which usually means shorter tenancies and higher turnover. Who's the typical renter profile here, and what's been the actual vacancy rate?
- What's the average days-on-market for RENTAL listings here right now (not sales)? A rising rental-DOM trend means longer vacancies and softer asking-rent achievability than the comps imply.
- What's the recent tenant-quality profile in this submarket — average credit score on applications, eviction rate, late-payment / NSF rate, and stable-employment percentage? A property-management company in the area should have these aggregated.
- How much new for-sale + rental construction is in the pipeline within 1–3 miles? Heavy new supply typically softens prices + rents 12–24 months out; constrained supply supports both.
Investment metrics
- 1% rule
- 2.00% ✓
- Cap rate
- 15.72%
- Cash-on-cash
- 33.68%
- DSCR
- 2.50
- GRM
- 4.2
CMA / ARV
- ARV (on-the-fly)
- $371,360
- Comps found
- 5
Show comp detail 5 sales within ~0.75 mi
| Address | Dist | Beds/Ba | Sqft | Sold | Price | $/sf | Match |
|---|---|---|---|---|---|---|---|
| 110 Peckham St SW | 0.67mi | 3/3.0 | 2,154 (+2%) | 5mo | $350,000 | $162 | 57 |
| 217 E Tarpon Blvd NW | 0.31mi | 3/2.0 | 1,861 (-12%) | 6mo | $450,000 | $242 | 53 |
| 131 Spring Lake Blvd NW | 0.67mi | 4/2.0 (+1) | 2,106 (-0%) | 9mo | $313,000 | $149 | 48 |
| 226 Spring Lake Blvd NW | 0.70mi | 3/2.5 | 1,836 (-13%) | 3mo | $381,000 | $208 | 38 |
| 110 Colonial St SW | 0.72mi | 2/2.0 (-1) | 1,816 (-14%) | 12mo | $320,000 | $176 | 20 |
Match score weights: distance 35% · size 25% · config 20% · recency 20%. Top-matched comps best support the ARV.
Projected returns pro-forma
-3.0% appreciation · 0.0% rent growth · sell at horizon
- IRR
- 10.2%
- Equity multiple
- 1.38×
- Total profit
- $16,624
- Equity at exit
- $23,111
- IRR
- 15.8%
- Equity multiple
- 2.06×
- Total profit
- $45,938
- Equity at exit
- $13,402
Cash invested: $43,400 (down + closing). Projections, not guarantees.
Landlord ↔ Tenant lean methodology
- Overall (STATE)
- 87 Strongly Landlord-Friendly
- State Florida
- 87 Strongly Landlord-Friendly · R+3
- County
- — inherits STATE
- City
- — inherits STATE
ZIP-level market 33952
- Home prices YoY
- -4.8%
- Rents YoY
- -1.4%
- Active inventory
- 707
- Price-to-rent
- 4.2×
Monthly cashflow live
- Estimated rent
- $3,101 high interval (Pro) →
- Mortgage (P&I)
- −$813
- Tax from tax record
- −$354 /mo · $4,248/yr
- Insurance
- −$65
- Flood insurance flood zone
- −$427 /mo · $5,118/yr
- HOA
- −$0
- Vacancy / Maint / Mgmt
- −$651
- Net cashflow
- $792
Break-even live
UW: 25.0% down · 7.5% · 30yr · 1.5% tax · 5.0% vac · 8.0% maint · 8.0% mgmt
Financing live
Cash to close
- Down payment
- $38,750
- Closing costs
- $4,650
- Reserves months
- —
- Total cash needed
- —
Loan-product check · same deal, 3 products live
Conventional
25% down · 7.5% · 30yr
- Down + closing
- —
- Monthly P&I
- —
- Monthly cashflow
- —
- DSCR
- —
- Eligible?
- —
Personal DTI + credit; lowest rate.
DSCR
20% down · 8.5% · 30yr
- Down + closing
- —
- Monthly P&I
- —
- Monthly cashflow
- —
- DSCR
- —
- Eligible?
- —
No personal income docs; deal must DSCR.
Hard money
10% down · 12.0% · 12mo
- Down + closing
- —
- Monthly P&I
- —
- Monthly cashflow
- —
- DSCR
- —
- Eligible?
- —
Short-term bridge; refi at stabilization.
Rent comps 19 comps
| Address | Beds | Baths | Sqft | Rent | $/sqft | DOM | Units | Dist |
|---|---|---|---|---|---|---|---|---|
| 3509 Port Charlotte Blvd Port Charlotte, FL | 3.0 | 2.0 | 1830 | $5,000 | $2.73 | 21d | 1 | 0.05mi |
| 266 Rockwood St NW Port Charlotte, FL | 3.0 | 2.0 | 1400 | $1,850 | $1.32 | 13d | 1 | 0.19mi |
| 177 Dartmouth Dr NW Port Charlotte, FL | 2.0 | 1.5 | 1541 | $3,250 | $2.11 | 21d | 1 | 0.40mi |
| 3250 Sunrise Trl Port Charlotte, FL | 2.0 | 2.0 | 2151 | $3,900 | $1.81 | 21d | 1 | 0.53mi |
| 557 Mayview Ave NW Port Charlotte, FL | 3.0 | 2.0 | 1513 | $1,796 | $1.19 | 21d | 1 | 0.64mi |
| 167 Godfrey Ave NE Port Charlotte, FL | 3.0 | 2.0 | 1731 | $2,750 | $1.59 | 13d | 1 | 0.72mi |
| 115 Leland St SE Unit 1371159P Port Charlotte, FL | 3.0 | 2.0 | 1539 | $3,758 | $2.44 | 21d | 1 | 0.77mi |
| 285 Millport St NW Port Charlotte, FL | 3.0 | 2.0 | 1651 | $2,200 | $1.33 | 21d | 1 | 1.01mi |
| 326 Millport St NW Port Charlotte, FL | 3.0 | 2.0 | 1459 | $2,400 | $1.64 | 21d | 1 | 1.05mi |
| 334 Millport St NW Port Charlotte, FL | 3.0 | 2.0 | 1459 | $2,400 | $1.64 | 21d | 1 | 1.06mi |
| 21484 Edgewater Dr Port Charlotte, FL | 3.0 | 2.0 | 1731 | $2,500 | $1.44 | 21d | 1 | 1.10mi |
| 129 Cousley Dr SE Port Charlotte, FL | 3.0 | 2.0 | 2021 | $5,900 | $2.92 | 21d | 1 | 1.14mi |
| 240 Dalton Blvd Port Charlotte, FL | 3.0 | 2.0 | 1513 | $1,600 | $1.06 | 21d | 1 | 1.15mi |
| 835 Conreid Dr NE Port Charlotte, FL | 3.0 | 2.0 | 1962 | $2,200 | $1.12 | 21d | 1 | 1.16mi |
| 2443 Duke Ln Port Charlotte, FL | 3.0 | 2.0 | 1831 | $1,650 | $0.90 | 13d | 1 | 1.16mi |
| 262 Grenada St Port Charlotte, FL | 3.0 | 2.0 | 1650 | $1,845 | $1.12 | 21d | 1 | 1.26mi |
| 21298 Stillwater Ave Port Charlotte, FL | 2.0 | 1.0 | 1798 | $1,300 | $0.72 | 21d | 1 | 1.37mi |
| 22148 Lockport Ave Port Charlotte, FL | 3.0 | 2.0 | 1760 | $1,850 | $1.05 | 13d | 1 | 1.48mi |
| 181 Beeney Rd SE Port Charlotte, FL | 4.0 | 2.5 | 1846 | $4,900 | $2.65 | 21d | 1 | 1.49mi |
Listing history 34 events
-
2026-06-18days on market $155,000 Active 361 DOM
-
2026-06-17days on market $155,000 Active 360 DOM
-
2026-06-16days on market $155,000 Active 359 DOM
-
2026-06-15pricedays on market $155,000 Active 358 DOM
-
2026-06-14days on market $150,000 Active 356 DOM
-
2026-06-13days on market $150,000 Active 355 DOM
-
2026-06-10days on market $150,000 Active 353 DOM
-
2026-06-09days on market $150,000 Active 352 DOM
-
2026-06-08days on market $150,000 Active 351 DOM
-
2026-06-05days on market $150,000 Active 347 DOM
-
2026-06-02days on market $150,000 Active 345 DOM
-
2026-06-01days on market $150,000 Active 344 DOM
-
2026-05-31days on market $150,000 Active 343 DOM
-
2026-05-30days on market $150,000 Active 342 DOM
-
2026-04-08price $150,000
-
2026-01-02price $155,000
-
2025-08-01price $169,900
-
2025-07-10status Active
-
2025-05-07status Pending
-
2025-04-19$180,000 Active
-
2017-12-21soldstatus $160,100
-
2017-10-02historical
-
2017-06-05$179,900 Active
-
2017-05-28historical
-
2017-04-28status Active
-
2017-04-27historical
-
2017-04-19price $189,500
-
2017-02-18status Active
-
2017-02-06historical
-
2016-12-23price $194,000
-
2016-12-07price $199,500
-
2016-10-28$205,000 Active
-
2000-04-28soldstatus $97,000
-
1991-05-01soldstatus $80,000
ⓘ Source: listings_history table (triggers on properties + properties_extension) + one-shot
backfill from property_details.listing_events for pre-trigger history.
Tax reassessment forecast FL · Resets to sale price
- Current annual tax
- $4,248 · $354/mo
- Projected year-2 tax
- $4,248 · $354/mo
- Expected delta
- $0/yr ($0/mo · 0.0%)
ⓘ Screening estimate from a state-policy table — verify with the county assessor before closing.
Climate risk First Street
- Flood 9/10 Extreme FEMA zone AE · 99% chance over 30 yrs
- Wildfire 1/10 Low
- Heat 10/10 Extreme 7 d/yr ≥107°F today · 28 d/yr by 30 yrs out
- Wind 10/10 Extreme 99% chance of damaging wind over 30 yrs
- Air quality 3/10 Moderate 2 unhealthy d/yr today · 2 by 30 yrs out
Nearby sold comps map
Loading sold comps map…
Walkable amenities ~0.75 mi
Loading nearby amenities…
Taxation est. · year 1
- Rental income
- $37,209
- − Mortgage interest
- −$8,682
- − Property taxes
- −$4,248
- − Insurance
- −$5,894
- − Repairs & maintenance
- −$2,977
- − Management
- −$2,977
- − Depreciation
- −$4,509
- Taxable income
- $7,923
- Est. tax owed @ 24.0%
- −$1,901
- After-tax cash flow
- $7,598/yr
For passive investors: Depreciation is non-cash, so a rental often shows a tax loss while cash-flowing — sheltering income. Rental losses are passive: they offset passive income freely, and up to $25,000/yr can offset ordinary (W-2) income if you actively participate and your MAGI is under $100k (phasing out to $0 by $150k); unused losses carry forward. On sale, claimed depreciation is recaptured at up to 25%, and gains may owe capital-gains tax (a 1031 exchange can defer both). Figures are a year-1 estimate at your 24.0% rate — not tax advice; consult a CPA.
Schools (NCES district)
- District
- Charlotte
- NCES district ID
- 1200240
- Math proficiency
- 54% ▼ -6.00%
- Reading proficiency
- 54% ▼ -1.00%
- Median HH income
- $44,864
- Composite
- 45.62/100
- National rank
- #2586
- State rank
- #22 of 73 in FL
Livability — Port Charlotte
- Score
- 65/100
- State rank
- #655
- US rank
- #13081
Category grades
Schools grade is shown separately in the Schools card above.
Census & demographics
- Census place
- Port Charlotte, FL
- County
- Charlotte County · 196,994 people
- City population
- 102,180
- Metro
- Punta Gorda, FL
- Population (ZIP)
- 35,231
- Household income
- $61,382
- Rent vs Own
- Severe rent burden
- 733.0
Population outlook (Charlotte County) Hauer SSP2
- Today (2025)
- 198,646 people
- By 2030
- 210,507 · +6.0%
- By 2040
- 230,857 · +16.2%
- By 2050
- 247,148 · +24.4%
- By 2075
- 281,777 · +41.8%
- By 2100
- 293,609 · +47.8%
Race, ethnicity, and origin ACS 2023
- Neighborhood character
- Predominantly White (76%)
- Race & ethnicity
- White 76% Hispanic / Latino 14% Two or more races 8% Black 6% Asian 2%
- Hispanic origin (detail)
- Mexican 2% Puerto Rican 3% Cuban 2%
- Common ancestry
- Lithuanian 2% Romanian 2% Italian 2%
- Foreign-born
- 12% · Canada, Vietnam
- Languages at home
- 85% English-only · Spanish 10% French/Haitian/Cajun 1% Russian/Polish/Slavic 1%
Political lean MEDSL · Charlotte
- 2024 margin
- Solid R (+34.0) · D 32.7% · R 66.7%
- 2008→2024 swing
- -26.7pp toward R · 2008: -7.2pp · 2024: -34.0pp
- All cycles
- 2024: R+34.0 2020: R+26.6 2016: R+27.8 2012: R+14.3 2008: R+7.2
Not yet ingested
- Civics
- —
Market trends
- HPI YoY
- ▼ -17.18%
- Current HPI
- 339.0932
- Rent YoY
- ▼ -1.35%
- Metro
- Punta Gorda, FL
- State GDP YoY
- ▲ 3.28%
- F500 in state
- 36
Industry mix (Fortune 500 HQ in FL)
| Industry | F500 HQs | Revenue |
|---|---|---|
| Industrial Technology | 2 | $29B |
|
||
| Insurance | 2 | $17B |
|
||
| Retail | 1 | $60B |
|
||
| Technology Distribution | 1 | $58B |
|
||
| Homebuilding | 1 | $35B |
|
||
| Technology Manufacturing | 1 | $35B |
|
||
Price history
+87.5% since first listed20 events — show timeline
- 2026-04-08 Price Changed $150,000 Stellar MLS as Distributed by MLS Grid
- 2026-01-02 Price Changed $155,000 Stellar MLS as Distributed by MLS Grid
- 2025-08-01 Price Changed $169,900 Stellar MLS as Distributed by MLS Grid
- 2025-07-10 Relisted — Stellar MLS as Distributed by MLS Grid
- 2025-05-07 Pending — Stellar MLS as Distributed by MLS Grid
- 2025-04-19 Listed $180,000 Stellar MLS as Distributed by MLS Grid
- 2017-12-21 Sold (Public Records) $160,100 Public Records
- 2017-10-02 Listing Removed — Stellar MLS as Distributed by MLS Grid
- 2017-06-05 Listed $179,900 Stellar MLS as Distributed by MLS Grid
- 2017-05-28 Listing Removed — Stellar MLS as Distributed by MLS Grid
- 2017-04-28 Relisted — Stellar MLS as Distributed by MLS Grid
- 2017-04-27 Listing Removed — Stellar MLS as Distributed by MLS Grid
- 2017-04-19 Price Changed $189,500 Stellar MLS as Distributed by MLS Grid
- 2017-02-18 Relisted — Stellar MLS as Distributed by MLS Grid
- 2017-02-06 Listing Removed — Stellar MLS as Distributed by MLS Grid
- 2016-12-23 Price Changed $194,000 Stellar MLS as Distributed by MLS Grid
- 2016-12-07 Price Changed $199,500 Stellar MLS as Distributed by MLS Grid
- 2016-10-28 Listed $205,000 Stellar MLS as Distributed by MLS Grid
- 2000-04-28 Sold (Public Records) $97,000 Public Records
- 1991-05-01 Sold (Public Records) $80,000 Public Records
Property tax history
+6.9%/yrLatest (2025): $4,248 · -0.3% YoY. Source: county tax records.
Cash-flow waterfall
monthlySold comps — $/sqft
last 12 mo · ≤1 miLoading sold comps…