3421 Pullman Ct SE · Gaines, MI
Flood risk No data
- FEMA flood zone
- —
- Chance of flooding over 30 yrs
- —
- Est. flood insurance / yr
- —
Fire risk No data
- Est. fire insurance / yr
- —
Heat risk No data
- Hot days now (above threshold)
- —
- Hot days in 30 yrs
- —
Wind risk No data
- Chance of severe wind over 30 yrs
- —
Air-quality risk No data
- Unhealthy air days now
- —
- Unhealthy air days in 30 yrs
- —
Risk factors via First Street. Map © Google.
Why this score? — see what drove the A- grade
The composite is a weighted blend of 9 inputs, each scored 0–100. Each bar is that input's sub-score; the figure is the points it added to the 100-point composite (weight × sub-score).
- Cash flow +30.0/30.0
- ARV discount +15.0/15.0
- 1% rule +10.0/10.0
- DSCR +10.0/10.0
- Schools +5.6/10.0
- Condition / age +4.0/5.0
- Livability +3.0/5.0
- Rent growth +2.5/5.0
- Appreciation +0.0/10.0
$70,000
🖨 Deal sheet 📄 Offer letter ✓ Due diligence
Listing remarks MLS
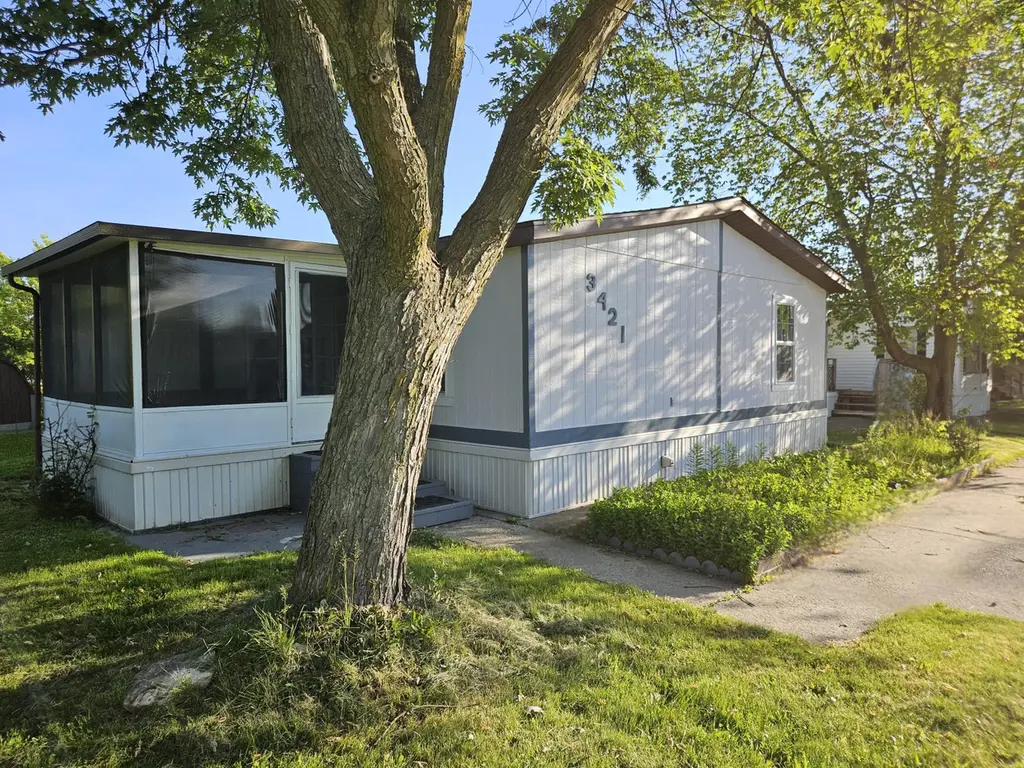
This manufactured home is located at the end of a quiet cul- de-sac in in Dutton Mill Estates. Open floorplan home with many updates. This Fairmont manufactured home offers 3 bedrooms and 2 full baths. Kitchen is very open with new cabinets and countertops. Extra-large dining area with a slider door to the side yard. Primary bedroom has a walk-in closet and an ensuite bathroom that has recently been remodeled. Two other bedrooms are on the opposite side of the home along with the guest bathroom. Laundry area is near the rear entrance and includes a newer washer & dryer. New vinyl flooring throughout entire home in 2021. New insulated windows (2025), new roof (2020, new water heater (2023), new under home insulation. Call or click today!
Key facts
- Quiet cul-de-sac
- Walk-in closet
- Open floorplan
Tags
Property features AI
Finance
- HOA & community: Monthly association fee of 750; Association covers water and trash; Community fitness center; Playground
Exterior
- Utilities: Public water; Natural gas water heater
- Home design: Ranch-style residence; Single-story (ranch)
- Construction: Built in 1983; Vinyl siding
- Exterior features: Leased land; Located on a cul-de-sac
Interior
- Kitchen: Range; Refrigerator
- Bedrooms: Primary bedroom; Bedroom 2; Bedroom 3
- Bathrooms: 2 full bathrooms
- Heating & cooling: Forced air heating
- Interior features: Eat-in kitchen; Window treatments; Recreation room
- Laundry & utility: Washer; Dryer; Crawl space basement
Neighborhood map
What this means for you Summary
Snapshot
- This is a 3-bed/2.0-bath manufactured listed at $70k. Condition is rated good.
Deal economics
- At list price, monthly cash flow is $478 ($6k/yr) — positive.
- The deal already cash-flows at list — no discount required.
- Meets the 1% rule at list price ($2k rent vs $70k).
- Recommended offer: $69k (1.5% below list) — sets the bar for market timing.
- Cap rate 14.5% vs local median 2.7% in Gaines — top-decile yield for the area; either an underpriced asset or a hidden risk that comps aren't pricing in. Stress-test before assuming the spread holds.
Location & tenants
- Location reads 60/100 on livability (#583 in MI) — a middle-class / working-renter tenant base. Strengths: cost of living A+, housing A+; Watch: schools D+, employment D, crime F.
- Caledonia Community Schools (suburban): math 58% / reading 68% proficiency, ranked #26 of 540 in MI (top 5%) — acceptable for families but not a draw, mixed tenant base, ~2y average lease; only 13% free/reduced lunch — higher-income household profile.
- Market conditions: 253 active listings in the ZIP; 4 comparable units currently listed for rent nearby; rentals lingering (median 44d on market — plan ~5-8 weeks vacancy on turnover, expect pricing pressure); 50% of comp listings sitting > 30 days — soft ceiling on asking rent; solid renter incomes; 2,253 units permitted in Kent County in 2024 (969 in 5+ unit buildings).
Forward outlook
- Local home prices are declining (-3.0%/yr); year-one equity from $484 of loan paydown is wiped out by about $2k of value loss. Plan a longer hold.
- Kent County population projected at +22% by 2050 — long-run rental-demand tailwind backs the buy-and-hold thesis.
- At projected returns (-3.0% appreciation + 3.0% rent growth), your $20k cash investment doubles in ~5 years — after that, you're playing with house money.
Negotiation context
- It's been on market 17 days — a 2% lower offer ($69k) is reasonable based on typical stale-listing flexibility.
- 9 sale attempts with the ask held roughly flat each time — persistent listings suggest the price (not the market) is what's stuck; bring a comps-based counter.
Risks & watch-outs
- Watch-outs: HOA is 35% of rent.
Questions for the listing agent
- What does the HOA fee cover, when was the last increase, and are there any pending special assessments or reserve-fund shortfalls?
- Is there a deadline driving the sale (1031 exchange, divorce, estate, relocation)? That informs how much negotiation room exists.
- Schools are D-rated, which usually means shorter tenancies and higher turnover. Who's the typical renter profile here, and what's been the actual vacancy rate?
- Crime grade is F in this area — have there been break-ins, vandalism, or insurance claims at this property in the last 3 years? What carrier currently insures it and at what premium?
- What's the average days-on-market for RENTAL listings here right now (not sales)? A rising rental-DOM trend means longer vacancies and softer asking-rent achievability than the comps imply.
- What's the recent tenant-quality profile in this submarket — average credit score on applications, eviction rate, late-payment / NSF rate, and stable-employment percentage? A property-management company in the area should have these aggregated.
- How much new for-sale + rental construction is in the pipeline within 1–3 miles? Heavy new supply typically softens prices + rents 12–24 months out; constrained supply supports both.
Investment metrics
- 1% rule
- 3.10% ✓
- Cap rate
- 14.48%
- Cash-on-cash
- 29.26%
- DSCR
- 2.30
- GRM
- 2.7
CMA / ARV
- ARV (on-the-fly)
- $84,095
- Comps found
- 2
Show comp detail 2 sales within ~0.75 mi
| Address | Dist | Beds/Ba | Sqft | Sold | Price | $/sf | Match |
|---|---|---|---|---|---|---|---|
| 6633 Millstone Dr SE | 0.18mi | 3/2.0 | 1,450 (-5%) | 11mo | $80,000 | $55 | 74 |
| 6648 Millstone Dr SE | 0.17mi | 3/2.0 | 1,365 (-11%) | 2mo | $74,900 | $55 | 73 |
Match score weights: distance 35% · size 25% · config 20% · recency 20%. Top-matched comps best support the ARV.
Projected returns pro-forma
-3.0% appreciation · 3.0% rent growth · sell at horizon
- IRR
- 24.1%
- Equity multiple
- 2.00×
- Total profit
- $19,586
- Equity at exit
- $10,437
- IRR
- 32.2%
- Equity multiple
- 3.97×
- Total profit
- $58,250
- Equity at exit
- $6,052
Cash invested: $19,600 (down + closing). Projections, not guarantees.
Landlord ↔ Tenant lean methodology
- Overall (STATE)
- 62 Landlord-Friendly
- State Michigan
- 62 Landlord-Friendly · EVEN
- County
- — inherits STATE
- City
- — inherits STATE
ZIP-level market 49316
- Home prices YoY
- -33.4%
- Active inventory
- 253
- Price-to-rent
- 2.7×
Monthly cashflow live
- Estimated rent
- $2,167 medium interval (Pro) →
- Mortgage (P&I)
- −$367
- Tax est. 1.5%
- −$88 /mo · $1,050/yr
- Insurance
- −$29
- HOA
- −$750
- Vacancy / Maint / Mgmt
- −$455
- Net cashflow
- $478
Break-even live
UW: 25.0% down · 7.5% · 30yr · 1.5% tax · 5.0% vac · 8.0% maint · 8.0% mgmt
Financing live
Cash to close
- Down payment
- $17,500
- Closing costs
- $2,100
- Reserves months
- —
- Total cash needed
- —
Loan-product check · same deal, 3 products live
Conventional
25% down · 7.5% · 30yr
- Down + closing
- —
- Monthly P&I
- —
- Monthly cashflow
- —
- DSCR
- —
- Eligible?
- —
Personal DTI + credit; lowest rate.
DSCR
20% down · 8.5% · 30yr
- Down + closing
- —
- Monthly P&I
- —
- Monthly cashflow
- —
- DSCR
- —
- Eligible?
- —
No personal income docs; deal must DSCR.
Hard money
10% down · 12.0% · 12mo
- Down + closing
- —
- Monthly P&I
- —
- Monthly cashflow
- —
- DSCR
- —
- Eligible?
- —
Short-term bridge; refi at stabilization.
Rent comps 4 comps
| Address | Beds | Baths | Sqft | Rent | $/sqft | DOM | Units | Dist |
|---|---|---|---|---|---|---|---|---|
| 3564 68th St SE Caledonia, MI | 4.0 | 1.0 | 1900 | $2,195 | $1.16 | 44d | 1 | 0.24mi |
| 6901 Hammond Ave SE Unit C Caledonia, MI | 4.0 | 1.0 | 1355 | $1,795 | $1.32 | 44d | 1 | 0.28mi |
| 3684 Merriville Ct Unit 1 Caledonia, MI | 4.0 | 3.5 | 1988 | $2,900 | $1.46 | 23d | 1 | 0.69mi |
| 6026 E Fieldstone Hills Dr SE #2 Caledonia, MI | 2.0 | 2.0 | 1300 | $1,800 | $1.38 | 3d | 1 | 0.89mi |
HOA detail
- Monthly dues
- $750 · $9,000/yr
- Likely covers
- water
Listing history 12 events
-
2026-06-16status $70,000 Pending 17 DOM
-
2026-06-15days on market $70,000 Active 17 DOM
-
2026-06-14days on market $70,000 Active 15 DOM
-
2026-06-13days on market $70,000 Active 14 DOM
-
2026-06-10days on market $70,000 Active 12 DOM
-
2026-06-09days on market $70,000 Active 11 DOM
-
2026-06-08days on market $70,000 Active 10 DOM
-
2026-06-07days on market $70,000 Active 9 DOM
-
2026-06-03days on market $70,000 Active 5 DOM
-
2026-06-03days on market $70,000 Active 4 DOM
-
2026-06-01days on market $70,000 Active 3 DOM
-
2026-05-31days on market $70,000 Active 2 DOM
ⓘ Source: listings_history table (triggers on properties + properties_extension) + one-shot
backfill from property_details.listing_events for pre-trigger history.
Nearby sold comps map
Loading sold comps map…
Walkable amenities ~0.75 mi
Loading nearby amenities…
Taxation est. · year 1
- Rental income
- $25,999
- − Mortgage interest
- −$3,921
- − Property taxes
- −$1,050
- − Insurance
- −$350
- − Repairs & maintenance
- −$2,080
- − Management
- −$2,080
- − HOA
- −$9,000
- − Depreciation
- −$2,036
- Taxable income
- $5,482
- Est. tax owed @ 24.0%
- −$1,316
- After-tax cash flow
- $4,419/yr
For passive investors: Depreciation is non-cash, so a rental often shows a tax loss while cash-flowing — sheltering income. Rental losses are passive: they offset passive income freely, and up to $25,000/yr can offset ordinary (W-2) income if you actively participate and your MAGI is under $100k (phasing out to $0 by $150k); unused losses carry forward. On sale, claimed depreciation is recaptured at up to 25%, and gains may owe capital-gains tax (a 1031 exchange can defer both). Figures are a year-1 estimate at your 24.0% rate — not tax advice; consult a CPA.
Condition & rehab AI · 12 photos
This well-maintained manufactured home offers a good condition with recent updates and a good curb appeal. It is ready for a new owner or renter to move in.
Value-add opportunities
- Both Paint exterior and interior — Enhances curb appeal and interior aesthetics.
- Both Replace air conditioning unit — Improves comfort and energy efficiency, attracting buyers/renters.
- Both Install smart home features — Enhances home's modern appeal and convenience for buyers/renters.
- Both Landscaping improvements — Enhances curb appeal and adds value to the property.
Renovation cost estimate screening
Value-add ROI direction
- Both Paint exterior and interior — Enhances curb appeal and interior aesthetics. ↑
- Both Replace air conditioning unit — Improves comfort and energy efficiency, attracting buyers/renters. ↑
- Both Install smart home features — Enhances home's modern appeal and convenience for buyers/renters. ↑
- Both Landscaping improvements — Enhances curb appeal and adds value to the property. ↑
ⓘ Cost ranges are severity-bucket heuristics (US national rule-of-thumb). Get contractor quotes + a written scope before underwriting a rehab budget.
Schools (NCES district)
- District
- Caledonia Community Schools
- NCES district ID
- 2607620
- Math proficiency
- 58% ▲ 2.00%
- Reading proficiency
- 68% ▲ 1.00%
- Median HH income
- $75,649
- Composite
- 55.98/100
- National rank
- #1196
- State rank
- #26 of 540 in MI
Livability — Gaines
- Score
- 60/100
- State rank
- #583
- US rank
- #18809
Category grades
Schools grade is shown separately in the Schools card above.
Census & demographics
- County
- Kent County · 533,805 people
- City population
- 26,427
- Metro
- Grand Rapids-Kentwood, MI
- Population (ZIP)
- 26,427
- Household income
- $103,238
- Rent vs Own
- Severe rent burden
- 96.0
Population outlook (Kent County) Hauer SSP2
- Today (2025)
- 712,484 people
- By 2030
- 748,618 · +5.1%
- By 2040
- 814,777 · +14.4%
- By 2050
- 868,556 · +21.9%
- By 2075
- 966,487 · +35.7%
- By 2100
- 967,975 · +35.9%
Race, ethnicity, and origin ACS 2023
- Neighborhood character
- Predominantly White (82%)
- Race & ethnicity
- White 82% Two or more races 8% Hispanic / Latino 7% Asian 5% Black 2%
- Hispanic origin (detail)
- Mexican 2%
- Common ancestry
- Iranian 21% Romanian 7% Slovak 2%
- Foreign-born
- 7% · Canada, Vietnam, China
- Languages at home
- 92% English-only · Spanish 2% Vietnamese 2% Chinese 1%
Political lean MEDSL · Kent
- 2024 margin
- Lean D (+5.4) · D 51.8% · R 46.5% · Other 1.7%
- 2008→2024 swing
- +4.8pp toward D · 2008: 0.5pp · 2024: 5.4pp
- All cycles
- 2024: D+5.4 2020: D+6.1 2016: R+3.1 2012: R+7.9 2008: D+0.5
Not yet ingested
- Civics
- —
Market trends
- HPI YoY
- ▼ -117.75%
- Current HPI
- 235.3555
- Rent YoY
- —
- Metro
- Grand Rapids-Kentwood, MI
- State GDP YoY
- ▲ 1.37%
- F500 in state
- 28
Industry mix (Fortune 500 HQ in MI)
| Industry | F500 HQs | Revenue |
|---|---|---|
| Automotive Parts | 3 | $48B |
|
||
| Automotive | 2 | $372B |
|
||
| Chemicals | 1 | $45B |
|
||
| Automotive Retail | 1 | $29B |
|
||
| Healthcare / Medical Devices | 1 | $23B |
|
||
| Automotive Technology | 1 | $20B |
|
||
Price history
-17.6% since first listed18 events — show timeline
- 2026-05-28 Listed $70,000 SW Michigan MLS
- 2026-05-28 Listed $70,000 REALCOMP
- 2026-05-28 Listed $70,000 MiRealSource-MiMLS
- 2026-04-28 Listing Removed — REALCOMP
- 2026-04-28 Listing Removed — MiRealSource-MiMLS
- 2026-04-08 Relisted — REALCOMP
- 2026-04-08 Relisted — MiRealSource-MiMLS
- 2026-04-08 Pending — REALCOMP
- 2026-04-08 Pending — MiRealSource-MiMLS
- 2026-04-07 Relisted — REALCOMP
- 2026-04-07 Relisted — MiRealSource-MiMLS
- 2026-04-02 Listing Removed — REALCOMP
- 2026-04-02 Listing Removed — MiRealSource-MiMLS
- 2026-04-01 Price Changed $77,900 MiRealSource-MiMLS
- 2026-04-01 Price Changed $77,900 REALCOMP
- 2026-04-01 Price Changed $77,900 SW Michigan MLS
- 2026-03-17 Listed $84,900 REALCOMP
- 2026-03-17 Listed $84,900 MiRealSource-MiMLS
Cash-flow waterfall
monthlySold comps — $/sqft
last 12 mo · ≤1 miLoading sold comps…