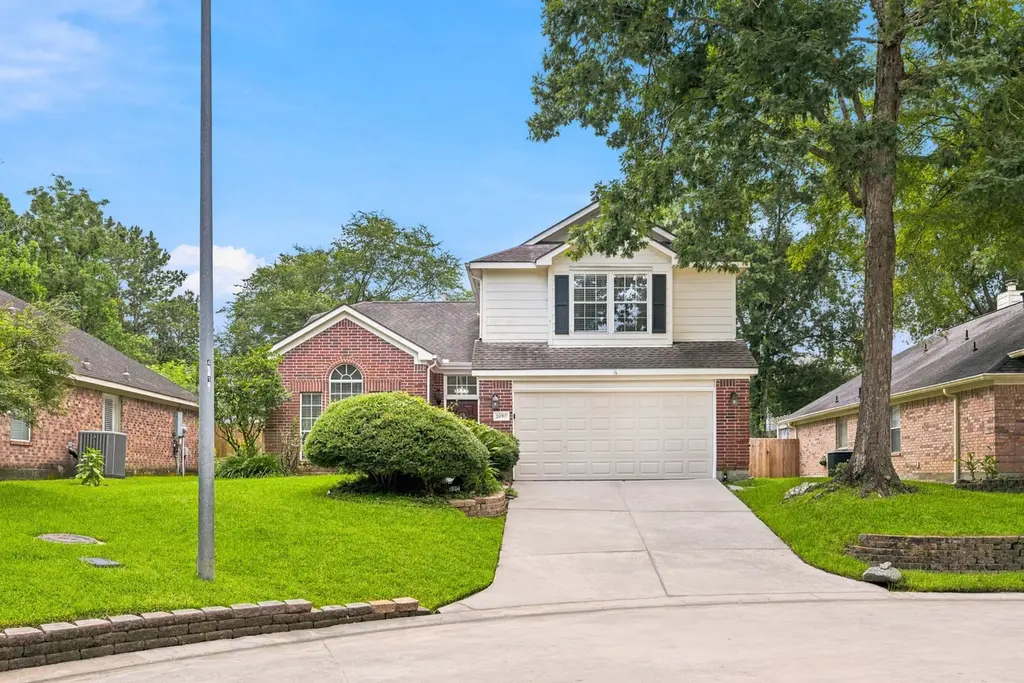
20707 Redbud Trl · Atascocita, TX
Flood risk 1/10 · Minimal
- FEMA flood zone
- X (unshaded)
- Chance of flooding over 30 yrs
- 0.0%
- Est. flood insurance / yr
- $507 – $1,088
Fire risk 1/10 · Minimal
- Est. fire insurance / yr
- $1,222 – $2,270
Heat risk 9/10 · Severe
- Hot days now (above 110°F)
- 7 days/yr
- Hot days in 30 yrs
- 24 days/yr
Wind risk 9/10 · Severe
- Chance of severe wind over 30 yrs
- 99.0%
Air-quality risk 3/10 · Minor
- Unhealthy air days now
- 3 days/yr
- Unhealthy air days in 30 yrs
- 3 days/yr
Risk factors via First Street. Map © Google.
Why this score? — see what drove the D- grade
The composite is a weighted blend of 9 inputs, each scored 0–100. Each bar is that input's sub-score; the figure is the points it added to the 100-point composite (weight × sub-score).
- ARV discount +9.3/15.0
- Cash flow +7.7/30.0
- Appreciation +4.5/10.0
- Schools +3.9/10.0
- Livability +3.5/5.0
- 1% rule +3.3/10.0
- Rent growth +2.5/5.0
- Condition / age +2.5/5.0
- DSCR +1.8/10.0
$285,000
🖨 Deal sheet (PDF) 📄 Offer letter ✓ Due diligence
Listing remarks MLS
Beautiful 4 bed 2.5 bath 1965 sq ft home with private pool & spa in Kings River Village cul-de-sac offers formal dining, 2 living areas, granite countertops, stainless steel appliances, and breakfast nook. Primary bedroom located on main floor has dual vanities and a garden tub. Close to area amenities such as Lake Houston, walking trails, boat ramp, and fishing pier. Never flooded.
Key facts
- Private backyard
- 5,662 sq ft lot
- 2 garage spots
Tags
Property features AI
Finance
- HOA & community: Community managed by First Service Residential; Annual association fee of $535
Exterior
- Parking: Attached 2-car garage
- Utilities: Public water; Public sewer
- Home design: Residential property; Built in 1995; Slab foundation
- Construction: Brick and cement siding construction; Composition roof
- Exterior features: Private in-ground pool; Located in a cul-de-sac within a subdivision
Interior
- Kitchen: Gas oven and gas range; Dishwasher; Microwave; Disposal
- Bedrooms: Primary bedroom on the first floor (16x13); Three additional bedrooms on the second floor (11x10, 11x12, 11x10)
- Flooring: Laminate flooring; Tile flooring
- Bathrooms: Two full bathrooms; One half bathroom
- Heating & cooling: Central heating (gas); Central air (electric)
- Interior features: One fireplace; Washer hookup and electric dryer hookup; Dishwasher, Disposal, Gas Oven, Gas Range, Microwave; Laminate and tile flooring; Seven total rooms
- Laundry & utility: Washer hookup; Electric dryer hookup
Neighborhood map
What this means for you Summary
Snapshot
- This is a 4-bed/2.5-bath single-family listed at $285k.
Deal economics
- At list price, monthly cash flow is $-326 ($-4k/yr) — negative.
- To cash-flow at today's rent, offer at most $227k (20.2% below list).
- To meet the 1% rule (rent ≥ 1% of price), the offer needs to be $238k (16.6% below list).
- Recommended offer: $227k (20.2% below list) — sets the bar for cash-flow.
- Cap rate 4.9% vs local median 4.0% in Atascocita — meaningfully above typical; check what's discounted (condition, days-on-market, listing class) to confirm the premium yield is real.
Location & tenants
- Location reads 70/100 on livability (#346 in TX) — a middle-class / working-renter tenant base. Strengths: employment A+, cost of living A+, housing A+; Watch: amenities F, commute F, health & safety F.
- Humble ISD (urban): math 38% / reading 44% proficiency, ranked #262 of 826 in TX (top 32%) — families likely to look elsewhere, expect single-tenant / working-renter base with shorter leases.
- Zoned schools: Greentree El (math 51% / reading 54%, grade C-, #720 of 4,322 statewide, top 17%, 674 students, 23% FRL); Creekwood Middle (math 49% / reading 50%, grade C, #356 of 1,662 statewide, top 23%, 1,149 students, 21% FRL); Humble H S (math 15% / reading 31%, grade F, #1,348 of 1,632 statewide, top 83%, 2,867 students, 77% FRL).
- Market conditions: Rents flat; 682 active listings in the ZIP; 19 comparable units currently listed for rent nearby; rentals at typical pace (median 24d on market — plan ~3-4 weeks tenant-placement turnaround); 42% of comp listings sitting > 30 days — soft ceiling on asking rent; high-income renter base; 29,883 units permitted in Harris County in 2024 (8,621 in 5+ unit buildings).
Forward outlook
- Local home prices are declining (-0.9%/yr); year-one equity from $2k of loan paydown is wiped out by about $3k of value loss. Plan a longer hold.
- Harris County population projected at +47% by 2050 — long-run rental-demand tailwind backs the buy-and-hold thesis.
Negotiation context
- Only 2 days on market — expect competitive offers; lowballing is unlikely to land.
- 6 sale attempts since 13y ago with the ask held roughly flat each time — persistent listings suggest the price (not the market) is what's stuck; bring a comps-based counter.
Risks & watch-outs
- Climate carrying-cost: severe wind risk, 99% chance of damaging wind over 30y; extreme-heat days projected 7→24/yr by 2055 (HVAC capex compounding) — expect insurance premiums to compound above CPI over the hold.
Questions for the listing agent
- What do current leases actually rent for vs. the listed asking? Can we see a recent rent roll and the last 12 months of T-12 income?
- What does the HOA fee cover, when was the last increase, and are there any pending special assessments or reserve-fund shortfalls?
- Is there a deadline driving the sale (1031 exchange, divorce, estate, relocation)? That informs how much negotiation room exists.
- The area grade is low — what's the realistic commute time and amenity access for the typical tenant pool here? Any planned neighborhood developments (good or bad) we should know about?
- What's the average days-on-market for RENTAL listings here right now (not sales)? A rising rental-DOM trend means longer vacancies and softer asking-rent achievability than the comps imply.
- What's the recent tenant-quality profile in this submarket — average credit score on applications, eviction rate, late-payment / NSF rate, and stable-employment percentage? A property-management company in the area should have these aggregated.
- How much new for-sale + rental construction is in the pipeline within 1–3 miles? Heavy new supply typically softens prices + rents 12–24 months out; constrained supply supports both.
Investment metrics
- 1% rule
- 0.83% ✗
- Cap rate
- 4.92%
- Cash-on-cash
- -4.91%
- DSCR
- 0.78
- GRM
- 10.0
CMA / ARV
- ARV (on-the-fly)
- $296,715
- Comps found
- 12
Show comp detail 12 sales within ~0.75 mi
| Address | Dist | Beds/Ba | Sqft | Sold | Price | $/sf | Match |
|---|---|---|---|---|---|---|---|
| 19835 Emerald Bend Way | 0.40mi | 4/2.5 | 1,989 (+1%) | 1mo | $264,390 | $133 | 79 |
| 19827 Emerald Bend Way | 0.39mi | 4/2.5 | 1,989 (+1%) | 2mo | $298,840 | $150 | 78 |
| 19918 Emerald Bend Way | 0.46mi | 4/2.5 | 1,989 (+1%) | 1mo | $307,740 | $155 | 76 |
| 20923 Lake Park Trl Trl | 0.36mi | 4/2.0 | 2,056 (+5%) | 1mo | $285,000 | $139 | 72 |
| 20507 Delta Wood Trl | 0.14mi | 3/2.0 (-1) | 2,164 (+10%) | 0mo | $320,000 | $148 | 69 |
| 7410 Crown Maples Dr | 0.47mi | 3/2.5 (-1) | 2,011 (+2%) | 2mo | $377,650 | $188 | 67 |
| 19834 Emerald Bend Way | 0.42mi | 3/2.5 (-1) | 2,107 (+7%) | 2mo | $304,490 | $145 | 62 |
| 20310 Umber Oak Ct | 0.30mi | 3/2.0 (-1) | 2,148 (+9%) | 2mo | $324,900 | $151 | 62 |
| 19831 Emerald Bend Way | 0.40mi | 3/2.5 (-1) | 1,727 (-12%) | 2mo | $284,140 | $165 | 55 |
| 19839 Emerald Bend Way | 0.40mi | 3/2.5 (-1) | 1,727 (-12%) | 2mo | $268,140 | $155 | 54 |
| 19823 Emerald Bend Way | 0.39mi | 3/2.5 (-1) | 1,727 (-12%) | 3mo | $272,140 | $158 | 54 |
| 20215 Glen Burn Ct | 0.65mi | 4/2.5 | 2,209 (+12%) | 0mo | $299,900 | $136 | 49 |
Match score weights: distance 35% · size 25% · config 20% · recency 20%. Top-matched comps best support the ARV.
Projected returns pro-forma
-0.95% appreciation · 0.09% rent growth · sell at horizon
- IRR
- -14.4%
- Equity multiple
- 0.40×
- Total profit
- $-48,226
- Equity at exit
- $69,423
- IRR
- -10.6%
- Equity multiple
- 0.12×
- Total profit
- $-70,367
- Equity at exit
- $73,435
Cash invested: $79,800 (down + closing). Projections, not guarantees.
Landlord ↔ Tenant lean methodology
- Overall (STATE)
- 87 Strongly Landlord-Friendly
- State Texas
- 87 Strongly Landlord-Friendly · R+5
- County
- — inherits STATE
- City
- — inherits STATE
ZIP-level market 77346
- Home prices YoY
- -0.4%
- Rents YoY
- 0.1%
- Active inventory
- 682
- Price-to-rent
- 10.0×
Monthly cashflow live
- Estimated rent
- $2,376 high interval (Pro) →
- Mortgage (P&I)
- −$1,495
- Tax from tax record
- −$545 /mo · $6,540/yr
- Insurance
- −$119
- HOA
- −$45
- Vacancy / Maint / Mgmt
- −$499
- Net cashflow
- $-326
Break-even live
Sensitivity live
| Price | -10% $-165 | -5% $-246 | +0% $-326 | +5% $-407 | +10% $-488 |
|---|---|---|---|---|---|
| Rent | -10% $-514 | -5% $-420 | +0% $-326 | +5% $-232 | +10% $-138 |
| Rate | -1.0pp $-183 | -0.5pp $-254 | base $-326 | +0.5pp $-400 | +1.0pp $-475 |
UW: 25.0% down · 7.5% · 30yr · 1.5% tax · 5.0% vac · 8.0% maint · 8.0% mgmt
Financing live
Cash to close
- Down payment
- $71,250
- Closing costs
- $8,550
- Reserves months
- —
- Total cash needed
- —
Loan-product check · same deal, 3 products live
Conventional
25% down · 7.5% · 30yr
- Down + closing
- —
- Monthly P&I
- —
- Monthly cashflow
- —
- DSCR
- —
- Eligible?
- —
Personal DTI + credit; lowest rate.
DSCR
20% down · 8.5% · 30yr
- Down + closing
- —
- Monthly P&I
- —
- Monthly cashflow
- —
- DSCR
- —
- Eligible?
- —
No personal income docs; deal must DSCR.
Hard money
10% down · 12.0% · 12mo
- Down + closing
- —
- Monthly P&I
- —
- Monthly cashflow
- —
- DSCR
- —
- Eligible?
- —
Short-term bridge; refi at stabilization.
Rent comps 19 comps
| Address | Beds | Baths | Sqft | Rent | $/sqft | DOM | Units | Dist |
|---|---|---|---|---|---|---|---|---|
| 20707 Redbud Trl Humble, TX | 3.0 | 2.5 | 1965 | $2,450 | $1.25 | 24d | 1 | 0.01mi |
| 6731 Auburn Oak Trl Humble, TX | 3.0 | 2.5 | 2433 | $2,345 | $0.96 | 24d | 1 | 0.10mi |
| 20823 Water Point Trl Humble, TX | 4.0 | 3.5 | 2550 | $2,525 | $0.99 | 24d | 1 | 0.17mi |
| 20618 Carmine Oak Ct Humble, TX | 3.0 | 2.0 | 2087 | $2,195 | $1.05 | 45d | 1 | 0.26mi |
| 20906 Greenfield Trl Humble, TX | 4.0 | 3.0 | 2603 | $2,200 | $0.85 | 45d | 1 | 0.27mi |
| 20914 Lake Park Trl Humble, TX | 5.0 | 2.5 | 2462 | $2,460 | $1.00 | 7d | 1 | 0.33mi |
| 6519 Kings Glen Dr Humble, TX | 1.0–3.0 | 1.0–2.5 | 1255 | $2,813 | $2.24 | 0d | 14 | 0.43mi |
| 6227 Spruce Bough Ct Humble, TX | 3.0 | 2.0 | 1432 | $1,800 | $1.26 | 45d | 1 | 0.85mi |
| 18835 Atasca Oaks Dr Humble, TX | 3.0 | 2.0 | 1432 | $1,829 | $1.28 | 7d | 1 | 1.04mi |
| 19902 Burle Oak Dr Humble, TX | 3.0 | 2.5 | 1532 | $1,699 | $1.11 | 45d | 1 | 1.09mi |
| 20143 Dawn Mist Dr Humble, TX | 3.0 | 2.5 | 1617 | $1,659 | $1.03 | 45d | 1 | 1.14mi |
| 20143 Dawn Mist Dr Humble, TX | 3.0 | 2.5 | 1617 | $1,659 | $1.03 | 0d | 1 | 1.14mi |
| 5419 Deer Timbers Trl Humble, TX | 3.0 | 2.0 | 1313 | $1,705 | $1.30 | 24d | 1 | 1.21mi |
| 20502 Spoonwood Dr Humble, TX | 3.0 | 2.0 | 2302 | $1,975 | $0.86 | 45d | 1 | 1.23mi |
| 4855 Magnolia Cove Dr Unit 3174 Kingwood, TX | 3.0 | 2.0 | 1259 | $1,830 | $1.45 | 13d | 1 | 1.28mi |
| 4855 Magnolia Cove Dr Unit 4888 Kingwood, TX | 3.0 | 2.0 | 1259 | $2,145 | $1.70 | 45d | 1 | 1.28mi |
| 4855 Magnolia Cove Dr Unit 3112 Kingwood, TX | 3.0 | 2.0 | 1259 | $1,779 | $1.41 | 0d | 1 | 1.28mi |
| 4920 Magnolia Cove Dr Unit 4953 Kingwood, TX | 3.0 | 2.0 | 1368 | $1,885 | $1.38 | 45d | 1 | 1.42mi |
| 7131 Maple Walk Dr Humble, TX | 3.0 | 2.0 | 1808 | $1,895 | $1.05 | 7d | 1 | 1.47mi |
HOA detail
- Monthly dues
- $45 · $540/yr
- Likely covers
- pool
Listing history 2 events
-
2026-06-21remarks 609-char remark
-
2026-06-21$285,000 Active 2 DOM
ⓘ Source: listings_history table (triggers on properties + properties_extension) + one-shot
backfill from property_details.listing_events for pre-trigger history.
Tax reassessment forecast TX · Resets to sale price
- Current annual tax
- $6,540 · $545/mo
- Projected year-2 tax
- $6,540 · $545/mo
- Expected delta
- $0/yr ($0/mo · 0.0%)
ⓘ Screening estimate from a state-policy table — verify with the county assessor before closing.
Climate risk First Street
- Flood 1/10 Low FEMA zone X (unshaded) · 0% chance over 30 yrs
- Wildfire 1/10 Low
- Heat 9/10 Extreme 7 d/yr ≥110°F today · 24 d/yr by 30 yrs out
- Wind 9/10 Extreme 99% chance of damaging wind over 30 yrs
- Air quality 3/10 Moderate 3 unhealthy d/yr today · 3 by 30 yrs out
Nearby sold comps map
Loading sold comps map…
Walkable amenities ~0.75 mi
Loading nearby amenities…
Taxation est. · year 1
- Rental income
- $28,514
- − Mortgage interest
- −$15,964
- − Property taxes
- −$6,540
- − Insurance
- −$1,425
- − Repairs & maintenance
- −$2,281
- − Management
- −$2,281
- − HOA
- −$540
- − Depreciation
- −$8,291
- Taxable loss
- −$8,809
- Est. tax savings @ 24.0%
- +$2,114
- After-tax cash flow
- $-1,800/yr
For passive investors: Depreciation is non-cash, so a rental often shows a tax loss while cash-flowing — sheltering income. Rental losses are passive: they offset passive income freely, and up to $25,000/yr can offset ordinary (W-2) income if you actively participate and your MAGI is under $100k (phasing out to $0 by $150k); unused losses carry forward. On sale, claimed depreciation is recaptured at up to 25%, and gains may owe capital-gains tax (a 1031 exchange can defer both). Figures are a year-1 estimate at your 24.0% rate — not tax advice; consult a CPA.
Schools (NCES district)
- District
- Humble ISD
- NCES district ID
- 4823910
- Math proficiency
- 38% ▼ -11.00%
- Reading proficiency
- 44% ▼ -7.00%
- Median HH income
- $83,946
- Composite
- 38.55/100
- National rank
- #4171
- State rank
- #262 of 826 in TX
Livability — Atascocita
- Score
- 70/100
- State rank
- #346
- US rank
- #7586
Category grades
Schools grade is shown separately in the Schools card above.
Census & demographics
- Census place
- Atascocita, TX
- County
- Harris County · 4,702,590 people
- City population
- 79,538
- Metro
- Houston-The Woodlands-Sugar Land, TX
- Population (ZIP)
- 79,538
- Household income
- $122,241
- Rent vs Own
- Severe rent burden
- 1072.0
Population outlook (Harris County) Hauer SSP2
- Today (2025)
- 5,571,493 people
- By 2030
- 6,089,821 · +9.3%
- By 2040
- 7,142,806 · +28.2%
- By 2050
- 8,185,864 · +46.9%
- By 2075
- 10,574,329 · +89.8%
- By 2100
- 12,109,958 · +117.4%
Race, ethnicity, and origin ACS 2023
- Neighborhood character
- Diverse neighborhood (Simpson 0.70)
- Race & ethnicity
- White 42% Hispanic / Latino 28% Black 21% Two or more races 18% Asian 4%
- Hispanic origin (detail)
- Mexican 20% Puerto Rican 2%
- Common ancestry
- Lithuanian 4% Slovak 1% Italian 1%
- Foreign-born
- 10% · Canada, Vietnam, China
- Languages at home
- 78% English-only · Spanish 17% Other Indo-European 1% German/W. Germanic 1%
Political lean MEDSL · Harris
- 2024 margin
- Lean D (+5.5) · D 52.0% · R 46.4% · Other 1.6%
- 2008→2024 swing
- +3.9pp toward D · 2008: 1.6pp · 2024: 5.5pp
- All cycles
- 2024: D+5.5 2020: D+13.3 2016: D+12.4 2012: D+0.1 2008: D+1.6
Not yet ingested
- Civics
- —
Market trends
- HPI YoY
- ▼ -0.95%
- Current HPI
- 218.0478
- Rent YoY
- ▲ 0.09%
- Metro
- Houston-The Woodlands-Sugar Land, TX
- State GDP YoY
- ▲ 3.95%
- F500 in state
- 110
Industry mix (Fortune 500 HQ in TX)
| Industry | F500 HQs | Revenue |
|---|---|---|
| Energy | 16 | $1,198B |
|
||
| Technology | 5 | $198B |
|
||
| Engineering / Construction | 4 | $72B |
|
||
| Energy Services | 3 | $60B |
|
||
| Utilities | 3 | $41B |
|
||
| Healthcare | 2 | $330B |
|
||
Price history
+57.5% since first listed33 events — show timeline
- 2026-06-19 Listed $285,000 HARMLS
- 2026-05-31 Rental Removed $2,450 TENANTTURNER2
- 2026-05-28 Rental Removed $2,450 HARMLS
- 2026-05-12 Price Changed $2,450 HARMLS
- 2026-05-10 Price Changed $2,450 TENANTTURNER2
- 2026-04-18 Price Changed $2,525 HARMLS
- 2026-04-18 Price Changed $2,525 TENANTTURNER2
- 2026-04-04 Listed for Rent $2,600 TENANTTURNER2
- 2026-04-03 Listed for Rent $2,600 HARMLS
- 2022-04-01 Sold (Public Records) — Public Records
- 2022-03-31 Sold (MLS) — HARMLS
- 2022-03-03 Pending — HARMLS
- 2022-02-22 Pending — HARMLS
- 2022-02-17 Listed $279,999 HARMLS
- 2017-10-25 Sold (Public Records) — Public Records
- 2017-10-15 Sold (MLS) — HARMLS
- 2017-10-09 Pending — HARMLS
- 2017-10-04 Pending — HARMLS
- 2017-09-26 Price Changed $216,999 HARMLS
- 2017-09-16 Price Changed $218,000 HARMLS
- 2017-08-22 Price Changed $224,999 HARMLS
- 2017-08-11 Listed $233,900 HARMLS
- 2013-10-16 Sold (Public Records) — Public Records
- 2013-10-10 Sold (MLS) — HARMLS
- 2013-09-13 Pending — HARMLS
- 2013-09-12 Pending — HARMLS
- 2013-09-04 Pending — HARMLS
- 2013-08-25 Price Changed $173,000 HARMLS
- 2013-08-03 Price Changed $178,000 HARMLS
- 2013-06-28 Listed $181,000 HARMLS
- 2002-04-03 Sold (Public Records) — Public Records
- 2002-04-03 Sold (Public Records) — Public Records
- 1997-04-30 Sold (Public Records) — Public Records
Property tax history
+6.8%/yrLatest (2025): $6,540 · +3.4% YoY. Source: county tax records.
Cash-flow waterfall
monthlySold comps — $/sqft
last 12 mo · ≤1 miLoading sold comps…