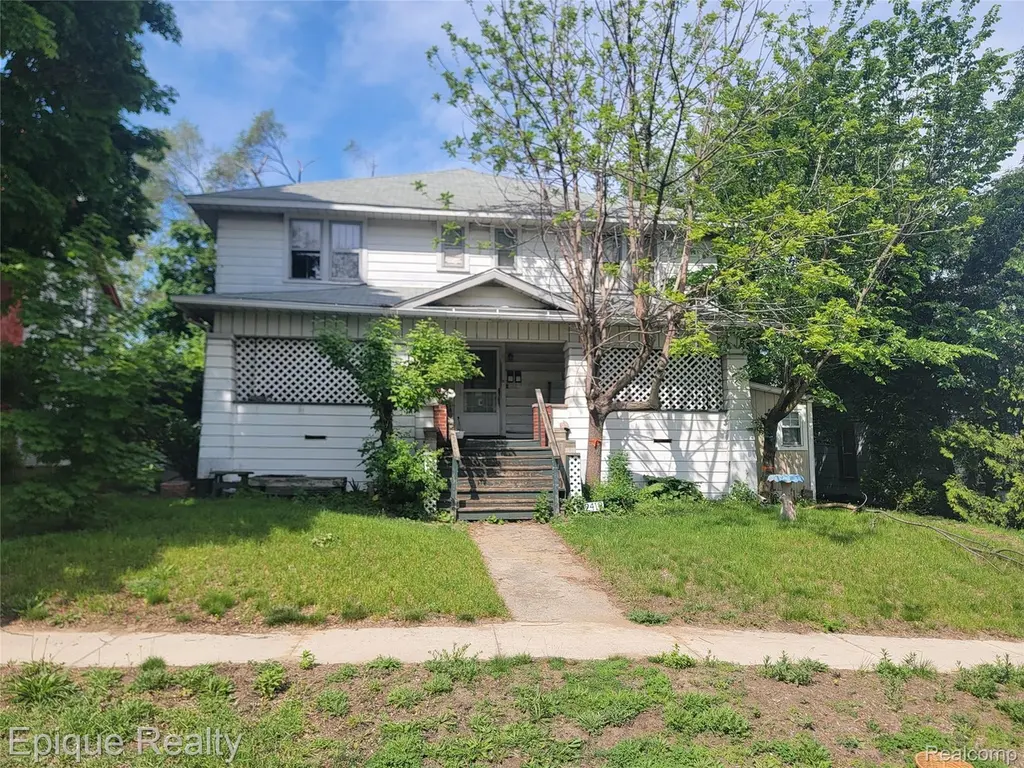
2419 North Blvd · Port Huron, MI
Flood risk 1/10 · Minimal
- FEMA flood zone
- X (unshaded)
- Chance of flooding over 30 yrs
- 0.0%
- Est. flood insurance / yr
- $473 – $860
Fire risk 1/10 · Minimal
- Est. fire insurance / yr
- $784 – $1,456
Heat risk 2/10 · Minimal
- Hot days now (above 99°F)
- 7 days/yr
- Hot days in 30 yrs
- 14 days/yr
Wind risk 1/10 · Minimal
- Chance of severe wind over 30 yrs
- —
Air-quality risk 3/10 · Minor
- Unhealthy air days now
- 2 days/yr
- Unhealthy air days in 30 yrs
- 3 days/yr
Risk factors via First Street. Map © Google.
Why this score? — see what drove the B- grade
The composite is a weighted blend of 9 inputs, each scored 0–100. Each bar is that input's sub-score; the figure is the points it added to the 100-point composite (weight × sub-score).
- Cash flow +30.0/30.0
- 1% rule +10.0/10.0
- DSCR +10.0/10.0
- ARV discount +7.5/15.0
- Rent growth +3.4/5.0
- Livability +3.2/5.0
- Schools +2.5/10.0
- Condition / age +2.5/5.0
- Appreciation +0.0/10.0
$100,000
🖨 Deal sheet (PDF) 📄 Offer letter ✓ Due diligence
Listing remarks MLS
INVESTOR OPPORTUNITY Rare multi-family investment property with strong income potential in Port Huron. Originally constructed as a 4-unit apartment building, all four units still exist; however, buyers are responsible for verifying permitted unit count and zoning compliance with the City of Port Huron. The property features two 2-bedroom units and two 1-bedroom units, offering excellent flexibility for long-term rental income and portfolio expansion. With solid rental potential and value-add opportunities, this property is ideal for investors, landlords, or rehab specialists seeking a multi-unit asset. Property is being sold strictly “As-Is, †and purchaser assumes the property in its current condition.
Key facts
- 6,098 sq ft lot
- Built 1912
- Listed 21 days
Property features AI
Finance
- Other: Pets allowed; Paved road access with alley frontage; Lot approximately 0.14 acres (50 x 120); Zoned residential
Exterior
- Utilities: Public water; Public sewer
- Home design: Multi-family residential property; Two stories
- Construction: Aluminum siding; Block foundation
- Exterior features: Covered porch
Interior
- Bathrooms: 4 full bathrooms
- Heating & cooling: Hot water heating (natural gas); No central air conditioning
- Interior features: Full unfinished walk-out basement
Neighborhood map
What this means for you Summary
Snapshot
- This is a 24-bed/16.0-bath single-family listed at $100k.
Deal economics
- At list price, monthly cash flow is $674 ($8k/yr) — positive.
- The deal already cash-flows at list — no discount required.
- Meets the 1% rule at list price ($2k rent vs $100k).
- Recommended offer: $98k (1.5% below list) — sets the bar for market timing.
- Cap rate 14.4% vs local median 4.6% in Port Huron — top-decile yield for the area; either an underpriced asset or a hidden risk that comps aren't pricing in. Stress-test before assuming the spread holds.
Location & tenants
- Location reads 65/100 on livability (#445 in MI) — a middle-class / working-renter tenant base. Strengths: cost of living A+, housing A+; Watch: amenities C-, health & safety D, schools F.
- Port Huron Area School District (suburban): math 23% / reading 37% proficiency, ranked #368 of 540 in MI (top 68%) — families likely to look elsewhere, expect single-tenant / working-renter base with shorter leases.
- Market conditions: Rents rising (+3.6%/yr); 220 active listings in the ZIP; 232 units permitted in St. Clair County in 2024 (0 in 5+ unit buildings).
- This rent runs 41% of the median local income ($53k/yr) — at the standard rent-burdened threshold; future hikes will face affordability resistance.
Forward outlook
- Local home prices are declining (-3.0%/yr); year-one equity from $691 of loan paydown is wiped out by about $3k of value loss. Plan a longer hold.
- St. Clair County population projected at -20% by 2050 — secular population decline; favor cash flow + early exit over multi-decade hold.
- At projected returns (-3.0% appreciation + 3.6% rent growth), your $28k cash investment doubles in ~5 years — after that, you're playing with house money.
Negotiation context
- It's been on market 21 days — a 2% lower offer ($98k) is reasonable based on typical stale-listing flexibility.
- 2 sale attempts with the ask held roughly flat each time — persistent listings suggest the price (not the market) is what's stuck; bring a comps-based counter.
Risks & watch-outs
- Watch-outs: built in 1912 — expect roof / HVAC / electrical / plumbing capex.
Questions for the listing agent
- Built in 1912 — when were the roof, HVAC, electrical panel, plumbing, and water heater last replaced?
- Is there a deadline driving the sale (1031 exchange, divorce, estate, relocation)? That informs how much negotiation room exists.
- Schools are F-rated, which usually means shorter tenancies and higher turnover. Who's the typical renter profile here, and what's been the actual vacancy rate?
- Crime grade is F in this area — have there been break-ins, vandalism, or insurance claims at this property in the last 3 years? What carrier currently insures it and at what premium?
- What's the average days-on-market for RENTAL listings here right now (not sales)? A rising rental-DOM trend means longer vacancies and softer asking-rent achievability than the comps imply.
- What's the recent tenant-quality profile in this submarket — average credit score on applications, eviction rate, late-payment / NSF rate, and stable-employment percentage? A property-management company in the area should have these aggregated.
- How much new for-sale + rental construction is in the pipeline within 1–3 miles? Heavy new supply typically softens prices + rents 12–24 months out; constrained supply supports both.
Investment metrics
- 1% rule
- 1.82% ✓
- Cap rate
- 14.38%
- Cash-on-cash
- 28.90%
- DSCR
- 2.29
- GRM
- 4.6
CMA / ARV
No comps found within radius.
Projected returns pro-forma
-3.0% appreciation · 3.61% rent growth · sell at horizon
- IRR
- 24.0%
- Equity multiple
- 2.00×
- Total profit
- $27,944
- Equity at exit
- $14,910
- IRR
- 32.3%
- Equity multiple
- 4.02×
- Total profit
- $84,617
- Equity at exit
- $8,646
Cash invested: $28,000 (down + closing). Projections, not guarantees.
Landlord ↔ Tenant lean methodology
- Overall (STATE)
- 62 Landlord-Friendly
- State Michigan
- 62 Landlord-Friendly · EVEN
- County
- — inherits STATE
- City
- — inherits STATE
ZIP-level market 48060
- Rents YoY
- 3.6%
- Active inventory
- 220
- Price-to-rent
- 4.6×
Monthly cashflow live
- Estimated rent
- $1,825 medium interval (Pro) →
- Mortgage (P&I)
- −$524
- Tax from tax record
- −$201 /mo · $2,412/yr
- Insurance
- −$42
- HOA
- −$0
- Vacancy / Maint / Mgmt
- −$383
- Net cashflow
- $674
Break-even live
Sensitivity live
| Price | -10% $731 | -5% $703 | +0% $674 | +5% $646 | +10% $618 |
|---|---|---|---|---|---|
| Rent | -10% $530 | -5% $602 | +0% $674 | +5% $746 | +10% $818 |
| Rate | -1.0pp $725 | -0.5pp $700 | base $674 | +0.5pp $648 | +1.0pp $622 |
UW: 25.0% down · 7.5% · 30yr · 1.5% tax · 5.0% vac · 8.0% maint · 8.0% mgmt
Financing live
Cash to close
- Down payment
- $25,000
- Closing costs
- $3,000
- Reserves months
- —
- Total cash needed
- —
Loan-product check · same deal, 3 products live
Conventional
25% down · 7.5% · 30yr
- Down + closing
- —
- Monthly P&I
- —
- Monthly cashflow
- —
- DSCR
- —
- Eligible?
- —
Personal DTI + credit; lowest rate.
DSCR
20% down · 8.5% · 30yr
- Down + closing
- —
- Monthly P&I
- —
- Monthly cashflow
- —
- DSCR
- —
- Eligible?
- —
No personal income docs; deal must DSCR.
Hard money
10% down · 12.0% · 12mo
- Down + closing
- —
- Monthly P&I
- —
- Monthly cashflow
- —
- DSCR
- —
- Eligible?
- —
Short-term bridge; refi at stabilization.
Listing history 16 events
-
2026-06-18days on market $100,000 Active 21 DOM
-
2026-06-17days on market $100,000 Active 20 DOM
-
2026-06-16days on market $100,000 Active 19 DOM
-
2026-06-15days on market $100,000 Active 18 DOM
-
2026-06-13days on market $100,000 Active 16 DOM
-
2026-06-13days on market $100,000 Active 15 DOM
-
2026-06-09days on market $100,000 Active 12 DOM
-
2026-06-08days on market $100,000 Active 11 DOM
-
2026-06-07days on market $100,000 Active 10 DOM
-
2026-06-04days on market $100,000 Active 7 DOM
-
2026-06-03days on market $100,000 Active 6 DOM
-
2026-06-02days on market $100,000 Active 5 DOM
-
2026-06-01days on market $100,000 Active 4 DOM
-
2026-05-31days on market $100,000 Active 3 DOM
-
2026-05-28$100,000 Active
Show marketing remark (744 chars)
INVESTOR OPPORTUNITY Rare multi-family investment property with strong income potential in Port Huron. Originally constructed as a 4-unit apartment building, all four units still exist; however, buyers are responsible for verifying permitted unit count and zoning compliance with the City of Port Huron. The property features two 2-bedroom units and two 1-bedroom units, offering excellent flexibility for long-term rental income and portfolio expansion. With solid rental potential and value-add opportunities, this property is ideal for investors, landlords, or rehab specialists seeking a multi-unit asset. Property is being sold strictly “As-Is, †and purchaser assumes the property in its current condition.
-
2026-05-28$100,000 Active 744-char remark
Show marketing remark (744 chars)
INVESTOR OPPORTUNITY Rare multi-family investment property with strong income potential in Port Huron. Originally constructed as a 4-unit apartment building, all four units still exist; however, buyers are responsible for verifying permitted unit count and zoning compliance with the City of Port Huron. The property features two 2-bedroom units and two 1-bedroom units, offering excellent flexibility for long-term rental income and portfolio expansion. With solid rental potential and value-add opportunities, this property is ideal for investors, landlords, or rehab specialists seeking a multi-unit asset. Property is being sold strictly “As-Is, †and purchaser assumes the property in its current condition.
ⓘ Source: listings_history table (triggers on properties + properties_extension) + one-shot
backfill from property_details.listing_events for pre-trigger history.
Tax reassessment forecast MI · Partial reset (capped growth)
- Current annual tax
- $2,412 · $201/mo
- Projected year-2 tax
- $2,412 · $201/mo
- Expected delta
- $0/yr ($0/mo · 0.0%)
ⓘ Screening estimate from a state-policy table — verify with the county assessor before closing.
Climate risk First Street
- Flood 1/10 Low FEMA zone X (unshaded) · 0% chance over 30 yrs
- Wildfire 1/10 Low
- Heat 2/10 Low 7 d/yr ≥99°F today · 14 d/yr by 30 yrs out
- Wind 1/10 Low
- Air quality 3/10 Moderate 2 unhealthy d/yr today · 3 by 30 yrs out
Nearby sold comps map
Loading sold comps map…
Walkable amenities ~0.75 mi
Loading nearby amenities…
Taxation est. · year 1
- Rental income
- $21,895
- − Mortgage interest
- −$5,602
- − Property taxes
- −$2,412
- − Insurance
- −$500
- − Repairs & maintenance
- −$1,752
- − Management
- −$1,752
- − Depreciation
- −$2,909
- Taxable income
- $6,969
- Est. tax owed @ 24.0%
- −$1,673
- After-tax cash flow
- $6,419/yr
For passive investors: Depreciation is non-cash, so a rental often shows a tax loss while cash-flowing — sheltering income. Rental losses are passive: they offset passive income freely, and up to $25,000/yr can offset ordinary (W-2) income if you actively participate and your MAGI is under $100k (phasing out to $0 by $150k); unused losses carry forward. On sale, claimed depreciation is recaptured at up to 25%, and gains may owe capital-gains tax (a 1031 exchange can defer both). Figures are a year-1 estimate at your 24.0% rate — not tax advice; consult a CPA.
Schools (NCES district)
- District
- Port Huron Area School District
- NCES district ID
- 2628830
- Math proficiency
- 23% ▼ -5.00%
- Reading proficiency
- 37% ▼ -2.00%
- Median HH income
- $42,093
- Composite
- 25.4/100
- National rank
- #7462
- State rank
- #368 of 540 in MI
Livability — Port Huron
- Score
- 65/100
- State rank
- #445
- US rank
- #12478
Category grades
Schools grade is shown separately in the Schools card above.
Census & demographics
- Census place
- Port Huron, MI
- County
- Saint Clair County · 44,760 people
- City population
- 39,342
- Metro
- Detroit-Warren-Dearborn, MI
- Population (ZIP)
- 39,342
- Household income
- $53,018
- Rent vs Own
- Severe rent burden
- 1808.0
Population outlook (St. Clair County) Hauer SSP2
- Today (2025)
- 154,587 people
- By 2030
- 150,031 · -2.9%
- By 2040
- 138,177 · -10.6%
- By 2050
- 124,390 · -19.5%
- By 2075
- 95,825 · -38.0%
- By 2100
- 68,672 · -55.6%
Race, ethnicity, and origin ACS 2023
- Neighborhood character
- Predominantly White (80%)
- Race & ethnicity
- White 80% Black 7% Two or more races 7% Hispanic / Latino 6%
- Hispanic origin (detail)
- Mexican 4%
- Common ancestry
- Romanian 6% Lithuanian 4% Slovak 3%
- Foreign-born
- 2% · Canada
- Languages at home
- 97% English-only · Spanish 2%
Political lean MEDSL · St. Clair
- 2024 margin
- Solid R (+34.6) · D 32.0% · R 66.6% · Other 1.4%
- 2008→2024 swing
- -37.3pp toward R · 2008: 2.6pp · 2024: -34.6pp
- All cycles
- 2024: R+34.6 2020: R+30.2 2016: R+31.4 2012: R+7.1 2008: D+2.6
Not yet ingested
- Civics
- —
Market trends
- HPI YoY
- ▼ -134.75%
- Current HPI
- 177.2401
- Rent YoY
- ▲ 3.61%
- Metro
- Detroit-Warren-Dearborn, MI
- State GDP YoY
- ▲ 1.37%
- F500 in state
- 28
Industry mix (Fortune 500 HQ in MI)
| Industry | F500 HQs | Revenue |
|---|---|---|
| Automotive Parts | 3 | $48B |
|
||
| Automotive | 2 | $372B |
|
||
| Chemicals | 1 | $45B |
|
||
| Automotive Retail | 1 | $29B |
|
||
| Healthcare / Medical Devices | 1 | $23B |
|
||
| Automotive Technology | 1 | $20B |
|
||
Price history
+0.0% since first listed2 events — show timeline
- 2026-05-28 Listed $100,000 REALCOMP
- 2026-05-28 Listed $100,000 MiRealSource-MiMLS
Property tax history
+4.8%/yrLatest (2025): $2,412 · -5.8% YoY. Source: county tax records.
Cash-flow waterfall
monthlySold comps — $/sqft
last 12 mo · ≤1 miLoading sold comps…