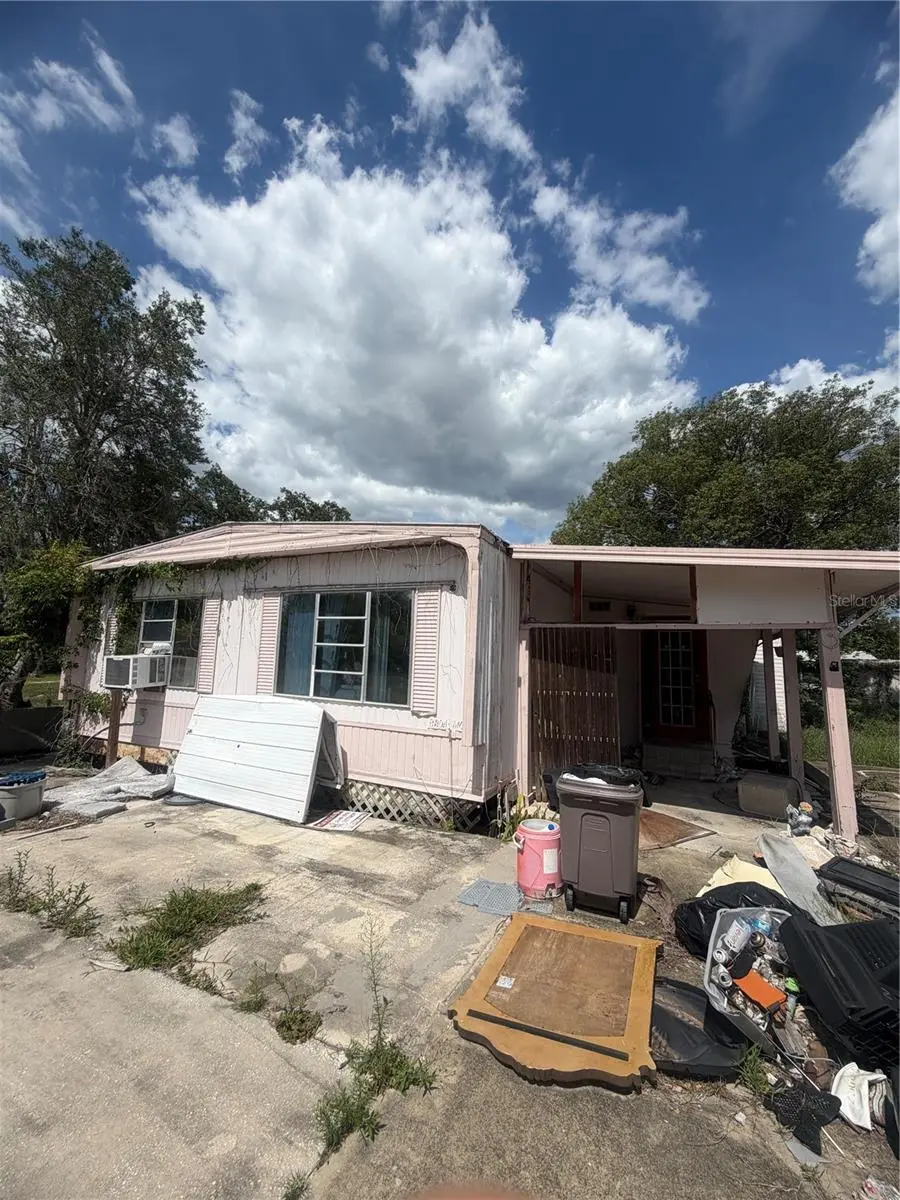
15708 Ruby Ln · Hudson, FL
Flood risk 6/10 · Moderate
- FEMA flood zone
- X (unshaded)
- Chance of flooding over 30 yrs
- 0.68%
- Est. flood insurance / yr
- $507 – $1,088
Fire risk 5/10 · Moderate
- Est. fire insurance / yr
- $947 – $1,759
Heat risk 10/10 · Severe
- Hot days now (above 109°F)
- 7 days/yr
- Hot days in 30 yrs
- 24 days/yr
Wind risk 10/10 · Severe
- Chance of severe wind over 30 yrs
- 99.0%
Air-quality risk 2/10 · Minimal
- Unhealthy air days now
- 2 days/yr
- Unhealthy air days in 30 yrs
- 2 days/yr
Risk factors via First Street. Map © Google.
Why this score? — see what drove the B- grade
The composite is a weighted blend of 9 inputs, each scored 0–100. Each bar is that input's sub-score; the figure is the points it added to the 100-point composite (weight × sub-score).
- Cash flow +30.0/30.0
- 1% rule +10.0/10.0
- DSCR +10.0/10.0
- ARV discount +7.5/15.0
- Schools +4.3/10.0
- Livability +3.7/5.0
- Condition / age +2.5/5.0
- Rent growth +1.9/5.0
- Appreciation +0.0/10.0
$85,000
🖨 Deal sheet (PDF) 📄 Offer letter ✓ Due diligence
Listing remarks MLS
Great starter or investor property. Or use for snowbird retreat, possibly set up a RV and rent home out. Lots of possibilities. Property is completely fenced with 5 zoned irrigation system. Workshops, carport, storage shed. At the end of a dead end street and also an entrance from another street, so you have 2 entrances to property. Keep your RV, Boat, and 4 wheelsers on your property. 3 bedroom 2 bath mobile has window ac but has central heat. AC unit comes with home but needs to be installed. Kitchen has breakfast bar & nice pantry. Dining room & living room. Take a look & make offer before it's gone!!
Key facts
- Gated lot
- Fully fenced
- Private well
Tags
Property features AI
Finance
- Other: Approximately 0.96 acre lot (about 1/2 to less than 1 acre); Homestead exempt; Unfurnished; Living area about 1,152 (public records)
Exterior
- Parking: Carport with 2 spaces
- Utilities: Well water; Septic tank; Other utilities
- Home design: Residential mobile home (single wide); One level; Faces west
- Construction: Metal siding; Metal roof
- Exterior features: Dog run; Chain link fencing; Dirt road access
Interior
- Kitchen: Other appliances
- Bedrooms: 3 bedrooms
- Flooring: Carpet; Other
- Bathrooms: 2 full bathrooms
- Heating & cooling: Electric heating; Wall/window cooling unit(s)
- Interior features: No interior features listed
- Laundry & utility: Washer hookup; Electric dryer hookup
Neighborhood map
What this means for you Summary
Snapshot
- This is a 3-bed/2.0-bath manufactured listed at $85k.
Deal economics
- At list price, monthly cash flow is $1k ($13k/yr) — positive.
- The deal already cash-flows at list — no discount required.
- Meets the 1% rule at list price ($2k rent vs $85k).
- Cap rate 21.9% vs local median 3.4% in Hudson — top-decile yield for the area; either an underpriced asset or a hidden risk that comps aren't pricing in. Stress-test before assuming the spread holds.
Location & tenants
- Location reads 74/100 on livability (#289 in FL, #4,856 nationally) — a middle-class / working-renter tenant base. Strengths: cost of living A+, housing A+, health & safety A+; Watch: amenities D, employment D, schools D-.
- Pasco (suburban): math 50% / reading 52% proficiency, ranked #32 of 73 in FL (top 44%) — acceptable for families but not a draw, mixed tenant base, ~2y average lease.
- Market conditions: Rents soft (-2.3%/yr); 799 active listings in the ZIP; 5 comparable units currently listed for rent nearby; rentals leasing fast (median 14d on market — plan ~1-2 weeks tenant-placement turnaround); 6,765 units permitted in Pasco County in 2024 (1,250 in 5+ unit buildings).
- At $2,027/mo this rent would consume 47% of the median local household income ($51k/yr) (locally 946% of renters already pay >50% of income on rent) — very limited rent-growth headroom before tenants either downsize or default.
Forward outlook
- Local home prices are declining (-3.0%/yr); year-one equity from $588 of loan paydown is wiped out by about $3k of value loss. Plan a longer hold.
- Pasco County population projected at +29% by 2050 — long-run rental-demand tailwind backs the buy-and-hold thesis.
- At projected returns (-3.0% appreciation + 0.0% rent growth), your $24k cash investment doubles in ~3 years — after that, you're playing with house money.
Negotiation context
- Only 2 days on market — expect competitive offers; lowballing is unlikely to land.
- 2 sale attempts since 6y ago with the ask held roughly flat each time — persistent listings suggest the price (not the market) is what's stuck; bring a comps-based counter.
Risks & watch-outs
- Climate carrying-cost: major flood risk; severe wind risk, 99% chance of damaging wind over 30y; moderate wildfire risk; extreme-heat days projected 7→24/yr by 2055 (HVAC capex compounding) — expect insurance premiums to compound above CPI over the hold.
Questions for the listing agent
- Built in 1972 — when were the roof, HVAC, electrical panel, plumbing, and water heater last replaced?
- Is there a deadline driving the sale (1031 exchange, divorce, estate, relocation)? That informs how much negotiation room exists.
- Schools are D-rated, which usually means shorter tenancies and higher turnover. Who's the typical renter profile here, and what's been the actual vacancy rate?
- What's the average days-on-market for RENTAL listings here right now (not sales)? A rising rental-DOM trend means longer vacancies and softer asking-rent achievability than the comps imply.
- What's the recent tenant-quality profile in this submarket — average credit score on applications, eviction rate, late-payment / NSF rate, and stable-employment percentage? A property-management company in the area should have these aggregated.
- How much new for-sale + rental construction is in the pipeline within 1–3 miles? Heavy new supply typically softens prices + rents 12–24 months out; constrained supply supports both.
Investment metrics
- 1% rule
- 2.38% ✓
- Cap rate
- 21.86%
- Cash-on-cash
- 55.59%
- DSCR
- 3.47
- GRM
- 3.5
CMA / ARV
- ARV (on-the-fly)
- $201,600
- Comps found
- 1
Show comp detail 1 sale within ~0.75 mi
| Address | Dist | Beds/Ba | Sqft | Sold | Price | $/sf | Match |
|---|---|---|---|---|---|---|---|
| 15739 Brenda St | 0.13mi | 3/2.0 | 1,200 (+4%) | 2mo | $210,000 | $175 | 85 |
Match score weights: distance 35% · size 25% · config 20% · recency 20%. Top-matched comps best support the ARV.
Projected returns pro-forma
-3.0% appreciation · 0.0% rent growth · sell at horizon
- IRR
- 50.6%
- Equity multiple
- 3.12×
- Total profit
- $50,480
- Equity at exit
- $12,674
- IRR
- 54.9%
- Equity multiple
- 5.68×
- Total profit
- $111,321
- Equity at exit
- $7,349
Cash invested: $23,800 (down + closing). Projections, not guarantees.
Landlord ↔ Tenant lean methodology
- Overall (STATE)
- 87 Strongly Landlord-Friendly
- State Florida
- 87 Strongly Landlord-Friendly · R+3
- County
- — inherits STATE
- City
- — inherits STATE
ZIP-level market 34667
- Rents YoY
- -2.3%
- Active inventory
- 799
- Price-to-rent
- 3.5×
Monthly cashflow live
- Estimated rent
- $2,027 high interval (Pro) →
- Mortgage (P&I)
- −$446
- Tax from tax record
- −$17 /mo · $209/yr
- Insurance
- −$35
- HOA
- −$0
- Vacancy / Maint / Mgmt
- −$426
- Net cashflow
- $1,102
Break-even live
Sensitivity live
| Price | -10% $1,151 | -5% $1,127 | +0% $1,102 | +5% $1,078 | +10% $1,054 |
|---|---|---|---|---|---|
| Rent | -10% $942 | -5% $1,022 | +0% $1,102 | +5% $1,183 | +10% $1,263 |
| Rate | -1.0pp $1,145 | -0.5pp $1,124 | base $1,102 | +0.5pp $1,080 | +1.0pp $1,058 |
UW: 25.0% down · 7.5% · 30yr · 1.5% tax · 5.0% vac · 8.0% maint · 8.0% mgmt
Financing live
Cash to close
- Down payment
- $21,250
- Closing costs
- $2,550
- Reserves months
- —
- Total cash needed
- —
Loan-product check · same deal, 3 products live
Conventional
25% down · 7.5% · 30yr
- Down + closing
- —
- Monthly P&I
- —
- Monthly cashflow
- —
- DSCR
- —
- Eligible?
- —
Personal DTI + credit; lowest rate.
DSCR
20% down · 8.5% · 30yr
- Down + closing
- —
- Monthly P&I
- —
- Monthly cashflow
- —
- DSCR
- —
- Eligible?
- —
No personal income docs; deal must DSCR.
Hard money
10% down · 12.0% · 12mo
- Down + closing
- —
- Monthly P&I
- —
- Monthly cashflow
- —
- DSCR
- —
- Eligible?
- —
Short-term bridge; refi at stabilization.
Rent comps 5 comps
| Address | Beds | Baths | Sqft | Rent | $/sqft | DOM | Units | Dist |
|---|---|---|---|---|---|---|---|---|
| 8516 Inwood Dr Hudson, FL | 2.0 | 2.0 | 1120 | $1,900 | $1.70 | 6d | 1 | 1.26mi |
| 8512 Longboat Ln Hudson, FL | 3.0 | 2.0 | 1500 | $2,095 | $1.40 | 18d | 1 | 1.29mi |
| 8316 Needles Dr Hudson, FL | 2.0 | 2.0 | 1407 | $1,900 | $1.35 | 13d | 1 | 1.39mi |
| 14611 Ivy Chase Ln Hudson, FL | 2.0–3.0 | 1.0–2.0 | 1021 | $1,450 | $1.42 | 25d | 4 | 1.43mi |
| 15902 Spyglass Ter Hudson, FL | 2.0–3.0 | 2.0 | 1300 | $1,725 | $1.33 | 0d | 19 | 1.45mi |
Listing history 3 events
-
2026-06-13statusdays on market $85,000 Pending 2 DOM
-
2026-06-10remarks 699-char remark
-
2026-06-10$85,000 Active 1 DOM
ⓘ Source: listings_history table (triggers on properties + properties_extension) + one-shot
backfill from property_details.listing_events for pre-trigger history.
Tax reassessment forecast FL · Resets to sale price
- Current annual tax
- $209 · $17/mo
- Projected year-2 tax
- $706 · $59/mo
- Expected delta
- +$496/yr (+$41/mo · 237.6%)
ⓘ Screening estimate from a state-policy table — verify with the county assessor before closing.
Climate risk First Street
- Flood 6/10 Major FEMA zone X (unshaded) · 68% chance over 30 yrs
- Wildfire 5/10 Major
- Heat 10/10 Extreme 7 d/yr ≥109°F today · 24 d/yr by 30 yrs out
- Wind 10/10 Extreme 99% chance of damaging wind over 30 yrs
- Air quality 2/10 Low 2 unhealthy d/yr today · 2 by 30 yrs out
Nearby sold comps map
Loading sold comps map…
Walkable amenities ~0.75 mi
Loading nearby amenities…
Taxation est. · year 1
- Rental income
- $24,320
- − Mortgage interest
- −$4,761
- − Property taxes
- −$209
- − Insurance
- −$425
- − Repairs & maintenance
- −$1,946
- − Management
- −$1,946
- − Depreciation
- −$2,473
- Taxable income
- $12,560
- Est. tax owed @ 24.0%
- −$3,015
- After-tax cash flow
- $10,215/yr
For passive investors: Depreciation is non-cash, so a rental often shows a tax loss while cash-flowing — sheltering income. Rental losses are passive: they offset passive income freely, and up to $25,000/yr can offset ordinary (W-2) income if you actively participate and your MAGI is under $100k (phasing out to $0 by $150k); unused losses carry forward. On sale, claimed depreciation is recaptured at up to 25%, and gains may owe capital-gains tax (a 1031 exchange can defer both). Figures are a year-1 estimate at your 24.0% rate — not tax advice; consult a CPA.
Schools (NCES district)
- District
- Pasco
- NCES district ID
- 1201530
- Math proficiency
- 50% ▼ -10.00%
- Reading proficiency
- 52% ▼ -5.00%
- Median HH income
- $45,039
- Composite
- 43.14/100
- National rank
- #3074
- State rank
- #32 of 73 in FL
Livability — Hudson
- Score
- 74/100
- State rank
- #289
- US rank
- #4856
Category grades
Schools grade is shown separately in the Schools card above.
Census & demographics
- County
- Pasco County · 524,098 people
- City population
- 45,307
- Metro
- Tampa-St. Petersburg-Clearwater, FL
- Population (ZIP)
- 30,689
- Household income
- $51,280
- Rent vs Own
- Severe rent burden
- 946.0
Population outlook (Pasco County) Hauer SSP2
- Today (2025)
- 570,045 people
- By 2030
- 605,844 · +6.3%
- By 2040
- 674,806 · +18.4%
- By 2050
- 736,022 · +29.1%
- By 2075
- 862,900 · +51.4%
- By 2100
- 906,364 · +59.0%
Race, ethnicity, and origin ACS 2023
- Neighborhood character
- Predominantly White (86%)
- Race & ethnicity
- White 86% Hispanic / Latino 7% Two or more races 6% Black 2% Asian 2%
- Hispanic origin (detail)
- Mexican 1% Puerto Rican 2%
- Common ancestry
- Romanian 4% Lithuanian 3% Slovak 2%
- Foreign-born
- 7% · Canada, Jamaica, Vietnam
- Languages at home
- 91% English-only · Spanish 5% Other Indo-European 2% French/Haitian/Cajun 0%
Political lean MEDSL · Pasco
- 2024 margin
- Strong R (+25.2) · D 36.9% · R 62.1% · Other 1.0%
- 2008→2024 swing
- -21.6pp toward R · 2008: -3.6pp · 2024: -25.2pp
- All cycles
- 2024: R+25.2 2020: R+20.1 2016: R+21.6 2012: R+6.7 2008: R+3.6
Not yet ingested
- Civics
- —
Market trends
- HPI YoY
- ▼ -183.96%
- Current HPI
- 307.5552
- Rent YoY
- ▼ -2.26%
- Metro
- Tampa-St. Petersburg-Clearwater, FL
- State GDP YoY
- ▲ 3.28%
- F500 in state
- 36
Industry mix (Fortune 500 HQ in FL)
| Industry | F500 HQs | Revenue |
|---|---|---|
| Industrial Technology | 2 | $29B |
|
||
| Insurance | 2 | $17B |
|
||
| Retail | 1 | $60B |
|
||
| Technology Distribution | 1 | $58B |
|
||
| Homebuilding | 1 | $35B |
|
||
| Technology Manufacturing | 1 | $35B |
|
||
Price history
-22.7% since first listed7 events — show timeline
- 2026-06-09 Listed $85,000 Stellar MLS as Distributed by MLS Grid
- 2020-11-24 Sold (Public Records) $78,000 Public Records
- 2020-11-20 Sold (MLS) $78,000 Stellar MLS as Distributed by MLS Grid
- 2020-11-03 Pending — Stellar MLS as Distributed by MLS Grid
- 2020-10-21 Price Changed $84,900 Stellar MLS as Distributed by MLS Grid
- 2020-09-22 Price Changed $104,900 Stellar MLS as Distributed by MLS Grid
- 2020-09-03 Listed $109,999 Stellar MLS as Distributed by MLS Grid
Property tax history
+5.1%/yrLatest (2025): $209 · +3.5% YoY. Source: county tax records.
Cash-flow waterfall
monthlySold comps — $/sqft
last 12 mo · ≤1 miLoading sold comps…