 Fourplex
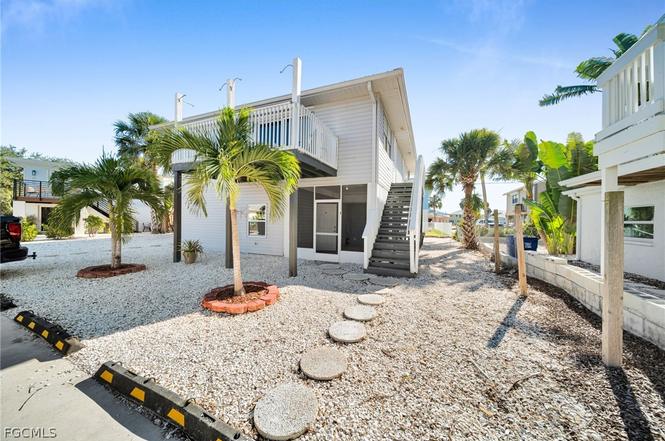
128 Eucalyptus Ct · Fort Myers Beach, FL
Flood risk 10/10 · Severe
- FEMA flood zone
- AE
- Chance of flooding over 30 yrs
- 0.99%
- Est. flood insurance / yr
- $1,737 – $8,500
Fire risk 3/10 · Minor
- Est. fire insurance / yr
- $947 – $1,759
Heat risk 10/10 · Severe
- Hot days now (above 107°F)
- 7 days/yr
- Hot days in 30 yrs
- 28 days/yr
Wind risk 10/10 · Severe
- Chance of severe wind over 30 yrs
- 99.0%
Air-quality risk 3/10 · Minor
- Unhealthy air days now
- 2 days/yr
- Unhealthy air days in 30 yrs
- 2 days/yr
Risk factors via First Street. Map © Google.
Why this score? — see what drove the B grade
The composite is a weighted blend of 9 inputs, each scored 0–100. Each bar is that input's sub-score; the figure is the points it added to the 100-point composite (weight × sub-score).
- Cash flow +30.0/30.0
- 1% rule +10.0/10.0
- DSCR +10.0/10.0
- ARV discount +7.5/15.0
- Schools +4.1/10.0
- Livability +3.5/5.0
- Rent growth +2.5/5.0
- Condition / age +2.5/5.0
- Appreciation +0.0/10.0
$895,000
🖨 Deal sheet 📄 Offer letter ✓ Due diligence
Multi-family units
County records classify this as Multi-Family (2-4 Unit). Listing-text estimate: 4 units. confirmed
Listing remarks MLS
Incredible income potential on Fort Myers Beach! Just steps away from the gorgeous Gulf of Mexico, this duplex is currently pulling in over $3100/month of annual rental income from longstanding tenants. The property offers 3 units total (one 2/2 and two 1/1), which opens up the possibility of an Owner's Unit or Property Manager. Ideal location for furnished weekly rental with Fort Myers Beach being at the top on the list for vacation destinations! Within walking distance from great shopping & dining, plus the trolley on the island makes it extremely convenient to get to Time Square (w/ fishing pier, street performers, shopping, playground, & dining), sand volleyball park, watercraft rentals, the Key West Express, Lover's Key, the Mound House, and the up & coming Margaritaville Resort!
Key facts
- Deeded beach access
- Short-term rentals
- Weekly rental zone
Tags
Neighborhood map
What this means for you Summary
Snapshot
- This is a 4 × 2-bed/2.0-bath units multifamily listed at $895k.
Deal economics
- At list price, monthly cash flow is $6k ($74k/yr) — positive. Per door: $2k/mo.
- The deal already cash-flows at list — no discount required.
- Meets the 1% rule at list price ($15k rent vs $895k).
- Cap rate 15.2% vs local median 0.3% in Fort Myers Beach — top-decile yield for the area; either an underpriced asset or a hidden risk that comps aren't pricing in. Stress-test before assuming the spread holds.
Location & tenants
- Location reads 69/100 on livability (#489 in FL) — a middle-class / working-renter tenant base. Strengths: crime A+, employment A+, schools A-; Watch: amenities F, commute F, cost of living F.
- Lee (suburban): math 47% / reading 50% proficiency, ranked #42 of 73 in FL (top 58%) — families likely to look elsewhere, expect single-tenant / working-renter base with shorter leases.
- Market conditions: 876 active listings in the ZIP; solid renter incomes; 15,411 units permitted in Lee County in 2024 (4,686 in 5+ unit buildings).
- At $15,428/mo this rent would consume 234% of the median local household income ($79k/yr) (locally 145% of renters already pay >50% of income on rent) — very limited rent-growth headroom before tenants either downsize or default.
Forward outlook
- Local home prices are declining (-3.0%/yr); year-one equity from $6k of loan paydown is wiped out by about $27k of value loss. Plan a longer hold.
- Lee County population projected at +44% by 2050 — long-run rental-demand tailwind backs the buy-and-hold thesis.
- At projected returns (-3.0% appreciation + 3.0% rent growth), your $251k cash investment doubles in ~5 years — after that, you're playing with house money.
Negotiation context
- Only 9 days on market — expect competitive offers; lowballing is unlikely to land.
- 4 sale attempts since 11y ago with the ask held roughly flat each time — persistent listings suggest the price (not the market) is what's stuck; bring a comps-based counter.
- Current owner paid $630k; 42% above their basis — modest negotiation headroom, anchor on the comps not their cost.
Risks & watch-outs
- Watch-outs: flood insurance adds $427/mo.
- Climate carrying-cost: in FEMA flood zone AE (mandatory federal flood insurance); severe wind risk, 99% chance of damaging wind over 30y; extreme-heat days projected 7→28/yr by 2055 (HVAC capex compounding) — expect insurance premiums to compound above CPI over the hold.
Questions for the listing agent
- Can we see the unit-by-unit rent roll, current vacancy, and any below-market leases? What's the average tenancy length?
- What capital expenditures (roof, boiler, parking lot, exteriors) have been made in the last 5 years, and what's planned in the next 2?
- Built in 1978 — when were the roof, HVAC, electrical panel, plumbing, and water heater last replaced?
- What's the actual annual flood-insurance premium (NFIP or private), and is the property in a SFHA with mandatory coverage?
- Is there a deadline driving the sale (1031 exchange, divorce, estate, relocation)? That informs how much negotiation room exists.
- Schools are A-rated — typically a magnet for longer-tenancy family renters. What's the average tenant stay here, and is there a school-zone premium baked into asking?
- What's the average days-on-market for RENTAL listings here right now (not sales)? A rising rental-DOM trend means longer vacancies and softer asking-rent achievability than the comps imply.
- What's the recent tenant-quality profile in this submarket — average credit score on applications, eviction rate, late-payment / NSF rate, and stable-employment percentage? A property-management company in the area should have these aggregated.
- How much new apartment / multifamily construction is in the pipeline within 1–3 miles? Heavy new supply (>2% of stock underway) typically softens rents 12–24 months out; light construction supports rent growth.
Investment metrics
- 1% rule
- 1.72% ✓
- Cap rate
- 15.17%
- Cash-on-cash
- 31.69%
- DSCR
- 2.41
- GRM
- 4.8
CMA / ARV
No comps found within radius.
Projected returns pro-forma
-3.0% appreciation · 3.0% rent growth · sell at horizon
- IRR
- 24.2%
- Equity multiple
- 2.00×
- Total profit
- $249,386
- Equity at exit
- $133,447
- IRR
- 32.0%
- Equity multiple
- 3.89×
- Total profit
- $725,359
- Equity at exit
- $77,383
Cash invested: $250,600 (down + closing). Projections, not guarantees.
Landlord ↔ Tenant lean methodology
- Overall (STATE)
- 87 Strongly Landlord-Friendly
- State Florida
- 87 Strongly Landlord-Friendly · R+3
- County
- — inherits STATE
- City
- — inherits STATE
ZIP-level market 33931
- Home prices YoY
- -18.8%
- Active inventory
- 876
- Price-to-rent
- 19.3×
Monthly cashflow live
- Estimated rent
- $15,428 medium interval (Pro) →
- Mortgage (P&I)
- −$4,693
- Tax from tax record
- −$504 /mo · $6,052/yr
- Insurance
- −$373
- Flood insurance flood zone
- −$427 /mo · $5,118/yr
- HOA
- −$0
- Vacancy / Maint / Mgmt
- −$3,240
- Net cashflow
- $6,191
Break-even live
4-unit breakdown (identical units grouped — click to expand)
| Units | Beds | Baths | Est. rent |
|---|---|---|---|
| 4× units | 2 | 2 | $15,428 |
| #1 | 2 | 2 | $3,857 |
| #2 | 2 | 2 | $3,857 |
| #3 | 2 | 2 | $3,857 |
| #4 | 2 | 2 | $3,857 |
| Total (4 units) | $15,428 | ||
UW: 25.0% down · 7.5% · 30yr · 1.5% tax · 5.0% vac · 8.0% maint · 8.0% mgmt
Financing live
Cash to close
- Down payment
- $223,750
- Closing costs
- $26,850
- Reserves months
- —
- Total cash needed
- —
Loan-product check · same deal, 3 products live
Conventional
25% down · 7.5% · 30yr
- Down + closing
- —
- Monthly P&I
- —
- Monthly cashflow
- —
- DSCR
- —
- Eligible?
- —
Personal DTI + credit; lowest rate.
DSCR
20% down · 8.5% · 30yr
- Down + closing
- —
- Monthly P&I
- —
- Monthly cashflow
- —
- DSCR
- —
- Eligible?
- —
No personal income docs; deal must DSCR.
Hard money
10% down · 12.0% · 12mo
- Down + closing
- —
- Monthly P&I
- —
- Monthly cashflow
- —
- DSCR
- —
- Eligible?
- —
Short-term bridge; refi at stabilization.
Listing history 26 events
-
2026-03-20status Pending
-
2026-03-11$895,000 Active
-
2021-03-18soldstatus $630,000
-
2021-02-25soldstatus $630,000 Closed 812-char remark
Show marketing remark (812 chars)
Incredible income potential on Fort Myers Beach! Just steps away from the gorgeous Gulf of Mexico, this duplex is currently pulling in over $3100/month of annual rental income from longstanding tenants. The property offers 3 units total (one 2/2 and two 1/1), which opens up the possibility of an Owner's Unit or Property Manager. Ideal location for furnished weekly rental with Fort Myers Beach being at the top on the list for vacation destinations! Within walking distance from great shopping & dining, plus the trolley on the island makes it extremely convenient to get to Time Square (w/ fishing pier, street performers, shopping, playground, & dining), sand volleyball park, watercraft rentals, the Key West Express, Lover's Key, the Mound House, and the up & coming Margaritaville Resort!
-
2020-12-18status Pending 812-char remark
Show marketing remark (812 chars)
Incredible income potential on Fort Myers Beach! Just steps away from the gorgeous Gulf of Mexico, this duplex is currently pulling in over $3100/month of annual rental income from longstanding tenants. The property offers 3 units total (one 2/2 and two 1/1), which opens up the possibility of an Owner's Unit or Property Manager. Ideal location for furnished weekly rental with Fort Myers Beach being at the top on the list for vacation destinations! Within walking distance from great shopping & dining, plus the trolley on the island makes it extremely convenient to get to Time Square (w/ fishing pier, street performers, shopping, playground, & dining), sand volleyball park, watercraft rentals, the Key West Express, Lover's Key, the Mound House, and the up & coming Margaritaville Resort!
-
2020-08-31price $645,900 812-char remark
Show marketing remark (812 chars)
Incredible income potential on Fort Myers Beach! Just steps away from the gorgeous Gulf of Mexico, this duplex is currently pulling in over $3100/month of annual rental income from longstanding tenants. The property offers 3 units total (one 2/2 and two 1/1), which opens up the possibility of an Owner's Unit or Property Manager. Ideal location for furnished weekly rental with Fort Myers Beach being at the top on the list for vacation destinations! Within walking distance from great shopping & dining, plus the trolley on the island makes it extremely convenient to get to Time Square (w/ fishing pier, street performers, shopping, playground, & dining), sand volleyball park, watercraft rentals, the Key West Express, Lover's Key, the Mound House, and the up & coming Margaritaville Resort!
-
2020-07-31$655,900 Active 812-char remark
Show marketing remark (812 chars)
Incredible income potential on Fort Myers Beach! Just steps away from the gorgeous Gulf of Mexico, this duplex is currently pulling in over $3100/month of annual rental income from longstanding tenants. The property offers 3 units total (one 2/2 and two 1/1), which opens up the possibility of an Owner's Unit or Property Manager. Ideal location for furnished weekly rental with Fort Myers Beach being at the top on the list for vacation destinations! Within walking distance from great shopping & dining, plus the trolley on the island makes it extremely convenient to get to Time Square (w/ fishing pier, street performers, shopping, playground, & dining), sand volleyball park, watercraft rentals, the Key West Express, Lover's Key, the Mound House, and the up & coming Margaritaville Resort!
-
2020-07-27historical
-
2020-05-29price $660,900
-
2020-05-21price $675,900
-
2020-03-18price $689,000
-
2020-02-22$699,000 Active
-
2016-03-02price $394,000
-
2016-03-02soldstatus $394,000
-
2016-02-29soldstatus $394,000 Sold
-
2016-02-29price $399,900
-
2015-12-29status Pending With Contingencies
-
2015-12-18$399,900 Active
-
2015-03-02price $629,900
-
2008-03-04soldstatus $297,000
-
2008-01-26price $305,000
-
2006-05-24soldstatus $680,000
-
2006-05-19soldstatus $680,000
-
2005-04-29soldstatus $345,000
-
2005-03-29soldstatus $345,000
-
1988-05-17soldstatus $95,400
ⓘ Source: listings_history table (triggers on properties + properties_extension) + one-shot
backfill from property_details.listing_events for pre-trigger history.
Tax reassessment forecast FL · Resets to sale price
- Current annual tax
- $6,052 · $504/mo
- Projected year-2 tax
- $7,428 · $619/mo
- Expected delta
- +$1,376/yr (+$115/mo · 22.7%)
ⓘ Screening estimate from a state-policy table — verify with the county assessor before closing.
Climate risk First Street
- Flood 10/10 Extreme FEMA zone AE · 99% chance over 30 yrs
- Wildfire 3/10 Moderate
- Heat 10/10 Extreme 7 d/yr ≥107°F today · 28 d/yr by 30 yrs out
- Wind 10/10 Extreme 99% chance of damaging wind over 30 yrs
- Air quality 3/10 Moderate 2 unhealthy d/yr today · 2 by 30 yrs out
Nearby sold comps map
Loading sold comps map…
Walkable amenities ~0.75 mi
Loading nearby amenities…
Taxation est. · year 1
- Rental income
- $185,136
- − Mortgage interest
- −$50,134
- − Property taxes
- −$6,052
- − Insurance
- −$9,594
- − Repairs & maintenance
- −$14,811
- − Management
- −$14,811
- − Depreciation
- −$26,036
- Taxable income
- $63,698
- Est. tax owed @ 24.0%
- −$15,288
- After-tax cash flow
- $59,002/yr
For passive investors: Depreciation is non-cash, so a rental often shows a tax loss while cash-flowing — sheltering income. Rental losses are passive: they offset passive income freely, and up to $25,000/yr can offset ordinary (W-2) income if you actively participate and your MAGI is under $100k (phasing out to $0 by $150k); unused losses carry forward. On sale, claimed depreciation is recaptured at up to 25%, and gains may owe capital-gains tax (a 1031 exchange can defer both). Figures are a year-1 estimate at your 24.0% rate — not tax advice; consult a CPA.
Schools (NCES district)
- District
- Lee
- NCES district ID
- 1201080
- Math proficiency
- 47% ▼ -11.00%
- Reading proficiency
- 50% ▼ -4.00%
- Median HH income
- $49,518
- Composite
- 41.49/100
- National rank
- #3458
- State rank
- #42 of 73 in FL
Livability — Fort Myers Beach
- Score
- 69/100
- State rank
- #489
- US rank
- #8995
Category grades
Schools grade is shown separately in the Schools card above.
Census & demographics
- Census place
- Fort Myers Beach, FL
- County
- Lee County · 788,662 people
- Metro
- Cape Coral-Fort Myers, FL
- Population (ZIP)
- 8,350
- Household income
- $79,018
- Rent vs Own
- Severe rent burden
- 145.0
Population outlook (Lee County) Hauer SSP2
- Today (2025)
- 871,946 people
- By 2030
- 955,468 · +9.6%
- By 2040
- 1,113,587 · +27.7%
- By 2050
- 1,256,891 · +44.1%
- By 2075
- 1,560,270 · +78.9%
- By 2100
- 1,726,848 · +98.0%
Race, ethnicity, and origin ACS 2023
- Neighborhood character
- Predominantly White (94%)
- Race & ethnicity
- White 94% Hispanic / Latino 4% Two or more races 4%
- Common ancestry
- Romanian 5% Portuguese 3% Lithuanian 3%
- Foreign-born
- 5% · Canada
- Languages at home
- 94% English-only · Spanish 2% German/W. Germanic 1% French/Haitian/Cajun 1%
Political lean MEDSL · Lee
- 2024 margin
- Strong R (+28.4) · D 35.5% · R 63.9%
- 2008→2024 swing
- -18.0pp toward R · 2008: -10.4pp · 2024: -28.4pp
- All cycles
- 2024: R+28.4 2020: R+19.2 2016: R+20.4 2012: R+16.6 2008: R+10.4
Not yet ingested
- Civics
- —
Market trends
- HPI YoY
- ▼ -194.12%
- Current HPI
- 837.37
- Rent YoY
- —
- Metro
- Cape Coral-Fort Myers, FL
- State GDP YoY
- ▲ 3.28%
- F500 in state
- 36
Industry mix (Fortune 500 HQ in FL)
| Industry | F500 HQs | Revenue |
|---|---|---|
| Industrial Technology | 2 | $29B |
|
||
| Insurance | 2 | $17B |
|
||
| Retail | 1 | $60B |
|
||
| Technology Distribution | 1 | $58B |
|
||
| Homebuilding | 1 | $35B |
|
||
| Technology Manufacturing | 1 | $35B |
|
||
Price history
+838.2% since first listed26 events — show timeline
- 2026-03-20 Pending — FORTMLS
- 2026-03-11 Listed $895,000 FORTMLS
- 2021-03-18 Sold (Public Records) $630,000 Public Records
- 2021-02-25 Sold (MLS) $630,000 FORTMLS
- 2020-12-18 Pending — FORTMLS
- 2020-08-31 Price Changed $645,900 FORTMLS
- 2020-07-31 Listed $655,900 FORTMLS
- 2020-07-27 Listing Removed — FORTMLS
- 2020-05-29 Price Changed $660,900 FORTMLS
- 2020-05-21 Price Changed $675,900 FORTMLS
- 2020-03-18 Price Changed $689,000 FORTMLS
- 2020-02-22 Listed $699,000 FORTMLS
- 2016-03-02 Price Changed $394,000 FORTMLS
- 2016-03-02 Sold (Public Records) $394,000 Public Records
- 2016-02-29 Price Changed $399,900 FORTMLS
- 2016-02-29 Sold (MLS) $394,000 FORTMLS
- 2015-12-29 Pending — FORTMLS
- 2015-12-18 Listed $399,900 FORTMLS
- 2015-03-02 Price Changed $629,900 FORTMLS
- 2008-03-04 Sold (MLS) $297,000 FORTMLS
- 2008-01-26 Price Changed $305,000 FORTMLS
- 2006-05-24 Sold (Public Records) $680,000 Public Records
- 2006-05-19 Sold (MLS) $680,000 FORTMLS
- 2005-04-29 Sold (MLS) $345,000 FORTMLS
- 2005-03-29 Sold (Public Records) $345,000 Public Records
- 1988-05-17 Sold (Public Records) $95,400 Public Records
Property tax history
+3.7%/yrLatest (2025): $6,052 · -11.6% YoY. Source: county tax records.
Cash-flow waterfall
monthlySold comps — $/sqft
last 12 mo · ≤1 miLoading sold comps…