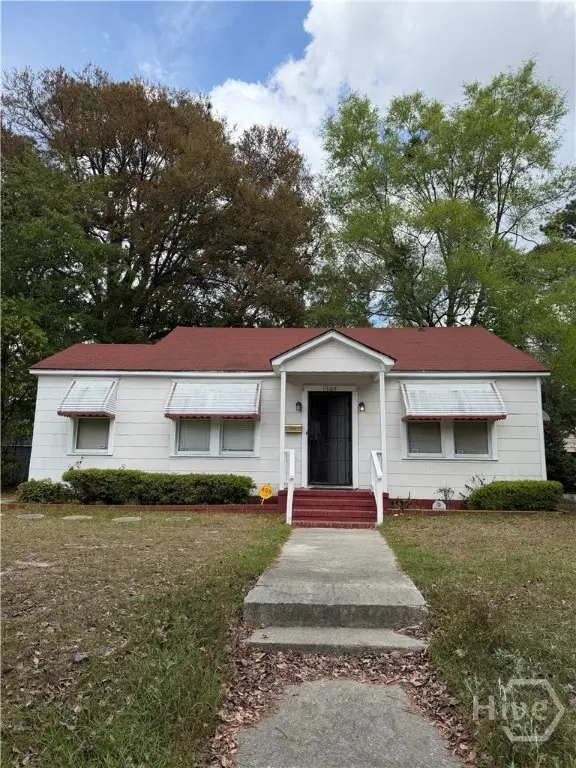
1304 E 52nd St E · Savannah, GA
Flood risk 1/10 · Minimal
- FEMA flood zone
- X (unshaded)
- Chance of flooding over 30 yrs
- 0.0%
- Est. flood insurance / yr
- $507 – $1,088
Fire risk 1/10 · Minimal
- Est. fire insurance / yr
- $963 – $1,789
Heat risk 9/10 · Severe
- Hot days now (above 107°F)
- 7 days/yr
- Hot days in 30 yrs
- 17 days/yr
Wind risk 9/10 · Severe
- Chance of severe wind over 30 yrs
- 99.0%
Air-quality risk 2/10 · Minimal
- Unhealthy air days now
- 2 days/yr
- Unhealthy air days in 30 yrs
- 2 days/yr
Risk factors via First Street. Map © Google.
Why this score? — see what drove the D grade
The composite is a weighted blend of 9 inputs, each scored 0–100. Each bar is that input's sub-score; the figure is the points it added to the 100-point composite (weight × sub-score).
- ARV discount +15.0/15.0
- Cash flow +11.6/30.0
- Livability +4.3/5.0
- DSCR +3.4/10.0
- Rent growth +3.4/5.0
- Condition / age +2.5/5.0
- 1% rule +2.1/10.0
- Schools +2.0/10.0
- Appreciation +0.0/10.0
$249,900
🖨 Deal sheet (PDF) 📄 Offer letter ✓ Due diligence
Listing remarks MLS
Parkside opportunity in Savannah. This 2 bed, 1 bath home offers 1,088 sf with strong potential. Property ideal for a fixer-upper/investor or just a great price for home ownership. Great location and convenient.
Key facts
- 5,750 sq ft lot
- Built 1945
- Listed 43 days
Neighborhood map
What this means for you Summary
Snapshot
- This is a 2-bed/1.0-bath single-family listed at $250k.
Deal economics
- At list price, monthly cash flow is $-77 ($-927/yr) — negative.
- To cash-flow at today's rent, offer at most $236k (5.5% below list).
- To meet the 1% rule (rent ≥ 1% of price), the offer needs to be $178k (28.9% below list).
- Recommended offer: $178k (28.9% below list) — sets the bar for 1% rule.
- Cap rate 5.9% vs local median 4.0% in Savannah — top-decile yield for the area; either an underpriced asset or a hidden risk that comps aren't pricing in. Stress-test before assuming the spread holds.
Location & tenants
- Location reads 86/100 on livability (#1 in GA, #397 nationally) — a professional / high-income tenant draw. Strengths: crime A+, amenities A+, commute A+; Watch: employment D, schools F.
- Savannah-Chatham County (urban): math 20% / reading 26% proficiency, ranked #134 of 174 in GA (top 77%) — low school quality limits family demand, transient renter base, plan for 1-2y turnover.
- Market conditions: Rents rising (+3.6%/yr); 228 active listings in the ZIP; 40 comparable units currently listed for rent nearby; rentals lingering (median 46d on market — plan ~5-8 weeks vacancy on turnover, expect pricing pressure); 62% of comp listings sitting > 30 days — soft ceiling on asking rent; 2,694 units permitted in Chatham County in 2024 (973 in 5+ unit buildings).
- This rent runs 40% of the median local income ($53k/yr) — at the standard rent-burdened threshold; future hikes will face affordability resistance.
Forward outlook
- Local home prices are declining (-3.0%/yr); year-one equity from $2k of loan paydown is wiped out by about $7k of value loss. Plan a longer hold.
- Chatham County population projected at +33% by 2050 — long-run rental-demand tailwind backs the buy-and-hold thesis.
Negotiation context
- It's been on market 43 days — a 3% lower offer ($242k) is reasonable based on typical stale-listing flexibility.
- 2 sale attempts since 15y ago; this cycle's ask has dropped $20k (7%) from the opening price — seller is motivated, your offer sets the floor, not the list.
- Current owner paid $50k; list at $250k implies a 405% gain — meaningful room to come down on a strong offer.
Risks & watch-outs
- Watch-outs: built in 1945 — expect roof / HVAC / electrical / plumbing capex.
- Climate carrying-cost: severe wind risk, 99% chance of damaging wind over 30y; extreme-heat days projected 7→17/yr by 2055 (HVAC capex compounding) — expect insurance premiums to compound above CPI over the hold.
Questions for the listing agent
- What do current leases actually rent for vs. the listed asking? Can we see a recent rent roll and the last 12 months of T-12 income?
- It's been on market 43 days. Have you received any prior offers? Is the seller open to a 29% concession, seller financing, or rate buy-down credit?
- Built in 1945 — when were the roof, HVAC, electrical panel, plumbing, and water heater last replaced?
- Is there a deadline driving the sale (1031 exchange, divorce, estate, relocation)? That informs how much negotiation room exists.
- Schools are F-rated, which usually means shorter tenancies and higher turnover. Who's the typical renter profile here, and what's been the actual vacancy rate?
- The area grade is low — what's the realistic commute time and amenity access for the typical tenant pool here? Any planned neighborhood developments (good or bad) we should know about?
- What's the average days-on-market for RENTAL listings here right now (not sales)? A rising rental-DOM trend means longer vacancies and softer asking-rent achievability than the comps imply.
- What's the recent tenant-quality profile in this submarket — average credit score on applications, eviction rate, late-payment / NSF rate, and stable-employment percentage? A property-management company in the area should have these aggregated.
- How much new for-sale + rental construction is in the pipeline within 1–3 miles? Heavy new supply typically softens prices + rents 12–24 months out; constrained supply supports both.
Investment metrics
- 1% rule
- 0.71% ✗
- Cap rate
- 5.92%
- Cash-on-cash
- -1.33%
- DSCR
- 0.94
- GRM
- 11.7
CMA / ARV
- ARV (median comp)
- $336,975
- List price
- $249,900
- Delta
- -25.84%
- Verdict
- UNDERPRICED
- Comps
- 20 within 1.0 mi
Show comp detail 12 sales within ~0.75 mi
| Address | Dist | Beds/Ba | Sqft | Sold | Price | $/sf | Match |
|---|---|---|---|---|---|---|---|
| 1304 E 52nd St E | 0.00mi | 2/1.0 | 1,088 (0%) | 1mo | $240,000 | $221 | 100 |
| 1330 E 54th St | 0.12mi | 3/1.0 (+1) | 1,074 (-1%) | 3mo | $272,000 | $253 | 85 |
| 626 E 58th St | 0.51mi | 2/1.0 | 1,069 (-2%) | 2mo | $365,000 | $341 | 72 |
| 518 E 51st St | 0.58mi | 2/1.0 | 1,044 (-4%) | 3mo | $370,000 | $354 | 64 |
| 1523 E 54th St | 0.29mi | 3/2.0 (+1) | 1,188 (+9%) | 2mo | $305,000 | $257 | 60 |
| 1317 E 39th St | 0.68mi | 2/1.0 | 1,036 (-5%) | 2mo | $207,000 | $200 | 58 |
| 1818 E 60th St | 0.60mi | 2/1.5 | 1,170 (+8%) | 1mo | $249,400 | $213 | 57 |
| 1214 Delesseps Ave | 0.39mi | 2/1.0 | 933 (-14%) | 2mo | $210,000 | $225 | 56 |
| 11 Oleander Ave | 0.69mi | 3/1.0 (+1) | 1,134 (+4%) | 1mo | $138,000 | $122 | 55 |
| 2121 E 58th St | 0.72mi | 3/1.5 (+1) | 1,175 (+8%) | 2mo | $165,000 | $140 | 44 |
| 2044 E 60th St | 0.72mi | 3/1.0 (+1) | 972 (-11%) | 1mo | $242,000 | $249 | 42 |
| 2403 Harmon St | 0.75mi | 1/1.0 (-1) | 1,195 (+10%) | 2mo | $530,000 | $444 | 42 |
Match score weights: distance 35% · size 25% · config 20% · recency 20%. Top-matched comps best support the ARV.
Projected returns pro-forma
-3.0% appreciation · 3.62% rent growth · sell at horizon
- IRR
- -18.0%
- Equity multiple
- 0.37×
- Total profit
- $-44,425
- Equity at exit
- $37,261
- IRR
- -9.3%
- Equity multiple
- 0.42×
- Total profit
- $-40,891
- Equity at exit
- $21,607
Cash invested: $69,972 (down + closing). Projections, not guarantees.
Landlord ↔ Tenant lean methodology
- Overall (STATE)
- 90 Strongly Landlord-Friendly
- State Georgia
- 90 Strongly Landlord-Friendly · R+3
- County
- — inherits STATE
- City
- — inherits STATE
ZIP-level market 31404
- Rents YoY
- 3.6%
- Active inventory
- 228
- Price-to-rent
- 11.7×
Monthly cashflow live
- Estimated rent
- $1,777 high interval (Pro) →
- Mortgage (P&I)
- −$1,311
- Tax from tax record
- −$66 /mo · $798/yr
- Insurance
- −$104
- HOA
- −$0
- Vacancy / Maint / Mgmt
- −$373
- Net cashflow
- $-77
Break-even live
Sensitivity live
| Price | -10% $64 | -5% $-7 | +0% $-77 | +5% $-148 | +10% $-219 |
|---|---|---|---|---|---|
| Rent | -10% $-218 | -5% $-147 | +0% $-77 | +5% $-7 | +10% $63 |
| Rate | -1.0pp $49 | -0.5pp $-14 | base $-77 | +0.5pp $-142 | +1.0pp $-208 |
UW: 25.0% down · 7.5% · 30yr · 1.5% tax · 5.0% vac · 8.0% maint · 8.0% mgmt
Financing live
Cash to close
- Down payment
- $62,475
- Closing costs
- $7,497
- Reserves months
- —
- Total cash needed
- —
Loan-product check · same deal, 3 products live
Conventional
25% down · 7.5% · 30yr
- Down + closing
- —
- Monthly P&I
- —
- Monthly cashflow
- —
- DSCR
- —
- Eligible?
- —
Personal DTI + credit; lowest rate.
DSCR
20% down · 8.5% · 30yr
- Down + closing
- —
- Monthly P&I
- —
- Monthly cashflow
- —
- DSCR
- —
- Eligible?
- —
No personal income docs; deal must DSCR.
Hard money
10% down · 12.0% · 12mo
- Down + closing
- —
- Monthly P&I
- —
- Monthly cashflow
- —
- DSCR
- —
- Eligible?
- —
Short-term bridge; refi at stabilization.
Rent comps 40 comps
| Address | Beds | Baths | Sqft | Rent | $/sqft | DOM | Units | Dist |
|---|---|---|---|---|---|---|---|---|
| 1306 E 53rd St Savannah, GA | 2.0 | 1.0 | 850 | $1,500 | $1.76 | 25d | 1 | 0.02mi |
| 1320 E 54th St Savannah, GA | 2.0 | 1.0 | 781 | $1,595 | $2.04 | 15d | 1 | 0.09mi |
| 1402 E 51st St Unit 1 Savannah, GA | 2.0 | 1.0 | 988 | $2,100 | $2.13 | 25d | 1 | 0.14mi |
| 1405 E 51st St Savannah, GA | 3.0 | 2.0 | 1458 | $2,850 | $1.95 | 45d | 1 | 0.14mi |
| 1218 E 55th St Savannah, GA | 2.0 | 1.0 | 817 | $1,300 | $1.59 | 45d | 1 | 0.15mi |
| 1311 E 55th St Savannah, GA | 2.0 | 1.0 | 773 | $1,675 | $2.17 | 45d | 1 | 0.16mi |
| 1309 E 55th St Savannah, GA | 2.0 | 1.0 | 773 | $1,550 | $2.01 | 25d | 1 | 0.16mi |
| 1313 E 55th St Savannah, GA | 2.0 | 1.0 | 773 | $1,675 | $2.17 | 45d | 1 | 0.16mi |
| 1225 E 55th St Savannah, GA | 2.0 | 1.0 | 780 | $1,200 | $1.54 | 45d | 1 | 0.16mi |
| 1413 E 55th St Savannah, GA | 3.0 | 1.0 | 1100 | $2,500 | $2.27 | 45d | 1 | 0.22mi |
| 1112 E 54th St Savannah, GA | 2.0 | 1.0 | 817 | $1,300 | $1.59 | 45d | 1 | 0.23mi |
| 1331 E 48th St Savannah, GA | 3.0 | 2.0 | 1408 | $3,450 | $2.45 | 45d | 1 | 0.23mi |
| 1100 E 56th St Unit 2 Savannah, GA | 2.0 | 1.0 | 868 | $1,295 | $1.49 | 45d | 1 | 0.30mi |
| 1100 E 56th St Savannah, GA | 2.0 | 1.0 | 856 | $1,250 | $1.46 | 45d | 1 | 0.30mi |
| 1411 E 58th St Savannah, GA | 3.0 | 2.0 | 1100 | $1,900 | $1.73 | 25d | 1 | 0.31mi |
| 3222 Bee Rd Savannah, GA | 2.0 | 1.0 | 900 | $1,195 | $1.33 | 15d | 1 | 0.35mi |
| 601 E 53rd St Unit 4 Savannah, GA | 2.0 | 1.0 | 950 | $1,800 | $1.89 | 45d | 1 | 0.47mi |
| 1815 E 58th St Savannah, GA | 3.0 | 2.0 | 1176 | $2,400 | $2.04 | 45d | 1 | 0.47mi |
| 1901 E 57th St Savannah, GA | 3.0 | 1.0 | 1215 | $1,750 | $1.44 | 45d | 1 | 0.48mi |
| 736 E 45th St Unit 1 Savannah, GA | 1.0 | 1.0 | 1000 | $1,499 | $1.50 | 15d | 1 | 0.50mi |
| 1226 E Victory Dr Apt 4 Savannah, GA | 2.0 | 1.0 | 950 | $1,675 | $1.76 | 45d | 1 | 0.54mi |
| 1220 E Victory Dr Savannah, GA | 2.0 | 1.0 | 1000 | $1,800 | $1.80 | 45d | 1 | 0.54mi |
| 536 E 49th St Unit A Savannah, GA | 2.0 | 1.0 | 1200 | $1,775 | $1.48 | 45d | 1 | 0.56mi |
| 626 Columbus Dr Savannah, GA | 2.0 | 1.0 | 1350 | $1,975 | $1.46 | 25d | 1 | 0.56mi |
| 2840 Wicklow St Savannah, GA | 1.0–3.0 | 1.0–2.0 | 1071 | $2,370 | $2.21 | 15d | 50 | 0.59mi |
| 1418 E 42nd St Unit 4 Savannah, GA | 1.0 | 1.0 | 900 | $1,250 | $1.39 | 25d | 1 | 0.61mi |
| 1418 E 42nd St Unit 2 Savannah, GA | 1.0 | 1.0 | 800 | $1,100 | $1.38 | 25d | 1 | 0.61mi |
| 1418 E 42nd St Unit 1 Savannah, GA | 1.0 | 1.0 | 800 | $1,100 | $1.38 | 45d | 1 | 0.61mi |
| 1436 E 42nd St Savannah, GA | 3.0 | 2.0 | 1447 | $2,290 | $1.58 | 15d | 1 | 0.62mi |
| 2110 E 56th St Savannah, GA | 3.0 | 2.0 | 1140 | $2,200 | $1.93 | 45d | 1 | 0.63mi |
| 3601 Eastgate Dr Savannah, GA | 3.0 | 2.0 | 1400 | $2,500 | $1.79 | 45d | 1 | 0.69mi |
| 1217 E 38th St Savannah, GA | 3.0 | 1.0 | 1227 | $1,675 | $1.37 | 25d | 1 | 0.76mi |
| 1205 E 38th St Savannah, GA | 2.0 | 1.0 | 1000 | $1,595 | $1.59 | 45d | 1 | 0.76mi |
| 1317 E 38th St Savannah, GA | 1.0 | 1.0 | 750 | $2,000 | $2.67 | 45d | 1 | 0.76mi |
| 1224 E 38th St Savannah, GA | 2.0 | 1.0 | 798 | $1,550 | $1.94 | 45d | 1 | 0.77mi |
| 3608 Duane Ct Savannah, GA | 2.0 | 1.0 | 975 | $1,095 | $1.12 | 25d | 1 | 0.78mi |
| 3608 Duane Ct Unit C Savannah, GA | 2.0 | 1.0 | 975 | $1,095 | $1.12 | 45d | 1 | 0.78mi |
| 1105 E 38th St Savannah, GA | 3.0 | 2.0 | 1500 | $2,400 | $1.60 | 45d | 1 | 0.78mi |
| 1326 E 38th St Savannah, GA | 2.0 | 1.0 | 800 | $1,600 | $2.00 | 15d | 1 | 0.78mi |
| 1107 E 38th St Savannah, GA | 3.0 | 2.0 | 1500 | $2,400 | $1.60 | 45d | 1 | 0.78mi |
Listing history 7 events
-
2026-05-19status Pending 211-char remark
Show marketing remark (211 chars)
Parkside opportunity in Savannah. This 2 bed, 1 bath home offers 1,088 sf with strong potential. Property ideal for a fixer-upper/investor or just a great price for home ownership. Great location and convenient.
-
2026-05-08historical Active Under Contract 211-char remark
Show marketing remark (211 chars)
Parkside opportunity in Savannah. This 2 bed, 1 bath home offers 1,088 sf with strong potential. Property ideal for a fixer-upper/investor or just a great price for home ownership. Great location and convenient.
-
2026-04-28price $249,900 211-char remark
Show marketing remark (211 chars)
Parkside opportunity in Savannah. This 2 bed, 1 bath home offers 1,088 sf with strong potential. Property ideal for a fixer-upper/investor or just a great price for home ownership. Great location and convenient.
-
2026-04-06$269,900 Active 211-char remark
Show marketing remark (211 chars)
Parkside opportunity in Savannah. This 2 bed, 1 bath home offers 1,088 sf with strong potential. Property ideal for a fixer-upper/investor or just a great price for home ownership. Great location and convenient.
-
2011-07-20soldstatus $49,500
-
2011-07-18soldstatus $49,500 79-char remark
Show marketing remark (79 chars)
Great location bungelow. Needs a little TLC. Good investment or owner occupant.
-
2011-05-25$55,000 79-char remark
Show marketing remark (79 chars)
Great location bungelow. Needs a little TLC. Good investment or owner occupant.
ⓘ Source: listings_history table (triggers on properties + properties_extension) + one-shot
backfill from property_details.listing_events for pre-trigger history.
Tax reassessment forecast GA · Resets to sale price
- Current annual tax
- $798 · $66/mo
- Projected year-2 tax
- $2,299 · $192/mo
- Expected delta
- +$1,501/yr (+$125/mo · 188.2%)
ⓘ Screening estimate from a state-policy table — verify with the county assessor before closing.
Climate risk First Street
- Flood 1/10 Low FEMA zone X (unshaded) · 0% chance over 30 yrs
- Wildfire 1/10 Low
- Heat 9/10 Extreme 7 d/yr ≥107°F today · 17 d/yr by 30 yrs out
- Wind 9/10 Extreme 99% chance of damaging wind over 30 yrs
- Air quality 2/10 Low 2 unhealthy d/yr today · 2 by 30 yrs out
Nearby sold comps map
Loading sold comps map…
Walkable amenities ~0.75 mi
Loading nearby amenities…
Taxation est. · year 1
- Rental income
- $21,324
- − Mortgage interest
- −$13,998
- − Property taxes
- −$798
- − Insurance
- −$1,250
- − Repairs & maintenance
- −$1,706
- − Management
- −$1,706
- − Depreciation
- −$7,270
- Taxable loss
- −$5,403
- Est. tax savings @ 24.0%
- +$1,297
- After-tax cash flow
- $370/yr
For passive investors: Depreciation is non-cash, so a rental often shows a tax loss while cash-flowing — sheltering income. Rental losses are passive: they offset passive income freely, and up to $25,000/yr can offset ordinary (W-2) income if you actively participate and your MAGI is under $100k (phasing out to $0 by $150k); unused losses carry forward. On sale, claimed depreciation is recaptured at up to 25%, and gains may owe capital-gains tax (a 1031 exchange can defer both). Figures are a year-1 estimate at your 24.0% rate — not tax advice; consult a CPA.
Schools (NCES district)
- District
- Savannah-Chatham County
- NCES district ID
- 1301020
- Math proficiency
- 20% ▼ -11.00%
- Reading proficiency
- 26% ▼ -5.00%
- Median HH income
- $47,443
- Composite
- 20.14/100
- National rank
- #8639
- State rank
- #134 of 174 in GA
Livability — Savannah
- Score
- 86/100
- State rank
- #1
- US rank
- #397
Category grades
Schools grade is shown separately in the Schools card above.
Census & demographics
- Census place
- Savannah, GA
- County
- Chatham County · 271,602 people
- City population
- 216,564
- Metro
- Savannah, GA
- Population (ZIP)
- 30,062
- Household income
- $53,303
- Rent vs Own
- Severe rent burden
- 1649.0
Population outlook (Chatham County) Hauer SSP2
- Today (2025)
- 332,584 people
- By 2030
- 355,508 · +6.9%
- By 2040
- 400,030 · +20.3%
- By 2050
- 443,019 · +33.2%
- By 2075
- 534,579 · +60.7%
- By 2100
- 583,863 · +75.6%
Race, ethnicity, and origin ACS 2023
- Neighborhood character
- Majority Black (60%)
- Race & ethnicity
- Black 60% White 33% Two or more races 4% Hispanic / Latino 3% Asian 1%
- Common ancestry
- Romanian 2% Lithuanian 1% Slovak 1%
- Foreign-born
- 4% · Canada, Vietnam
- Languages at home
- 93% English-only · Spanish 3% Other Asian/Pacific 1% French/Haitian/Cajun 1%
Political lean MEDSL · Chatham
- 2024 margin
- D (+18.0) · D 58.6% · R 40.6%
- 2008→2024 swing
- +3.6pp toward D · 2008: 14.4pp · 2024: 18.0pp
- All cycles
- 2024: D+18.0 2020: D+18.8 2016: D+14.5 2012: D+12.0 2008: D+14.4
Not yet ingested
- Civics
- —
Market trends
- HPI YoY
- ▼ -187.86%
- Current HPI
- 310.0764
- Rent YoY
- ▲ 3.62%
- Metro
- Savannah, GA
- State GDP YoY
- ▲ 2.66%
- F500 in state
- 28
Industry mix (Fortune 500 HQ in GA)
| Industry | F500 HQs | Revenue |
|---|---|---|
| Paper / Packaging | 2 | $29B |
|
||
| Retail | 1 | $160B |
|
||
| Transportation / Logistics | 1 | $91B |
|
||
| Airlines | 1 | $62B |
|
||
| Consumer Goods | 1 | $47B |
|
||
| Utilities | 1 | $25B |
|
||
Price history
+354.4% since first listed7 events — show timeline
- 2026-05-19 Pending — Hive MLS
- 2026-05-08 Contingent — Hive MLS
- 2026-04-28 Price Changed $249,900 Hive MLS
- 2026-04-06 Listed $269,900 Hive MLS
- 2011-07-20 Sold (Public Records) $49,500 Public Records
- 2011-07-18 Sold (MLS) $49,500 Hive MLS
- 2011-05-25 Listed $55,000 Hive MLS
Property tax history
+6.2%/yrLatest (2025): $798 · +48.3% YoY. Source: county tax records.
Cash-flow waterfall
monthlySold comps — $/sqft
last 12 mo · ≤1 miLoading sold comps…