513 Springhill Dr · Lexington-Fayette, KY
Flood risk 1/10 · Minimal
- FEMA flood zone
- X (unshaded)
- Chance of flooding over 30 yrs
- 0.0%
- Est. flood insurance / yr
- $473 – $860
Fire risk 1/10 · Minimal
- Est. fire insurance / yr
- $839 – $1,559
Heat risk 4/10 · Minor
- Hot days now (above 101°F)
- 7 days/yr
- Hot days in 30 yrs
- 19 days/yr
Wind risk 2/10 · Minimal
- Chance of severe wind over 30 yrs
- 1.0%
Air-quality risk 1/10 · Minimal
- Unhealthy air days now
- 0 days/yr
- Unhealthy air days in 30 yrs
- 0 days/yr
Risk factors via First Street. Map © Google.
Why this score? — see what drove the C+ grade
The composite is a weighted blend of 9 inputs, each scored 0–100. Each bar is that input's sub-score; the figure is the points it added to the 100-point composite (weight × sub-score).
- Cash flow +22.8/30.0
- ARV discount +15.0/15.0
- DSCR +7.3/10.0
- 1% rule +4.8/10.0
- Rent growth +3.6/5.0
- Schools +3.4/10.0
- Livability +2.5/5.0
- Condition / age +2.5/5.0
- Appreciation +0.0/10.0
$375,750
🖨 Deal sheet 📄 Offer letter ✓ Due diligence
Listing remarks
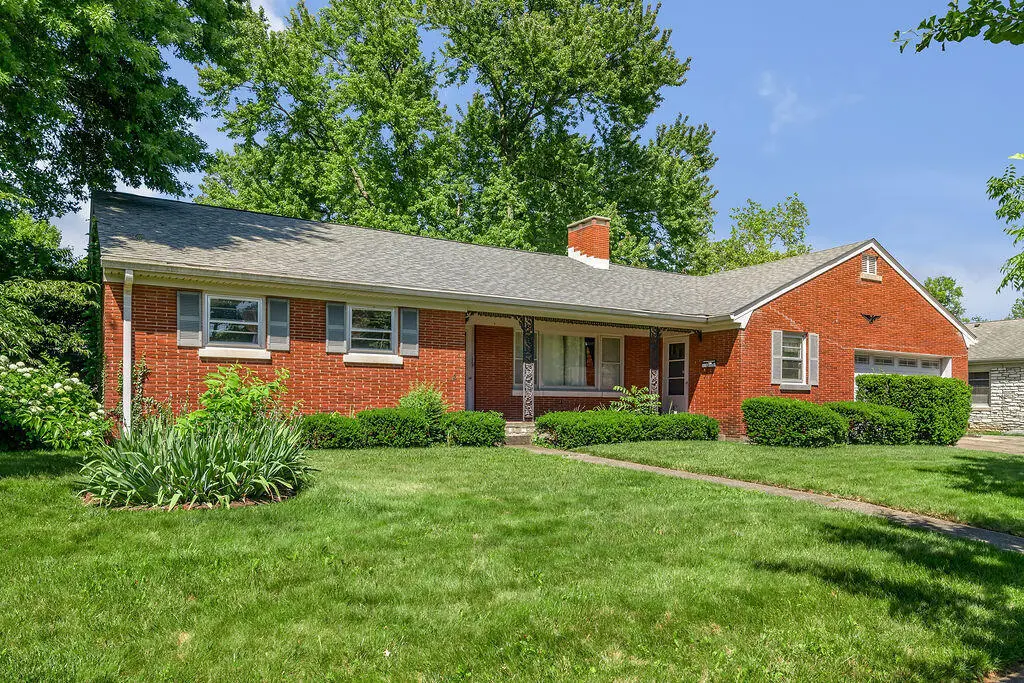
Discover the potential of this classic brick ranch, ideally situated on a generous and level 0.28-acre lot in Lexington's established Lafayette neighborhood. Built in 1954, this home offers 2,010 square feet of living space, including four bedrooms and two full bathrooms, providing a solid foundation for customization and updates. The layout supports comfortable everyday living, with ample space to reimagine and make your own. A partial basement adds approximately 924 square feet, offering options for storage, a workshop, or future finished living space. Located in southwest Lexington, the home provides convenient access to major roadways, downtown, the University of Kentucky, hospitals, pa
Key facts
- Partial basement
- Convenient access
- Level lot
Tags
Property features AI
Finance
- Other: Lot size approximately 0.283 acres (per appraiser); Building area reported as 2,010
Exterior
- Parking: Attached garage; Property has a garage
- Utilities: Public water; Public sewer; Electricity connected; Natural gas connected; Cable available
- Home design: House; Single-story
- Construction: Brick veneer exterior; Block foundation; Dimensional-style roof
- Exterior features: Workshop; Few trees on the lot; Neighborhood view; Chain link and privacy fencing
Interior
- Kitchen: Range; Refrigerator; Dishwasher not listed
- Flooring: Carpet; Vinyl
- Bathrooms: 2 full bathrooms
- Heating & cooling: Natural gas heating with floor furnace and forced air; Central electric air conditioning
- Interior features: Fireplace; Storm windows, blinds, and screens; 10 total rooms
- Laundry & utility: Washer hookup; Electric dryer hookup; Main-level laundry; Washer and dryer listed among appliances
Neighborhood map
What this means for you Summary
Snapshot
- This is a 4-bed/2.0-bath single-family listed at $376k.
Deal economics
- At list price, monthly cash flow is $655 ($8k/yr) — positive.
- The deal already cash-flows at list — no discount required.
- To meet the 1% rule (rent ≥ 1% of price), the offer needs to be $368k (2.1% below list).
- Recommended offer: $368k (2.1% below list) — sets the bar for 1% rule.
- Cap rate 8.4% vs local median 3.8% in Lexington-Fayette — top-decile yield for the area; either an underpriced asset or a hidden risk that comps aren't pricing in. Stress-test before assuming the spread holds.
Location & tenants
- Location reads: area grade C — affects rentability + tenant quality, not the cash-flow math above.
- Fayette County (urban): math 35% / reading 45% proficiency, ranked #27 of 165 in KY (top 16%) — families likely to look elsewhere, expect single-tenant / working-renter base with shorter leases.
- Zoned schools: Picadome Elementary School (math 32% / reading 42%, grade F, #255 of 676 statewide, top 42%, 430 students, 56% FRL); Morton Middle School (math 41% / reading 58%, grade C, #25 of 217 statewide, top 12%, 705 students, 43% FRL); Lafayette High School (math 47% / reading 54%, grade D+, #10 of 254 statewide, top 4%, 2,432 students, 38% FRL) — zoned schools at 46% FRL track the district average.
- Market conditions: Rents rising fast (+4.4%/yr); 78 active listings in the ZIP; 3 comparable units currently listed for rent nearby; rentals at typical pace (median 24d on market — plan ~3-4 weeks tenant-placement turnaround); solid renter incomes; 1,036 units permitted in Fayette County in 2024 (542 in 5+ unit buildings).
- At $3,678/mo this rent would consume 58% of the median local household income ($76k/yr) (locally 1151% of renters already pay >50% of income on rent) — very limited rent-growth headroom before tenants either downsize or default.
Forward outlook
- Local home prices are declining (-3.0%/yr); year-one equity from $3k of loan paydown is wiped out by about $11k of value loss. Plan a longer hold.
- Fayette County population projected at +35% by 2050 — long-run rental-demand tailwind backs the buy-and-hold thesis.
Negotiation context
- Only 1 days on market — expect competitive offers; lowballing is unlikely to land.
Risks & watch-outs
- Watch-outs: built in 1954 — expect roof / HVAC / electrical / plumbing capex.
Questions for the listing agent
- Built in 1954 — when were the roof, HVAC, electrical panel, plumbing, and water heater last replaced?
- Is there a deadline driving the sale (1031 exchange, divorce, estate, relocation)? That informs how much negotiation room exists.
- What's the average days-on-market for RENTAL listings here right now (not sales)? A rising rental-DOM trend means longer vacancies and softer asking-rent achievability than the comps imply.
- What's the recent tenant-quality profile in this submarket — average credit score on applications, eviction rate, late-payment / NSF rate, and stable-employment percentage? A property-management company in the area should have these aggregated.
- How much new for-sale + rental construction is in the pipeline within 1–3 miles? Heavy new supply typically softens prices + rents 12–24 months out; constrained supply supports both.
Investment metrics
- 1% rule
- 0.98% ✗
- Cap rate
- 8.39%
- Cash-on-cash
- 7.48%
- DSCR
- 1.33
- GRM
- 8.5
CMA / ARV
- ARV (on-the-fly)
- $506,588
- Comps found
- 9
Show comp detail 9 sales within ~0.75 mi
| Address | Dist | Beds/Ba | Sqft | Sold | Price | $/sf | Match |
|---|---|---|---|---|---|---|---|
| 720 Lynn Rd | 0.36mi | 4/3.0 | 2,797 (-2%) | 18mo | $370,000 | $132 | 61 |
| 427 Springhill Dr | 0.35mi | 3/3.0 (-1) | 2,653 (-7%) | 3mo | $495,000 | $187 | 61 |
| 530 Mccubbing Dr | 0.10mi | 4/2.5 | 2,458 (-14%) | 14mo | $550,000 | $224 | 59 |
| 518 Arcadia Park | 0.68mi | 4/2.0 | 2,766 (-3%) | 7mo | $591,000 | $214 | 58 |
| 292 Rosemont Gdn | 0.58mi | 3/2.0 (-1) | 2,680 (-6%) | 4mo | $420,100 | $157 | 55 |
| 1804 Clays Mill Rd | 0.20mi | 4/2.0 | 2,475 (-13%) | 23mo | $367,000 | $148 | 50 |
| 1716 Chandler Ln | 0.42mi | 4/3.0 | 2,461 (-14%) | 5mo | $439,000 | $178 | 49 |
| 337 Arcadia Park | 0.64mi | 4/3.0 | 2,643 (-7%) | 8mo | $575,000 | $218 | 48 |
| 691 Springhurst Dr | 0.67mi | 4/3.0 | 3,072 (+8%) | 13mo | $312,000 | $102 | 41 |
Match score weights: distance 35% · size 25% · config 20% · recency 20%. Top-matched comps best support the ARV.
Projected returns pro-forma
-3.0% appreciation · 4.4% rent growth · sell at horizon
- IRR
- -3.5%
- Equity multiple
- 0.87×
- Total profit
- $-14,046
- Equity at exit
- $56,026
- IRR
- 7.5%
- Equity multiple
- 1.60×
- Total profit
- $63,065
- Equity at exit
- $32,488
Cash invested: $105,210 (down + closing). Projections, not guarantees.
Landlord ↔ Tenant lean methodology
- Overall (STATE)
- 83 Strongly Landlord-Friendly
- State Kentucky
- 83 Strongly Landlord-Friendly · R+16
- County
- — inherits STATE
- City
- — inherits STATE
ZIP-level market 40503
- Rents YoY
- 4.4%
- Active inventory
- 78
- Price-to-rent
- 8.5×
Monthly cashflow live
- Estimated rent
- $3,678 medium interval (Pro) →
- Mortgage (P&I)
- −$1,970
- Tax from tax record
- −$123 /mo · $1,477/yr
- Insurance
- −$157
- HOA
- −$0
- Vacancy / Maint / Mgmt
- −$772
- Net cashflow
- $655
Break-even live
UW: 25.0% down · 7.5% · 30yr · 1.5% tax · 5.0% vac · 8.0% maint · 8.0% mgmt
Financing live
Cash to close
- Down payment
- $93,938
- Closing costs
- $11,272
- Reserves months
- —
- Total cash needed
- —
Loan-product check · same deal, 3 products live
Conventional
25% down · 7.5% · 30yr
- Down + closing
- —
- Monthly P&I
- —
- Monthly cashflow
- —
- DSCR
- —
- Eligible?
- —
Personal DTI + credit; lowest rate.
DSCR
20% down · 8.5% · 30yr
- Down + closing
- —
- Monthly P&I
- —
- Monthly cashflow
- —
- DSCR
- —
- Eligible?
- —
No personal income docs; deal must DSCR.
Hard money
10% down · 12.0% · 12mo
- Down + closing
- —
- Monthly P&I
- —
- Monthly cashflow
- —
- DSCR
- —
- Eligible?
- —
Short-term bridge; refi at stabilization.
Rent comps 3 comps
| Address | Beds | Baths | Sqft | Rent | $/sqft | DOM | Units | Dist |
|---|---|---|---|---|---|---|---|---|
| 1570 Bluebird Ln Lexington, KY | 5.0 | 5.0 | 2255 | $5,000 | $2.22 | 23d | 1 | 0.46mi |
| 1220 Hammond Ave Lexington, KY | 4.0 | 2.0 | 1949 | $1,850 | $0.95 | 14d | 1 | 1.36mi |
| 2505 Eastway Dr Lexington, KY | 4.0 | 3.5 | 3068 | $4,200 | $1.37 | 23d | 1 | 1.45mi |
Listing history 3 events
-
2026-06-05status $375,750 Pending 1 DOM
-
2026-06-03remarks 699-char remark
-
2026-06-03$375,750 Active 1 DOM
ⓘ Source: listings_history table (triggers on properties + properties_extension) + one-shot
backfill from property_details.listing_events for pre-trigger history.
Tax reassessment forecast KY · Resets to sale price
- Current annual tax
- $1,477 · $123/mo
- Projected year-2 tax
- $3,231 · $269/mo
- Expected delta
- +$1,755/yr (+$146/mo · 118.8%)
ⓘ Screening estimate from a state-policy table — verify with the county assessor before closing.
Climate risk First Street
- Flood 1/10 Low FEMA zone X (unshaded) · 0% chance over 30 yrs
- Wildfire 1/10 Low
- Heat 4/10 Moderate 7 d/yr ≥101°F today · 19 d/yr by 30 yrs out
- Wind 2/10 Low 100% chance of damaging wind over 30 yrs
- Air quality 1/10 Low 0 unhealthy d/yr today · 0 by 30 yrs out
Nearby sold comps map
Loading sold comps map…
Walkable amenities ~0.75 mi
Loading nearby amenities…
Taxation est. · year 1
- Rental income
- $44,135
- − Mortgage interest
- −$21,048
- − Property taxes
- −$1,477
- − Insurance
- −$1,879
- − Repairs & maintenance
- −$3,531
- − Management
- −$3,531
- − Depreciation
- −$10,931
- Taxable income
- $1,739
- Est. tax owed @ 24.0%
- −$417
- After-tax cash flow
- $7,448/yr
For passive investors: Depreciation is non-cash, so a rental often shows a tax loss while cash-flowing — sheltering income. Rental losses are passive: they offset passive income freely, and up to $25,000/yr can offset ordinary (W-2) income if you actively participate and your MAGI is under $100k (phasing out to $0 by $150k); unused losses carry forward. On sale, claimed depreciation is recaptured at up to 25%, and gains may owe capital-gains tax (a 1031 exchange can defer both). Figures are a year-1 estimate at your 24.0% rate — not tax advice; consult a CPA.
Schools (NCES district)
- District
- Fayette County
- NCES district ID
- 2101860
- Math proficiency
- 35% ▼ -16.00%
- Reading proficiency
- 45% ▼ -13.00%
- Median HH income
- $49,245
- Composite
- 34.38/100
- National rank
- #5211
- State rank
- #27 of 165 in KY
Livability — Lexington-Fayette
No livability data for this city. (Only ~50 U.S. cities are tracked.)
Census & demographics
- Census place
- Lexington-Fayette, KY
- County
- Fayette County · 317,143 people
- City population
- 321,882
- Metro
- Lexington-Fayette, KY
- Population (ZIP)
- 27,451
- Household income
- $76,482
- Rent vs Own
- Severe rent burden
- 1151.0
Population outlook (Fayette County) Hauer SSP2
- Today (2025)
- 363,454 people
- By 2030
- 388,270 · +6.8%
- By 2040
- 438,688 · +20.7%
- By 2050
- 490,667 · +35.0%
- By 2075
- 625,394 · +72.1%
- By 2100
- 721,354 · +98.5%
Race, ethnicity, and origin ACS 2023
- Neighborhood character
- Predominantly White (81%)
- Race & ethnicity
- White 81% Hispanic / Latino 7% Two or more races 7% Asian 6% Black 3%
- Hispanic origin (detail)
- Mexican 4%
- Common ancestry
- Slovak 4% Italian 3% Serbian 3%
- Foreign-born
- 11% · Canada, China, India
- Languages at home
- 87% English-only · Spanish 4% Other Indo-European 3% Other Asian/Pacific 1%
Political lean MEDSL · Fayette
- 2024 margin
- D (+18.1) · D 58.0% · R 39.9% · Other 2.1%
- 2008→2024 swing
- +13.3pp toward D · 2008: 4.8pp · 2024: 18.1pp
- All cycles
- 2024: D+18.1 2020: D+20.8 2016: D+9.5 2012: D+1.0 2008: D+4.8
Not yet ingested
- Civics
- —
Market trends
- HPI YoY
- ▼ -280.10%
- Current HPI
- 241.5612
- Rent YoY
- ▲ 4.40%
- Metro
- Lexington-Fayette, KY
- State GDP YoY
- ▲ 1.81%
- F500 in state
- 4
Industry mix (Fortune 500 HQ in KY)
| Industry | F500 HQs | Revenue |
|---|---|---|
| Healthcare | 1 | $118B |
|
||
| Food / Beverage | 1 | $7B |
|
||
Price history
1 event — show timeline
- 2026-06-03 Listed $375,750 ImagineMLS
Property tax history
+1.4%/yrLatest (2015): $1,477 · +1.4% YoY. Source: county tax records.
Cash-flow waterfall
monthlySold comps — $/sqft
last 12 mo · ≤1 miLoading sold comps…