447 Durkee Rd SE · Cleveland, TN
Flood risk 1/10 · Minimal
- FEMA flood zone
- X (unshaded)
- Chance of flooding over 30 yrs
- 0.0%
- Est. flood insurance / yr
- $507 – $1,088
Fire risk 4/10 · Minor
- Est. fire insurance / yr
- $949 – $1,763
Heat risk 6/10 · Moderate
- Hot days now (above 105°F)
- 7 days/yr
- Hot days in 30 yrs
- 19 days/yr
Wind risk 3/10 · Minor
- Chance of severe wind over 30 yrs
- 6.0%
Air-quality risk 3/10 · Minor
- Unhealthy air days now
- 2 days/yr
- Unhealthy air days in 30 yrs
- 3 days/yr
Risk factors via First Street. Map © Google.
Why this score? — see what drove the B- grade
The composite is a weighted blend of 9 inputs, each scored 0–100. Each bar is that input's sub-score; the figure is the points it added to the 100-point composite (weight × sub-score).
- Cash flow +30.0/30.0
- DSCR +10.0/10.0
- 1% rule +8.6/10.0
- ARV discount +7.5/15.0
- Livability +3.5/5.0
- Schools +3.0/10.0
- Rent growth +2.5/5.0
- Condition / age +2.5/5.0
- Appreciation +0.0/10.0
$149,000
🖨 Deal sheet (PDF) 📄 Offer letter ✓ Due diligence
Listing remarks MLS
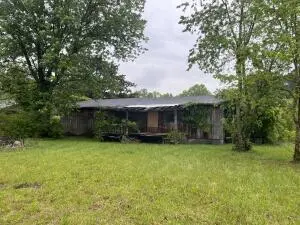
Residential building needs renovation and repairs. On a nice half acre lot the renovation will be worth it. Approximately 3000 square feet will make a beautiful home in Cleveland, TN of of Hwy 64. Priced only reduced to $119,900 Bring offers. All offers will be considered!
Key facts
- Half acre lot
- 0.51 acre lot
- Built 1970
Tags
Property features AI
Finance
- Other: Property type: Residential; Property subtype: Single Family Residence
- HOA & community: No community features
Exterior
- Parking: Gravel parking
- Utilities: Public water available; Septic tank for sewer; Electricity available; Phone service available; Cable available; Natural gas not available; Water available, sewer not available
- Home design: Single family residence; One level; Fixer condition
- Construction: Wood siding construction; Block foundation; Shingle roof; Built-up living area above grade: 3,009
- Exterior features: Other exterior features; Level, cleared lot; County road frontage; Paved public road access
Interior
- Flooring: Other flooring
- Bathrooms: 2 full bathrooms
- Heating & cooling: No heating; No cooling
- Interior features: Other interior features
- Laundry & utility: Laundry features: Other
Neighborhood map
What this means for you Summary
Snapshot
- This is a 3-bed/1.0-bath single-family listed at $149k.
Deal economics
- At list price, monthly cash flow is $715 ($9k/yr) — positive.
- The deal already cash-flows at list — no discount required.
- Meets the 1% rule at list price ($2k rent vs $149k).
- Recommended offer: $145k (3.0% below list) — sets the bar for market timing.
- Cap rate 12.1% vs local median 3.5% in Cleveland — top-decile yield for the area; either an underpriced asset or a hidden risk that comps aren't pricing in. Stress-test before assuming the spread holds.
Location & tenants
- Location reads 70/100 on livability (#55 in TN) — a middle-class / working-renter tenant base. Strengths: cost of living A+, health & safety A+, housing A; Watch: employment D, crime F, amenities F.
- Bradley County (other): math 35% / reading 34% proficiency, ranked #33 of 139 in TN (top 24%) — families likely to look elsewhere, expect single-tenant / working-renter base with shorter leases.
- Zoned schools: Oak Grove Elementary School (math 32% / reading 37%, grade F, #319 of 952 statewide, top 37%, 406 students, 0% FRL); Lake Forest Middle School (math 32% / reading 26%, grade F, #110 of 333 statewide, top 34%, 1,127 students, 0% FRL); Bradley Central High School (math 13% / reading 31%, grade F, #163 of 332 statewide, top 51%, 1,677 students, 0% FRL) — zoned schools average 0% FRL vs 46% district-wide (46 pts lower); this property's tenant base skews higher-income than the district average.
- Market conditions: 374 active listings in the ZIP; 1 comparable units currently listed for rent nearby; 768 units permitted in Bradley County in 2024 (0 in 5+ unit buildings).
- This rent runs 35% of the median local income ($69k/yr) — at the standard rent-burdened threshold; future hikes will face affordability resistance.
Forward outlook
- Local home prices are declining (-3.0%/yr); year-one equity from $1k of loan paydown is wiped out by about $4k of value loss. Plan a longer hold.
- Bradley County population projected at +21% by 2050 — long-run rental-demand tailwind backs the buy-and-hold thesis.
- At projected returns (-3.0% appreciation + 3.0% rent growth), your $42k cash investment doubles in ~6 years — after that, you're playing with house money.
Negotiation context
- It's been on market 53 days — a 3% lower offer ($145k) is reasonable based on typical stale-listing flexibility.
- 4 sale attempts since 5y ago with the ask held roughly flat each time — persistent listings suggest the price (not the market) is what's stuck; bring a comps-based counter.
Risks & watch-outs
- Climate carrying-cost: extreme-heat days projected 7→19/yr by 2055 (HVAC capex compounding) — expect insurance premiums to compound above CPI over the hold.
Questions for the listing agent
- It's been on market 53 days. Have you received any prior offers? Is the seller open to a 3% concession, seller financing, or rate buy-down credit?
- Built in 1970 — when were the roof, HVAC, electrical panel, plumbing, and water heater last replaced?
- Is there a deadline driving the sale (1031 exchange, divorce, estate, relocation)? That informs how much negotiation room exists.
- Schools are D-rated, which usually means shorter tenancies and higher turnover. Who's the typical renter profile here, and what's been the actual vacancy rate?
- Crime grade is F in this area — have there been break-ins, vandalism, or insurance claims at this property in the last 3 years? What carrier currently insures it and at what premium?
- What's the average days-on-market for RENTAL listings here right now (not sales)? A rising rental-DOM trend means longer vacancies and softer asking-rent achievability than the comps imply.
- What's the recent tenant-quality profile in this submarket — average credit score on applications, eviction rate, late-payment / NSF rate, and stable-employment percentage? A property-management company in the area should have these aggregated.
- How much new for-sale + rental construction is in the pipeline within 1–3 miles? Heavy new supply typically softens prices + rents 12–24 months out; constrained supply supports both.
Investment metrics
- 1% rule
- 1.36% ✓
- Cap rate
- 12.05%
- Cash-on-cash
- 20.57%
- DSCR
- 1.92
- GRM
- 6.1
CMA / ARV
- ARV (median comp)
- $338,771
- List price
- $149,000
- Delta
- -56.02%
- Verdict
- UNDERPRICED
- Comps
- 5 within 1.0 mi
Show comp detail 2 sales within ~0.75 mi
| Address | Dist | Beds/Ba | Sqft | Sold | Price | $/sf | Match |
|---|---|---|---|---|---|---|---|
| 120 NE Meadowwood Cir | 0.52mi | 3/2.5 | 2,907 (-3%) | 23mo | $665,000 | $229 | 45 |
| 3024 Bates Pike SE | 0.45mi | 4/3.0 (+1) | 3,371 (+12%) | 6mo | $339,900 | $101 | 41 |
Match score weights: distance 35% · size 25% · config 20% · recency 20%. Top-matched comps best support the ARV.
Projected returns pro-forma
-3.0% appreciation · 3.0% rent growth · sell at horizon
- IRR
- 12.9%
- Equity multiple
- 1.51×
- Total profit
- $21,349
- Equity at exit
- $22,216
- IRR
- 21.7%
- Equity multiple
- 2.85×
- Total profit
- $77,006
- Equity at exit
- $12,883
Cash invested: $41,720 (down + closing). Projections, not guarantees.
Landlord ↔ Tenant lean methodology
- Overall (STATE)
- 87 Strongly Landlord-Friendly
- State Tennessee
- 87 Strongly Landlord-Friendly · R+13
- County
- — inherits STATE
- City
- — inherits STATE
ZIP-level market 37323
- Home prices YoY
- -23.5%
- Active inventory
- 374
- Price-to-rent
- 6.1×
Monthly cashflow live
- Estimated rent
- $2,024 medium interval (Pro) →
- Mortgage (P&I)
- −$781
- Tax from tax record
- −$41 /mo · $488/yr
- Insurance
- −$62
- HOA
- −$0
- Vacancy / Maint / Mgmt
- −$425
- Net cashflow
- $715
Break-even live
Sensitivity live
| Price | -10% $800 | -5% $757 | +0% $715 | +5% $673 | +10% $631 |
|---|---|---|---|---|---|
| Rent | -10% $555 | -5% $635 | +0% $715 | +5% $795 | +10% $875 |
| Rate | -1.0pp $790 | -0.5pp $753 | base $715 | +0.5pp $677 | +1.0pp $637 |
UW: 25.0% down · 7.5% · 30yr · 1.5% tax · 5.0% vac · 8.0% maint · 8.0% mgmt
Financing live
Cash to close
- Down payment
- $37,250
- Closing costs
- $4,470
- Reserves months
- —
- Total cash needed
- —
Loan-product check · same deal, 3 products live
Conventional
25% down · 7.5% · 30yr
- Down + closing
- —
- Monthly P&I
- —
- Monthly cashflow
- —
- DSCR
- —
- Eligible?
- —
Personal DTI + credit; lowest rate.
DSCR
20% down · 8.5% · 30yr
- Down + closing
- —
- Monthly P&I
- —
- Monthly cashflow
- —
- DSCR
- —
- Eligible?
- —
No personal income docs; deal must DSCR.
Hard money
10% down · 12.0% · 12mo
- Down + closing
- —
- Monthly P&I
- —
- Monthly cashflow
- —
- DSCR
- —
- Eligible?
- —
Short-term bridge; refi at stabilization.
Rent comps 1 comps
| Address | Beds | Baths | Sqft | Rent | $/sqft | DOM | Units | Dist |
|---|---|---|---|---|---|---|---|---|
| 4033 Billie Ln NE Cleveland, TN | 4.0 | 2.5 | 2804 | $2,670 | $0.95 | 45d | 1 | 1.02mi |
Listing history 22 events
-
2026-06-21days on market $149,000 Active 53 DOM
-
2026-06-19days on market $149,000 Active 51 DOM
-
2026-06-18days on market $149,000 Active 50 DOM
-
2026-06-17days on market $149,000 Active 49 DOM
-
2026-06-16days on market $149,000 Active 48 DOM
-
2026-06-15days on market $149,000 Active 47 DOM
-
2026-06-14days on market $149,000 Active 45 DOM
-
2026-06-13days on market $149,000 Active 44 DOM
-
2026-06-10days on market $149,000 Active 42 DOM
-
2026-06-09days on market $149,000 Active 41 DOM
-
2026-06-08days on market $149,000 Active 40 DOM
-
2026-06-07days on market $149,000 Active 39 DOM
-
2026-06-05days on market $149,000 Active 36 DOM
-
2026-06-02days on market $149,000 Active 34 DOM
-
2026-06-01days on market $149,000 Active 33 DOM
-
2026-05-31days on market $149,000 Active 32 DOM
-
2026-05-30days on market $149,000 Active 31 DOM
-
2026-04-29$149,000 Active 243-char remark
-
2025-12-03historical 275-char remark
Show marketing remark (275 chars)
Residential building needs renovation and repairs. On a nice half acre lot the renovation will be worth it. Approximately 3000 square feet will make a beautiful home in Cleveland, TN of of Hwy 64. Priced only reduced to $119,900 Bring offers. All offers will be considered!
-
2025-12-03$119,900 275-char remark
Show marketing remark (275 chars)
Residential building needs renovation and repairs. On a nice half acre lot the renovation will be worth it. Approximately 3000 square feet will make a beautiful home in Cleveland, TN of of Hwy 64. Priced only reduced to $119,900 Bring offers. All offers will be considered!
-
2023-04-26$119,900
-
2021-06-01$79,900
ⓘ Source: listings_history table (triggers on properties + properties_extension) + one-shot
backfill from property_details.listing_events for pre-trigger history.
Tax reassessment forecast TN · Resets to sale price
- Current annual tax
- $488 · $41/mo
- Projected year-2 tax
- $1,058 · $88/mo
- Expected delta
- +$570/yr (+$47/mo · 116.8%)
ⓘ Screening estimate from a state-policy table — verify with the county assessor before closing.
Climate risk First Street
- Flood 1/10 Low FEMA zone X (unshaded) · 0% chance over 30 yrs
- Wildfire 4/10 Moderate
- Heat 6/10 Major 7 d/yr ≥105°F today · 19 d/yr by 30 yrs out
- Wind 3/10 Moderate 6% chance of damaging wind over 30 yrs
- Air quality 3/10 Moderate 2 unhealthy d/yr today · 3 by 30 yrs out
Nearby sold comps map
Loading sold comps map…
Walkable amenities ~0.75 mi
Loading nearby amenities…
Taxation est. · year 1
- Rental income
- $24,294
- − Mortgage interest
- −$8,346
- − Property taxes
- −$488
- − Insurance
- −$745
- − Repairs & maintenance
- −$1,943
- − Management
- −$1,943
- − Depreciation
- −$4,335
- Taxable income
- $6,493
- Est. tax owed @ 24.0%
- −$1,558
- After-tax cash flow
- $7,024/yr
For passive investors: Depreciation is non-cash, so a rental often shows a tax loss while cash-flowing — sheltering income. Rental losses are passive: they offset passive income freely, and up to $25,000/yr can offset ordinary (W-2) income if you actively participate and your MAGI is under $100k (phasing out to $0 by $150k); unused losses carry forward. On sale, claimed depreciation is recaptured at up to 25%, and gains may owe capital-gains tax (a 1031 exchange can defer both). Figures are a year-1 estimate at your 24.0% rate — not tax advice; consult a CPA.
Schools (NCES district)
- District
- Bradley County
- NCES district ID
- 4700330
- Math proficiency
- 35% ▼ -5.00%
- Reading proficiency
- 34% ▼ -2.00%
- Median HH income
- $45,807
- Composite
- 29.54/100
- National rank
- #6494
- State rank
- #33 of 139 in TN
Livability — Cleveland
- Score
- 70/100
- State rank
- #55
- US rank
- #7689
Category grades
Schools grade is shown separately in the Schools card above.
Census & demographics
- County
- Bradley County · 99,337 people
- City population
- 99,337
- Metro
- Cleveland, TN
- Population (ZIP)
- 31,948
- Household income
- $68,768
- Rent vs Own
- Severe rent burden
- 371.0
Population outlook (Bradley County) Hauer SSP2
- Today (2025)
- 114,901 people
- By 2030
- 120,137 · +4.6%
- By 2040
- 130,125 · +13.2%
- By 2050
- 139,257 · +21.2%
- By 2075
- 161,664 · +40.7%
- By 2100
- 179,767 · +56.5%
Race, ethnicity, and origin ACS 2023
- Neighborhood character
- Predominantly White (88%)
- Race & ethnicity
- White 88% Hispanic / Latino 7% Two or more races 6% Black 1%
- Hispanic origin (detail)
- Mexican 4% Puerto Rican 1%
- Common ancestry
- Lithuanian 2% Subsaharan African 2% Italian 1%
- Foreign-born
- 4% · Canada
- Languages at home
- 93% English-only · Spanish 5% Russian/Polish/Slavic 2%
Political lean MEDSL · Bradley
- 2024 margin
- Solid R (+58.9) · D 20.0% · R 78.9% · Other 1.1%
- 2008→2024 swing
- -9.2pp toward R · 2008: -49.7pp · 2024: -58.9pp
- All cycles
- 2024: R+58.9 2020: R+55.3 2016: R+59.1 2012: R+53.9 2008: R+49.7
Not yet ingested
- Civics
- —
Market trends
- HPI YoY
- ▼ -88.38%
- Current HPI
- 287.3643
- Rent YoY
- —
- Metro
- Cleveland, TN
- State GDP YoY
- ▲ 2.78%
- F500 in state
- 22
Industry mix (Fortune 500 HQ in TN)
| Industry | F500 HQs | Revenue |
|---|---|---|
| Healthcare | 3 | $91B |
|
||
| Retail | 3 | $72B |
|
||
| Transportation / Logistics | 1 | $88B |
|
||
| Paper / Packaging | 1 | $19B |
|
||
| Insurance | 1 | $13B |
|
||
| Energy | 1 | $12B |
|
||
Price history
+86.5% since first listed5 events — show timeline
- 2026-04-29 Listed $149,000 RCAOR
- 2025-12-03 Listing Removed — REALTRACS as Distributed by MLS Grid
- 2025-12-03 Listed $119,900 REALTRACS as Distributed by MLS Grid
- 2023-04-26 Listed $119,900 RCAOR
- 2021-06-01 Listed $79,900 RCAOR
Property tax history
-11.2%/yrLatest (2025): $488 · +293.5% YoY. Source: county tax records.
Cash-flow waterfall
monthlySold comps — $/sqft
last 12 mo · ≤1 miLoading sold comps…