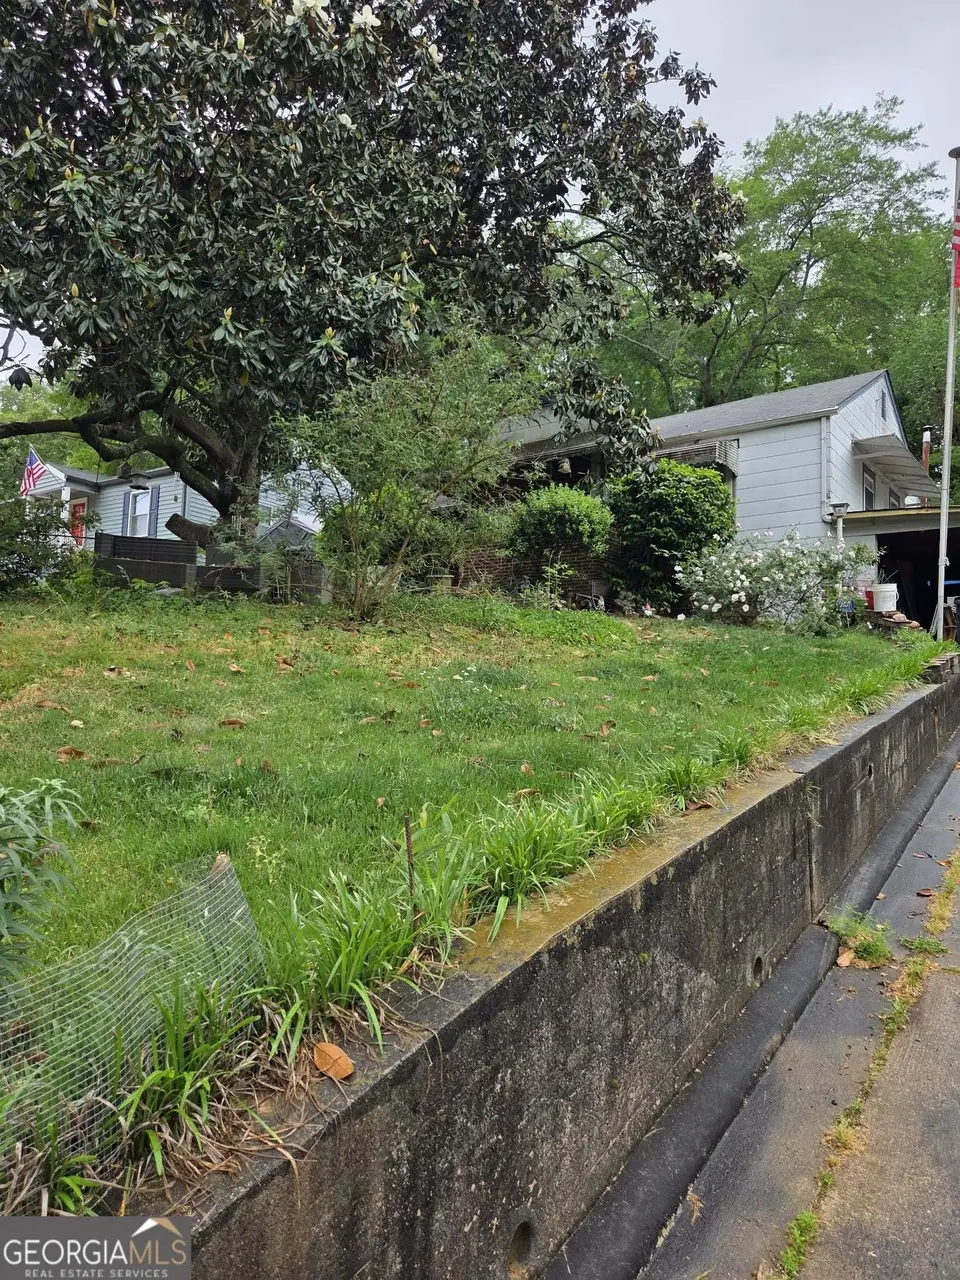
2943 Akron St · East Point, GA
Flood risk 1/10 · Minimal
- FEMA flood zone
- X (unshaded)
- Chance of flooding over 30 yrs
- 0.0%
- Est. flood insurance / yr
- $473 – $860
Fire risk 1/10 · Minimal
- Est. fire insurance / yr
- $963 – $1,789
Heat risk 5/10 · Moderate
- Hot days now (above 104°F)
- 7 days/yr
- Hot days in 30 yrs
- 17 days/yr
Wind risk 6/10 · Moderate
- Chance of severe wind over 30 yrs
- 27.0%
Air-quality risk 4/10 · Minor
- Unhealthy air days now
- 4 days/yr
- Unhealthy air days in 30 yrs
- 6 days/yr
Risk factors via First Street. Map © Google.
Why this score? — see what drove the C- grade
The composite is a weighted blend of 9 inputs, each scored 0–100. Each bar is that input's sub-score; the figure is the points it added to the 100-point composite (weight × sub-score).
- Cash flow +19.2/30.0
- ARV discount +7.5/15.0
- DSCR +6.1/10.0
- 1% rule +5.1/10.0
- Schools +4.5/10.0
- Livability +3.6/5.0
- Rent growth +2.8/5.0
- Condition / age +2.5/5.0
- Appreciation +0.0/10.0
$150,000
🖨 Deal sheet 📄 Offer letter ✓ Due diligence
Listing remarks
CALLING ALL INVESTORS!! This 1949 conventional-style ranch is a diamond in the rough, situated on a generous 0.27-acre lot in the established River Park neighborhood. If you are looking for a project with significant equity potential, this is the one. Located just minutes from the Atlanta Airport, Tyler Perry Studios, and the booming downtown districts of East Point and Hapeville, this property is perfectly positioned for a high-return flip or a long-term rental. The neighborhood is seeing a wave of renovations, and this home is ready to be the next success story. This property is being sold AS-IS. It requires a full rehabilitation, including updates to the interior, systems, and cosmetics.
Key facts
- 0.27 acre lot
- Built 1935
- Listed 41 days
Property features AI
Finance
- Other: Lot size approximately 0.273 acre (11,892 sq ft) during public records; No community amenities listed
- Financial info: Listing is offered As-Is; Listing terms: Cash or Other
- HOA & community: No HOA
Exterior
- Parking: Open parking available; Parking pad; Parking shed
- Utilities: Public water; Public sewer (sewer connected); Electricity available; Natural gas available; High-speed internet available; Cable available; Phone available; Water available
- Home design: Single-family residence (house); Residential property type; Fixer condition; Built in 1935
- Construction: Vinyl siding; Wood siding; Composition roof; Total building area 2,100 (owner-reported)
- Exterior features: Sloped lot
Interior
- Kitchen: Refrigerator
- Bedrooms: 3 bedrooms total (2 on main level, 1 on lower level)
- Flooring: Other flooring (unspecified)
- Bathrooms: 2 full bathrooms (both on main level)
- Heating & cooling: Has heating (type: other); Window unit(s) for cooling
- Interior features: Partial finished basement; One-level layout; Gas water heater; Owner-reported living area (2,100 total; 1,250 above grade, 850 below grade); Fireplace (1)
- Laundry & utility: Laundry - other (details unspecified)
Neighborhood map
What this means for you Summary
Snapshot
- This is a 2-bed/2.0-bath single-family listed at $150k.
Deal economics
- At list price, monthly cash flow is $161 ($2k/yr) — positive.
- The deal already cash-flows at list — no discount required.
- Meets the 1% rule at list price ($2k rent vs $150k).
- Recommended offer: $146k (3.0% below list) — sets the bar for market timing.
- Cap rate 7.6% vs local median 5.1% in East Point — top-decile yield for the area; either an underpriced asset or a hidden risk that comps aren't pricing in. Stress-test before assuming the spread holds.
Location & tenants
- Location reads 72/100 on livability (#72 in GA) — a middle-class / working-renter tenant base. Strengths: commute A+, cost of living A+, housing A+; Watch: employment D+, schools F, crime F.
- Fulton County (suburban): math 49% / reading 53% proficiency, ranked #12 of 174 in GA (top 7%) — acceptable for families but not a draw, mixed tenant base, ~2y average lease.
- Market conditions: Rents rising (+1.4%/yr); 283 active listings in the ZIP; 40 comparable units currently listed for rent nearby; rentals at typical pace (median 22d on market — plan ~3-4 weeks tenant-placement turnaround); 11,565 units permitted in Fulton County in 2024 (8,159 in 5+ unit buildings).
Forward outlook
- Local home prices are declining (-3.0%/yr); year-one equity from $1k of loan paydown is wiped out by about $4k of value loss. Plan a longer hold.
- Fulton County population projected at +38% by 2050 — long-run rental-demand tailwind backs the buy-and-hold thesis.
Negotiation context
- It's been on market 42 days — a 3% lower offer ($146k) is reasonable based on typical stale-listing flexibility.
- 2 sale attempts; this cycle's ask has dropped $75k (33%) from the opening price — seller is motivated, your offer sets the floor, not the list.
- Current owner paid $41k; list at $150k implies a 266% gain — meaningful room to come down on a strong offer.
Risks & watch-outs
- Watch-outs: built in 1935 — expect roof / HVAC / electrical / plumbing capex.
- Climate carrying-cost: major wind risk, 27% chance of damaging wind over 30y; extreme-heat days projected 7→17/yr by 2055 (HVAC capex compounding) — expect insurance premiums to compound above CPI over the hold.
Questions for the listing agent
- It's been on market 42 days. Have you received any prior offers? Is the seller open to a 3% concession, seller financing, or rate buy-down credit?
- Built in 1935 — when were the roof, HVAC, electrical panel, plumbing, and water heater last replaced?
- Is there a deadline driving the sale (1031 exchange, divorce, estate, relocation)? That informs how much negotiation room exists.
- Schools are F-rated, which usually means shorter tenancies and higher turnover. Who's the typical renter profile here, and what's been the actual vacancy rate?
- Crime grade is F in this area — have there been break-ins, vandalism, or insurance claims at this property in the last 3 years? What carrier currently insures it and at what premium?
- What's the average days-on-market for RENTAL listings here right now (not sales)? A rising rental-DOM trend means longer vacancies and softer asking-rent achievability than the comps imply.
- What's the recent tenant-quality profile in this submarket — average credit score on applications, eviction rate, late-payment / NSF rate, and stable-employment percentage? A property-management company in the area should have these aggregated.
- How much new for-sale + rental construction is in the pipeline within 1–3 miles? Heavy new supply typically softens prices + rents 12–24 months out; constrained supply supports both.
Investment metrics
- 1% rule
- 1.01% ✓
- Cap rate
- 7.58%
- Cash-on-cash
- 4.61%
- DSCR
- 1.21
- GRM
- 8.2
CMA / ARV
- ARV (median comp)
- $350,037
- List price
- $150,000
- Delta
- -57.15%
- Verdict
- UNDERPRICED
- Comps
- 20 within 1.0 mi
Show comp detail 11 sales within ~0.75 mi
| Address | Dist | Beds/Ba | Sqft | Sold | Price | $/sf | Match |
|---|---|---|---|---|---|---|---|
| 2923 Akron St | 0.04mi | 2/1.0 | 990 (+7%) | 11mo | $155,000 | $157 | 74 |
| 1000 Poplar St | 0.14mi | 3/2.0 (+1) | 1,024 (+10%) | 9mo | $131,770 | $129 | 64 |
| 1324 E Forrest Ave | 0.68mi | 2/1.0 | 864 (-7%) | 1mo | $235,000 | $272 | 52 |
| 1098 Jefferson Ave | 0.69mi | 2/1.0 | 940 (+1%) | 15mo | $280,000 | $298 | 49 |
| 2841 Palm Dr | 0.31mi | 3/1.0 (+1) | 979 (+6%) | 23mo | $118,600 | $121 | 48 |
| 3018 Wanda Cir SW | 0.71mi | 3/2.0 (+1) | 1,000 (+8%) | 3mo | $229,000 | $229 | 47 |
| 2931 Diana Dr SW | 0.70mi | 3/1.5 (+1) | 1,000 (+8%) | 1mo | $220,000 | $220 | 47 |
| 1134 Jefferson Ave | 0.69mi | 2/2.0 | 1,021 (+10%) | 11mo | $285,000 | $279 | 42 |
| 2928 Diana Dr SW | 0.73mi | 3/1.0 (+1) | 1,000 (+8%) | 5mo | $87,000 | $87 | 40 |
| 2910 Diana Dr SW | 0.73mi | 3/1.0 (+1) | 1,000 (+8%) | 11mo | $190,000 | $190 | 35 |
| 3012 Wanda Cir SW | 0.72mi | 3/2.0 (+1) | 1,000 (+8%) | 21mo | $265,000 | $265 | 31 |
Match score weights: distance 35% · size 25% · config 20% · recency 20%. Top-matched comps best support the ARV.
Projected returns pro-forma
-3.0% appreciation · 1.35% rent growth · sell at horizon
- IRR
- -11.0%
- Equity multiple
- 0.61×
- Total profit
- $-16,487
- Equity at exit
- $22,365
- IRR
- -4.2%
- Equity multiple
- 0.74×
- Total profit
- $-10,866
- Equity at exit
- $12,969
Cash invested: $42,000 (down + closing). Projections, not guarantees.
Landlord ↔ Tenant lean methodology
- Overall (STATE)
- 90 Strongly Landlord-Friendly
- State Georgia
- 90 Strongly Landlord-Friendly · R+3
- County
- — inherits STATE
- City
- — inherits STATE
ZIP-level market 30344
- Home prices YoY
- -31.0%
- Rents YoY
- 1.4%
- Active inventory
- 283
- Price-to-rent
- 8.2×
Monthly cashflow live
- Estimated rent
- $1,516 high interval (Pro) →
- Mortgage (P&I)
- −$787
- Tax est. 1.5%
- −$188 /mo · $2,250/yr
- Insurance
- −$62
- HOA
- −$0
- Vacancy / Maint / Mgmt
- −$318
- Net cashflow
- $161
Break-even live
UW: 25.0% down · 7.5% · 30yr · 1.5% tax · 5.0% vac · 8.0% maint · 8.0% mgmt
Financing live
Cash to close
- Down payment
- $37,500
- Closing costs
- $4,500
- Reserves months
- —
- Total cash needed
- —
Loan-product check · same deal, 3 products live
Conventional
25% down · 7.5% · 30yr
- Down + closing
- —
- Monthly P&I
- —
- Monthly cashflow
- —
- DSCR
- —
- Eligible?
- —
Personal DTI + credit; lowest rate.
DSCR
20% down · 8.5% · 30yr
- Down + closing
- —
- Monthly P&I
- —
- Monthly cashflow
- —
- DSCR
- —
- Eligible?
- —
No personal income docs; deal must DSCR.
Hard money
10% down · 12.0% · 12mo
- Down + closing
- —
- Monthly P&I
- —
- Monthly cashflow
- —
- DSCR
- —
- Eligible?
- —
Short-term bridge; refi at stabilization.
Rent comps 40 comps
| Address | Beds | Baths | Sqft | Rent | $/sqft | DOM | Units | Dist |
|---|---|---|---|---|---|---|---|---|
| 1100 Washington Cir Atlanta, GA | 1.0–4.0 | 1.0–1.5 | 1000 | $1,333 | $1.33 | 3d | 1 | 0.25mi |
| 2952 Palm Dr Atlanta, GA | 3.0 | 2.0 | 1120 | $1,875 | $1.67 | 5d | 1 | 0.25mi |
| 2801 Palm Dr Atlanta, GA | 3.0 | 1.0 | 1064 | $1,550 | $1.46 | 13d | 1 | 0.34mi |
| 1244 Calhoun Ave Atlanta, GA | 3.0 | 1.5 | 1072 | $1,673 | $1.56 | 44d | 1 | 0.35mi |
| 2748 Blount St Atlanta, GA | 3.0 | 1.0 | 1068 | $1,850 | $1.73 | 44d | 1 | 0.36mi |
| 2744 Miles Cir Unit 2746 Atlanta, GA | 2.0 | 1.0 | 800 | $1,295 | $1.62 | 2d | 1 | 0.38mi |
| 2718 Miles Cir Unit 1 Atlanta, GA | 2.0 | 1.0 | 750 | $1,300 | $1.73 | 15d | 1 | 0.40mi |
| 1255 Pine Ave Unit 2 East Point, GA | 2.0 | 1.0 | 700 | $1,400 | $2.00 | 44d | 1 | 0.43mi |
| 3041 North St Unit B East Point, GA | 2.0 | 1.0 | 650 | $895 | $1.38 | 44d | 1 | 0.43mi |
| 1377 Pine Ave Atlanta, GA | 3.0 | 2.0 | 1100 | $1,675 | $1.52 | 22d | 1 | 0.63mi |
| 1408 Lyle Ave Unit A Atlanta, GA | 2.0 | 1.0 | 842 | $1,350 | $1.60 | 24d | 1 | 0.64mi |
| 2611 Springdale Rd SW Atlanta, GA | 1.0 | 1.0 | 546 | $1,071 | $1.96 | 24d | 1 | 0.74mi |
| 2541 Jewel St Unit B East Point, GA | 1.0 | 1.0 | 600 | $1,000 | $1.67 | 44d | 1 | 0.74mi |
| 3162 Oakdale Rd Atlanta, GA | 3.0 | 1.0 | 1040 | $3,200 | $3.08 | 44d | 1 | 0.78mi |
| 1354 Winburn Dr Atlanta, GA | 3.0 | 1.0 | 1000 | $1,850 | $1.85 | 5d | 1 | 0.80mi |
| 1354 Winburn Dr Atlanta, GA | 2.0 | 1.0 | 1089 | $1,750 | $1.61 | 24d | 1 | 0.80mi |
| 1332 Eubanks Ave Atlanta, GA | 2.0 | 1.0 | 714 | $1,025 | $1.44 | 44d | 1 | 0.83mi |
| 1329 Walker Ave Unit Walker B Atlanta, GA | 1.0 | 1.0 | 650 | $1,600 | $2.46 | 3d | 1 | 0.92mi |
| 1329 Walker Ave Unit Walker A Atlanta, GA | 1.0 | 1.0 | 650 | $2,000 | $3.08 | 3d | 1 | 0.92mi |
| 735 Oak Dr Hapeville, GA | 2.0 | 1.0 | 1053 | $1,550 | $1.47 | 22d | 1 | 0.93mi |
| 852 Custer St Hapeville, GA | 1.0 | 1.0 | 610 | $1,600 | $2.62 | 18d | 1 | 1.01mi |
| 3028 Grand Ave SW Atlanta, GA | 1.0 | 1.0 | 1048 | $900 | $0.86 | 5d | 1 | 1.04mi |
| 3018 Grand Ave SW Atlanta, GA | 2.0 | 1.0 | 825 | $1,400 | $1.70 | 4d | 1 | 1.05mi |
| 3116 Jackson St Atlanta, GA | 2.0 | 2.0 | 1016 | $1,900 | $1.87 | 44d | 1 | 1.06mi |
| 532 Cleveland Ave SW Atlanta, GA | 2.0 | 1.0 | 836 | $950 | $1.14 | 15d | 1 | 1.10mi |
| 532 Cleveland Ave SW Atlanta, GA | 2.0 | 1.0 | 836 | $925 | $1.11 | 22d | 1 | 1.10mi |
| 535 Lake Dr Atlanta, GA | 3.0 | 2.0 | 1080 | $2,275 | $2.11 | 44d | 1 | 1.15mi |
| 2627 N Church St East Point, GA | 2.0–3.0 | 1.0–2.0 | 1020 | $1,289 | $1.26 | 22d | 2 | 1.15mi |
| 2875 3rd Ave SW Unit A Atlanta, GA | 2.0 | 1.0 | 900 | $1,245 | $1.38 | 2d | 1 | 1.16mi |
| 278 Moreland Way Atlanta, GA | 3.0 | 2.0 | 1000 | $1,945 | $1.95 | 24d | 1 | 1.22mi |
| 3100 E Point St Atlanta, GA | 2.0 | 1.0 | 850 | $1,224 | $1.44 | 5d | 3 | 1.22mi |
| 518 North Ave Atlanta, GA | 2.0 | 1.5 | 1096 | $2,150 | $1.96 | 10d | 1 | 1.24mi |
| 2874 Cheney St Atlanta, GA | 2.0 | 1.0 | 900 | $1,300 | $1.44 | 44d | 1 | 1.28mi |
| 2955 1st Ave SW Unit 1 Atlanta, GA | 1.0 | 1.0 | 600 | $1,050 | $1.75 | 24d | 1 | 1.30mi |
| 745 Yale Pl SW Atlanta, GA | 3.0 | 1.0 | 1048 | $2,200 | $2.10 | 24d | 1 | 1.31mi |
| 2997 Park St Unit 2 Atlanta, GA | 2.0 | 1.5 | 860 | $1,549 | $1.80 | 5d | 1 | 1.33mi |
| 2997 Park St Unit 3 Atlanta, GA | 2.0 | 1.5 | 860 | $1,499 | $1.74 | 44d | 1 | 1.33mi |
| 488 Pomona Cir SW Atlanta, GA | 3.0 | 1.0 | 1000 | $1,800 | $1.80 | 24d | 1 | 1.34mi |
| 231 Maple St Atlanta, GA | 3.0 | 2.0 | 1068 | $1,645 | $1.54 | 44d | 1 | 1.34mi |
| 3193 E Point St Unit 4 Atlanta, GA | 2.0 | 1.0 | 800 | $1,350 | $1.69 | 21d | 1 | 1.36mi |
Listing history 10 events
-
2026-06-13days on market $150,000 Active 42 DOM
-
2026-06-09days on market $150,000 Active 38 DOM
-
2026-06-08days on market $150,000 Active 37 DOM
-
2026-06-07statusdays on market $150,000 Active 36 DOM
-
2026-06-04pricestatusdays on market $150,000 Price Change 33 DOM
-
2026-05-31days on market $200,000 Active 32 DOM
-
2026-05-01price $200,000 867-char remark
-
2026-04-25$225,000 New 867-char remark
-
1990-07-10soldstatus $41,000
-
1978-12-01soldstatus $22,228
ⓘ Source: listings_history table (triggers on properties + properties_extension) + one-shot
backfill from property_details.listing_events for pre-trigger history.
Climate risk First Street
- Flood 1/10 Low FEMA zone X (unshaded) · 0% chance over 30 yrs
- Wildfire 1/10 Low
- Heat 5/10 Major 7 d/yr ≥104°F today · 17 d/yr by 30 yrs out
- Wind 6/10 Major 27% chance of damaging wind over 30 yrs
- Air quality 4/10 Moderate 4 unhealthy d/yr today · 6 by 30 yrs out
Nearby sold comps map
Loading sold comps map…
Walkable amenities ~0.75 mi
Loading nearby amenities…
Taxation est. · year 1
- Rental income
- $18,196
- − Mortgage interest
- −$8,402
- − Property taxes
- −$2,250
- − Insurance
- −$750
- − Repairs & maintenance
- −$1,456
- − Management
- −$1,456
- − Depreciation
- −$4,364
- Taxable loss
- −$481
- Est. tax savings @ 24.0%
- +$115
- After-tax cash flow
- $2,051/yr
For passive investors: Depreciation is non-cash, so a rental often shows a tax loss while cash-flowing — sheltering income. Rental losses are passive: they offset passive income freely, and up to $25,000/yr can offset ordinary (W-2) income if you actively participate and your MAGI is under $100k (phasing out to $0 by $150k); unused losses carry forward. On sale, claimed depreciation is recaptured at up to 25%, and gains may owe capital-gains tax (a 1031 exchange can defer both). Figures are a year-1 estimate at your 24.0% rate — not tax advice; consult a CPA.
Schools (NCES district)
- District
- Fulton County
- NCES district ID
- 1302280
- Math proficiency
- 49% ▼ -2.00%
- Reading proficiency
- 53% ▬ 0.00%
- Median HH income
- $68,035
- Composite
- 45.33/100
- National rank
- #2640
- State rank
- #12 of 174 in GA
Livability — East Point
- Score
- 72/100
- State rank
- #72
- US rank
- #6314
Category grades
Schools grade is shown separately in the Schools card above.
Census & demographics
- Census place
- East Point, GA
- County
- Fulton County · 1,094,430 people
- City population
- 35,456
- Metro
- Atlanta-Sandy Springs-Alpharetta, GA
- Population (ZIP)
- 35,456
- Household income
- $68,380
- Rent vs Own
- Severe rent burden
- 2226.0
Population outlook (Fulton County) Hauer SSP2
- Today (2025)
- 1,203,707 people
- By 2030
- 1,299,706 · +8.0%
- By 2040
- 1,488,256 · +23.6%
- By 2050
- 1,664,580 · +38.3%
- By 2075
- 2,036,072 · +69.2%
- By 2100
- 2,222,402 · +84.6%
Race, ethnicity, and origin ACS 2023
- Neighborhood character
- Predominantly Black (74%)
- Race & ethnicity
- Black 74% White 11% Hispanic / Latino 11% Two or more races 6%
- Hispanic origin (detail)
- Mexican 7% Puerto Rican 1%
- Common ancestry
- Italian 1% Swiss 1% Russian 1%
- Foreign-born
- 6% · Canada, Jamaica
- Languages at home
- 87% English-only · Spanish 9% Other Indo-European 1% German/W. Germanic 1%
Political lean MEDSL · Fulton
- 2024 margin
- Solid D (+44.9) · D 71.9% · R 27.0% · Other 1.1%
- 2008→2024 swing
- +9.8pp toward D · 2008: 35.0pp · 2024: 44.9pp
- All cycles
- 2024: D+44.9 2020: D+46.4 2016: D+42.1 2012: D+29.6 2008: D+35.0
Not yet ingested
- Civics
- —
Market trends
- HPI YoY
- ▼ -113.15%
- Current HPI
- 251.7916
- Rent YoY
- ▲ 1.35%
- Metro
- Atlanta-Sandy Springs-Alpharetta, GA
- State GDP YoY
- ▲ 2.66%
- F500 in state
- 28
Industry mix (Fortune 500 HQ in GA)
| Industry | F500 HQs | Revenue |
|---|---|---|
| Paper / Packaging | 2 | $29B |
|
||
| Retail | 1 | $160B |
|
||
| Transportation / Logistics | 1 | $91B |
|
||
| Airlines | 1 | $62B |
|
||
| Consumer Goods | 1 | $47B |
|
||
| Utilities | 1 | $25B |
|
||
Price history
+574.8% since first listed8 events — show timeline
- 2026-06-14 Listing Removed — GAMLS
- 2026-06-03 Relisted — GAMLS
- 2026-06-03 Price Changed $150,000 GAMLS
- 2026-05-31 Listing Removed — GAMLS
- 2026-05-01 Price Changed $200,000 GAMLS
- 2026-04-25 Listed $225,000 GAMLS
- 1990-07-10 Sold (Public Records) $41,000 Public Records
- 1978-12-01 Sold (Public Records) $22,228 Public Records
Property tax history
-6.2%/yrLatest (2021): $110 · +0.0% YoY. Source: county tax records.
Cash-flow waterfall
monthlySold comps — $/sqft
last 12 mo · ≤1 miLoading sold comps…