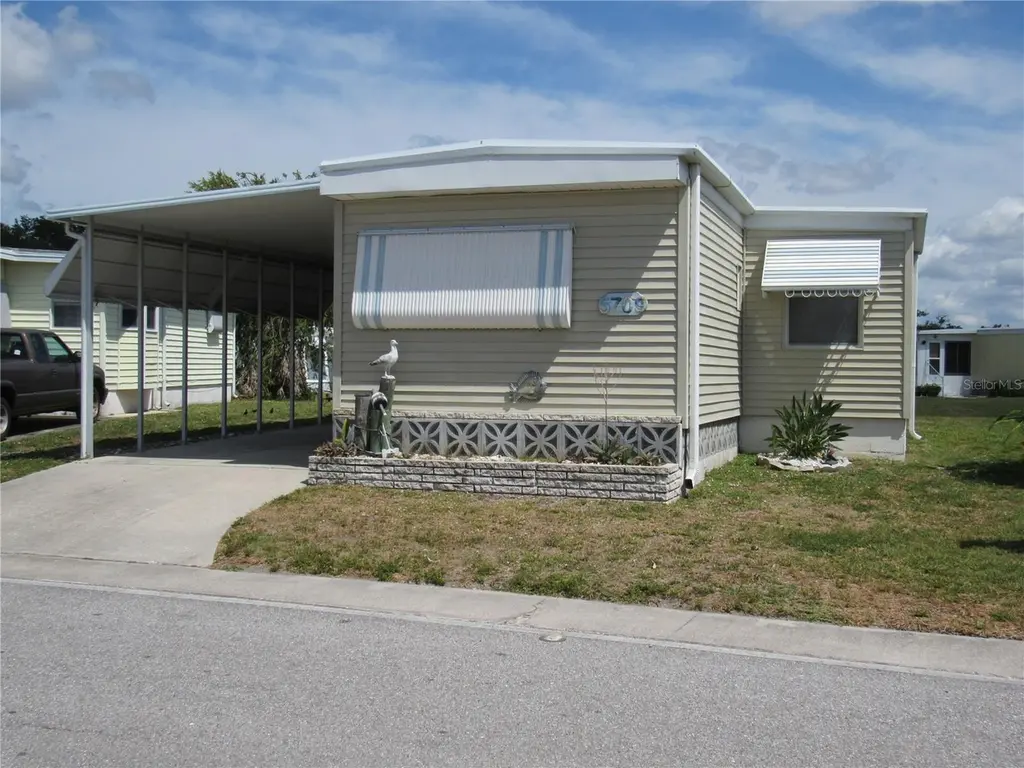
5709 Holiday Park Blvd · North Port, FL
Flood risk 8/10 · Major
- FEMA flood zone
- X (shaded)
- Chance of flooding over 30 yrs
- 0.97%
- Est. flood insurance / yr
- $507 – $1,088
Fire risk 1/10 · Minimal
- Est. fire insurance / yr
- $947 – $1,759
Heat risk 10/10 · Severe
- Hot days now (above 107°F)
- 7 days/yr
- Hot days in 30 yrs
- 25 days/yr
Wind risk 10/10 · Severe
- Chance of severe wind over 30 yrs
- 99.0%
Air-quality risk 3/10 · Minor
- Unhealthy air days now
- 2 days/yr
- Unhealthy air days in 30 yrs
- 3 days/yr
Risk factors via First Street. Map © Google.
Why this score? — see what drove the B grade
The composite is a weighted blend of 9 inputs, each scored 0–100. Each bar is that input's sub-score; the figure is the points it added to the 100-point composite (weight × sub-score).
- Cash flow +29.4/30.0
- 1% rule +10.0/10.0
- DSCR +10.0/10.0
- ARV discount +7.5/15.0
- Schools +5.4/10.0
- Livability +3.8/5.0
- Rent growth +2.6/5.0
- Condition / age +2.5/5.0
- Appreciation +0.0/10.0
$79,900
🖨 Deal sheet 📄 Offer letter ✓ Due diligence
Listing remarks MLS
HOLIDAY PARK- REDUCED! Bright, clean and spacious! 2 BDRM split plan, 2 BATHS, Expanded living room, all appliances. Unique Florida room and workshop/laundry area, new water heater, newer windows. Vinyl siding & roofover. Move-in condition!
Key facts
- Heated pools
- Fitness center
- Florida room
Tags
Property features AI
Finance
- Other: Turnkey furnished
- Financial info: Lease restrictions apply
- HOA & community: HOA required (Holiday Park/Vicky Lawrence); Monthly HOA fee $195 (annual $2,340); Association amenities: clubhouse, gated community, park, pool, shuffleboard court; Association fee covers pool, grounds maintenance, management, private road, recreational facilities, security; Buyer approval required; Deed restrictions; Sidewalks; Senior community; Pets allowed (cats and dogs; size/number limits apply, max pet weight 30 lbs)
Exterior
- Parking: Carport with 1 space
- Security: Located in a gated community
- Utilities: Public water; Public sewer; Electricity connected; Cable connected; Underground utilities
- Home design: Residential mobile home (single wide); One level; Faces northwest; Entry on one level
- Construction: Vinyl siding; Membrane roof; Crawlspace foundation; Built as single wide mobile home
- Exterior features: Awning(s); Exterior lighting; Rain gutters; Sidewalk; In-ground heated gunite pool
Interior
- Kitchen: Range hood; Refrigerator
- Bedrooms: 2 bedrooms
- Flooring: Carpet; Laminate; Linoleum
- Bathrooms: 2 full bathrooms
- Heating & cooling: Central heating (electric); Central air conditioning
- Interior features: Ceiling fans; Open floor plan; Window treatments
- Laundry & utility: Washer hookup; Dryer hookup; Laundry room
Neighborhood map
What this means for you Summary
Snapshot
- This is a 2-bed/2.0-bath manufactured listed at $80k.
Deal economics
- At list price, monthly cash flow is $216 ($3k/yr) — positive.
- The deal already cash-flows at list — no discount required.
- Meets the 1% rule at list price ($2k rent vs $80k).
- Recommended offer: $78k (3.0% below list) — sets the bar for market timing.
- Cap rate 10.5% vs local median 3.6% in North Port — top-decile yield for the area; either an underpriced asset or a hidden risk that comps aren't pricing in. Stress-test before assuming the spread holds.
Location & tenants
- Location reads 75/100 on livability (#252 in FL, #3,975 nationally) — a middle-class / working-renter tenant base. Strengths: crime A+, housing A+, health & safety A+; Watch: amenities F, commute F.
- Sarasota (urban): math 63% / reading 63% proficiency, ranked #7 of 73 in FL (top 10%) — acceptable for families but not a draw, mixed tenant base, ~2y average lease.
- Market conditions: Rents flat; 852 active listings in the ZIP; 7,466 units permitted in Sarasota County in 2024 (2,138 in 5+ unit buildings).
Forward outlook
- Local home prices are declining (-3.0%/yr); year-one equity from $552 of loan paydown is wiped out by about $2k of value loss. Plan a longer hold.
- Sarasota County population projected at +20% by 2050 — long-run rental-demand tailwind backs the buy-and-hold thesis.
Negotiation context
- It's been on market 48 days — a 3% lower offer ($78k) is reasonable based on typical stale-listing flexibility.
- 2 sale attempts since 20y ago with the ask held roughly flat each time — persistent listings suggest the price (not the market) is what's stuck; bring a comps-based counter.
- Current owner paid $69k; 16% above their basis — modest negotiation headroom, anchor on the comps not their cost.
Risks & watch-outs
- Watch-outs: property tax is 4.6% of price; flood insurance adds $66/mo.
- Climate carrying-cost: severe flood risk; severe wind risk, 99% chance of damaging wind over 30y; extreme-heat days projected 7→25/yr by 2055 (HVAC capex compounding) — expect insurance premiums to compound above CPI over the hold.
Questions for the listing agent
- It's been on market 48 days. Have you received any prior offers? Is the seller open to a 3% concession, seller financing, or rate buy-down credit?
- Built in 1971 — when were the roof, HVAC, electrical panel, plumbing, and water heater last replaced?
- Property tax is high relative to price — has the assessment been appealed recently, and will the sale trigger a re-assessment?
- What's the actual annual flood-insurance premium (NFIP or private), and is the property in a SFHA with mandatory coverage?
- What does the HOA fee cover, when was the last increase, and are there any pending special assessments or reserve-fund shortfalls?
- Is there a deadline driving the sale (1031 exchange, divorce, estate, relocation)? That informs how much negotiation room exists.
- Schools are B-rated — typically a magnet for longer-tenancy family renters. What's the average tenant stay here, and is there a school-zone premium baked into asking?
- What's the average days-on-market for RENTAL listings here right now (not sales)? A rising rental-DOM trend means longer vacancies and softer asking-rent achievability than the comps imply.
- What's the recent tenant-quality profile in this submarket — average credit score on applications, eviction rate, late-payment / NSF rate, and stable-employment percentage? A property-management company in the area should have these aggregated.
- How much new for-sale + rental construction is in the pipeline within 1–3 miles? Heavy new supply typically softens prices + rents 12–24 months out; constrained supply supports both.
Investment metrics
- 1% rule
- 1.96% ✓
- Cap rate
- 10.54%
- Cash-on-cash
- 15.16%
- DSCR
- 1.67
- GRM
- 4.3
CMA / ARV
No comps found within radius.
Projected returns pro-forma
-3.0% appreciation · 0.26% rent growth · sell at horizon
- IRR
- -3.8%
- Equity multiple
- 0.86×
- Total profit
- $-3,064
- Equity at exit
- $11,913
- IRR
- 0.0%
- Equity multiple
- 1.00×
- Total profit
- $27
- Equity at exit
- $6,908
Cash invested: $22,372 (down + closing). Projections, not guarantees.
Landlord ↔ Tenant lean methodology
- Overall (STATE)
- 87 Strongly Landlord-Friendly
- State Florida
- 87 Strongly Landlord-Friendly · R+3
- County
- — inherits STATE
- City
- — inherits STATE
ZIP-level market 34287
- Home prices YoY
- -20.1%
- Rents YoY
- 0.3%
- Active inventory
- 852
- Price-to-rent
- 4.3×
Monthly cashflow live
- Estimated rent
- $1,563 medium interval (Pro) →
- Mortgage (P&I)
- −$419
- Tax from tax record
- −$305 /mo · $3,659/yr
- Insurance
- −$33
- Flood insurance flood zone
- −$66 /mo · $798/yr
- HOA
- −$195
- Vacancy / Maint / Mgmt
- −$328
- Net cashflow
- $216
Break-even live
UW: 25.0% down · 7.5% · 30yr · 1.5% tax · 5.0% vac · 8.0% maint · 8.0% mgmt
Financing live
Cash to close
- Down payment
- $19,975
- Closing costs
- $2,397
- Reserves months
- —
- Total cash needed
- —
Loan-product check · same deal, 3 products live
Conventional
25% down · 7.5% · 30yr
- Down + closing
- —
- Monthly P&I
- —
- Monthly cashflow
- —
- DSCR
- —
- Eligible?
- —
Personal DTI + credit; lowest rate.
DSCR
20% down · 8.5% · 30yr
- Down + closing
- —
- Monthly P&I
- —
- Monthly cashflow
- —
- DSCR
- —
- Eligible?
- —
No personal income docs; deal must DSCR.
Hard money
10% down · 12.0% · 12mo
- Down + closing
- —
- Monthly P&I
- —
- Monthly cashflow
- —
- DSCR
- —
- Eligible?
- —
Short-term bridge; refi at stabilization.
HOA detail
- Monthly dues
- $195 · $2,340/yr
- Likely covers
- water
Listing history 21 events
-
2026-06-18days on market $79,900 Active 48 DOM
-
2026-06-17days on market $79,900 Active 47 DOM
-
2026-06-16days on market $79,900 Active 46 DOM
-
2026-06-15days on market $79,900 Active 45 DOM
-
2026-06-13days on market $79,900 Active 43 DOM
-
2026-06-13days on market $79,900 Active 42 DOM
-
2026-06-10days on market $79,900 Active 40 DOM
-
2026-06-09days on market $79,900 Active 39 DOM
-
2026-06-08days on market $79,900 Active 38 DOM
-
2026-06-08days on market $79,900 Active 37 DOM
-
2026-06-05days on market $79,900 Active 34 DOM
-
2026-06-03days on market $79,900 Active 33 DOM
-
2026-06-02days on market $79,900 Active 32 DOM
-
2026-06-01days on market $79,900 Active 31 DOM
-
2026-05-31days on market $79,900 Active 30 DOM
-
2026-05-01$79,900 Active 809-char remark
-
2016-02-29soldstatus $69,000
-
2007-03-05soldstatus $75,000
-
2007-02-16soldstatus $75,000 246-char remark
Show marketing remark (246 chars)
HOLIDAY PARK- REDUCED! Bright, clean and spacious! 2 BDRM split plan, 2 BATHS, Expanded living room, all appliances. Unique Florida room and workshop/laundry area, new water heater, newer windows. Vinyl siding & roofover. Move-in condition!
-
2006-01-26$79,500 246-char remark
Show marketing remark (246 chars)
HOLIDAY PARK- REDUCED! Bright, clean and spacious! 2 BDRM split plan, 2 BATHS, Expanded living room, all appliances. Unique Florida room and workshop/laundry area, new water heater, newer windows. Vinyl siding & roofover. Move-in condition!
-
1990-04-06soldstatus $32,000
ⓘ Source: listings_history table (triggers on properties + properties_extension) + one-shot
backfill from property_details.listing_events for pre-trigger history.
Tax reassessment forecast FL · Resets to sale price
- Current annual tax
- $3,659 · $305/mo
- Projected year-2 tax
- $3,659 · $305/mo
- Expected delta
- $0/yr ($0/mo · 0.0%)
ⓘ Screening estimate from a state-policy table — verify with the county assessor before closing.
Climate risk First Street
- Flood 8/10 Severe FEMA zone X (shaded) · 97% chance over 30 yrs
- Wildfire 1/10 Low
- Heat 10/10 Extreme 7 d/yr ≥107°F today · 25 d/yr by 30 yrs out
- Wind 10/10 Extreme 99% chance of damaging wind over 30 yrs
- Air quality 3/10 Moderate 2 unhealthy d/yr today · 3 by 30 yrs out
Nearby sold comps map
Loading sold comps map…
Walkable amenities ~0.75 mi
Loading nearby amenities…
Taxation est. · year 1
- Rental income
- $18,757
- − Mortgage interest
- −$4,476
- − Property taxes
- −$3,659
- − Insurance
- −$1,197
- − Repairs & maintenance
- −$1,501
- − Management
- −$1,501
- − HOA
- −$2,340
- − Depreciation
- −$2,324
- Taxable income
- $1,760
- Est. tax owed @ 24.0%
- −$422
- After-tax cash flow
- $2,172/yr
For passive investors: Depreciation is non-cash, so a rental often shows a tax loss while cash-flowing — sheltering income. Rental losses are passive: they offset passive income freely, and up to $25,000/yr can offset ordinary (W-2) income if you actively participate and your MAGI is under $100k (phasing out to $0 by $150k); unused losses carry forward. On sale, claimed depreciation is recaptured at up to 25%, and gains may owe capital-gains tax (a 1031 exchange can defer both). Figures are a year-1 estimate at your 24.0% rate — not tax advice; consult a CPA.
Schools (NCES district)
- District
- Sarasota
- NCES district ID
- 1201680
- Math proficiency
- 63% ▼ -8.00%
- Reading proficiency
- 63% ▼ -3.00%
- Median HH income
- $51,167
- Composite
- 53.68/100
- National rank
- #1428
- State rank
- #7 of 73 in FL
Livability — North Port
- Score
- 75/100
- State rank
- #252
- US rank
- #3975
Category grades
Schools grade is shown separately in the Schools card above.
Census & demographics
- Census place
- North Port, FL
- County
- Sarasota County · 448,376 people
- City population
- 75,324
- Metro
- North Port-Sarasota-Bradenton, FL
- Population (ZIP)
- 25,929
- Household income
- $63,464
- Rent vs Own
- Severe rent burden
- 522.0
Population outlook (Sarasota County) Hauer SSP2
- Today (2025)
- 452,380 people
- By 2030
- 474,175 · +4.8%
- By 2040
- 511,577 · +13.1%
- By 2050
- 541,467 · +19.7%
- By 2075
- 604,947 · +33.7%
- By 2100
- 621,965 · +37.5%
Race, ethnicity, and origin ACS 2023
- Neighborhood character
- Predominantly White (77%)
- Race & ethnicity
- White 77% Hispanic / Latino 14% Two or more races 7% Asian 4% Black 3%
- Hispanic origin (detail)
- Mexican 2% Puerto Rican 3% Cuban 3% Dominican 1%
- Common ancestry
- Romanian 4% Scotch-Irish 3% Lithuanian 3%
- Foreign-born
- 16% · Canada, Philippines
- Languages at home
- 81% English-only · Spanish 8% Russian/Polish/Slavic 5% French/Haitian/Cajun 2%
Political lean MEDSL · Sarasota
- 2024 margin
- R (+18.2) · D 40.5% · R 58.7%
- 2008→2024 swing
- -18.1pp toward R · 2008: -0.1pp · 2024: -18.2pp
- All cycles
- 2024: R+18.2 2020: R+10.4 2016: R+11.6 2012: R+7.4 2008: R+0.1
Not yet ingested
- Civics
- —
Market trends
- HPI YoY
- ▼ -70.89%
- Current HPI
- 280.8484
- Rent YoY
- ▲ 0.26%
- Metro
- North Port-Sarasota-Bradenton, FL
- State GDP YoY
- ▲ 3.28%
- F500 in state
- 36
Industry mix (Fortune 500 HQ in FL)
| Industry | F500 HQs | Revenue |
|---|---|---|
| Industrial Technology | 2 | $29B |
|
||
| Insurance | 2 | $17B |
|
||
| Retail | 1 | $60B |
|
||
| Technology Distribution | 1 | $58B |
|
||
| Homebuilding | 1 | $35B |
|
||
| Technology Manufacturing | 1 | $35B |
|
||
Price history
+149.7% since first listed6 events — show timeline
- 2026-05-01 Listed $79,900 Stellar MLS as Distributed by MLS Grid
- 2016-02-29 Sold (Public Records) $69,000 Public Records
- 2007-03-05 Sold (Public Records) $75,000 Public Records
- 2007-02-16 Sold (MLS) $75,000 Stellar MLS as Distributed by MLS Grid
- 2006-01-26 Listed $79,500 Stellar MLS as Distributed by MLS Grid
- 1990-04-06 Sold (Public Records) $32,000 Public Records
Property tax history
+4.8%/yrLatest (2025): $3,659 · -4.5% YoY. Source: county tax records.
Cash-flow waterfall
monthlySold comps — $/sqft
last 12 mo · ≤1 miLoading sold comps…