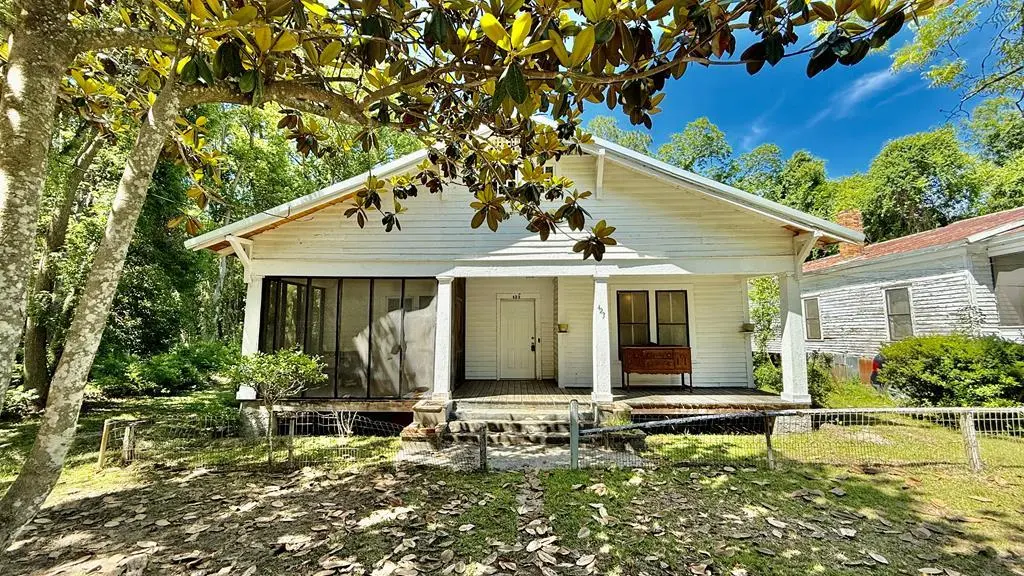
423 S College St · Thomasville, GA
Flood risk 3/10 · Minor
- FEMA flood zone
- X (unshaded)
- Chance of flooding over 30 yrs
- 0.2%
- Est. flood insurance / yr
- $507 – $1,088
Fire risk 2/10 · Minimal
- Est. fire insurance / yr
- $963 – $1,789
Heat risk 8/10 · Major
- Hot days now (above 108°F)
- 7 days/yr
- Hot days in 30 yrs
- 19 days/yr
Wind risk 8/10 · Major
- Chance of severe wind over 30 yrs
- 99.0%
Air-quality risk 5/10 · Moderate
- Unhealthy air days now
- 8 days/yr
- Unhealthy air days in 30 yrs
- 8 days/yr
Risk factors via First Street. Map © Google.
Why this score? — see what drove the B- grade
The composite is a weighted blend of 9 inputs, each scored 0–100. Each bar is that input's sub-score; the figure is the points it added to the 100-point composite (weight × sub-score).
- Cash flow +30.0/30.0
- 1% rule +10.0/10.0
- DSCR +10.0/10.0
- ARV discount +7.5/15.0
- Livability +3.6/5.0
- Schools +2.7/10.0
- Rent growth +2.5/5.0
- Condition / age +2.5/5.0
- Appreciation +0.0/10.0
$70,000
🖨 Deal sheet 📄 Offer letter ✓ Due diligence
Listing remarks
Potential galore! The current owner has already tackled the major updates, including a new roof, power restored and active, and interiors taken down to the subfloor for a fresh start. New lighting and ceiling fans have been added throughout, giving the home a bright, updated feel. Inside, you'll find a spacious living room, a dining room with fireplace charm, 2 true bedrooms with closets, a remodeled bathroom with updated plumbing fixtures, and a sun-filled flex room that would make a perfect 3rd bedroom, office, or creative space. With just a little more vision and finishing touches, this property could become an incredible first-time home or a strong addition to an investor's rental portf
Key facts
- Sun-filled flex room
- Remodeled bathroom
- New roof
Tags
Property features AI
Exterior
- Home design: Single-family residence; One story
- Construction: Wood siding construction
- Exterior features: R-2 zoning; Located via GPS directions; No recorded subdivision
Interior
- Bedrooms: Bedrooms included (number not specified)
- Bathrooms: 1 full bathroom
- Interior features: Fireplace in a bedroom
Neighborhood map
What this means for you Summary
Snapshot
- This is a 3-bed/1.0-bath single-family listed at $70k.
Deal economics
- At list price, monthly cash flow is $1k ($12k/yr) — positive.
- The deal already cash-flows at list — no discount required.
- Meets the 1% rule at list price ($2k rent vs $70k).
- Recommended offer: $69k (1.5% below list) — sets the bar for market timing.
- Cap rate 24.0% vs local median 3.7% in Thomasville — top-decile yield for the area; either an underpriced asset or a hidden risk that comps aren't pricing in. Stress-test before assuming the spread holds.
Location & tenants
- Location reads 71/100 on livability (#77 in GA) — a middle-class / working-renter tenant base. Strengths: amenities A+, cost of living A+, health & safety A+; Watch: schools D, crime F, commute F.
- Thomasville City (town): math 29% / reading 37% proficiency, ranked #87 of 174 in GA (top 50%) — families likely to look elsewhere, expect single-tenant / working-renter base with shorter leases; 60% free/reduced lunch — lower-income household profile, screen leases tightly.
- Market conditions: 203 active listings in the ZIP; 6 comparable units currently listed for rent nearby; rentals lingering (median 44d on market — plan ~5-8 weeks vacancy on turnover, expect pricing pressure); 83% of comp listings sitting > 30 days — soft ceiling on asking rent; 213 units permitted in Thomas County in 2024 (72 in 5+ unit buildings).
- This rent runs 43% of the median local income ($50k/yr) — at the standard rent-burdened threshold; future hikes will face affordability resistance.
Forward outlook
- Local home prices are declining (-3.0%/yr); year-one equity from $484 of loan paydown is wiped out by about $2k of value loss. Plan a longer hold.
- Thomas County population projected to shrink 7% by 2050 — rents likely to lag national; underwrite the cash flow, not the appreciation.
- At projected returns (-3.0% appreciation + 3.0% rent growth), your $20k cash investment doubles in ~2 years — after that, you're playing with house money.
Negotiation context
- It's been on market 27 days — a 2% lower offer ($69k) is reasonable based on typical stale-listing flexibility.
- 2 sale attempts; this cycle's ask has dropped $5k (7%) from the opening price — seller is motivated, your offer sets the floor, not the list.
Risks & watch-outs
- Watch-outs: built in 1904 — expect roof / HVAC / electrical / plumbing capex.
- Climate carrying-cost: severe wind risk, 99% chance of damaging wind over 30y; extreme-heat days projected 7→19/yr by 2055 (HVAC capex compounding) — expect insurance premiums to compound above CPI over the hold.
Questions for the listing agent
- Built in 1904 — when were the roof, HVAC, electrical panel, plumbing, and water heater last replaced?
- Is there a deadline driving the sale (1031 exchange, divorce, estate, relocation)? That informs how much negotiation room exists.
- Schools are D-rated, which usually means shorter tenancies and higher turnover. Who's the typical renter profile here, and what's been the actual vacancy rate?
- Crime grade is F in this area — have there been break-ins, vandalism, or insurance claims at this property in the last 3 years? What carrier currently insures it and at what premium?
- What's the average days-on-market for RENTAL listings here right now (not sales)? A rising rental-DOM trend means longer vacancies and softer asking-rent achievability than the comps imply.
- What's the recent tenant-quality profile in this submarket — average credit score on applications, eviction rate, late-payment / NSF rate, and stable-employment percentage? A property-management company in the area should have these aggregated.
- How much new for-sale + rental construction is in the pipeline within 1–3 miles? Heavy new supply typically softens prices + rents 12–24 months out; constrained supply supports both.
Investment metrics
- 1% rule
- 2.61% ✓
- Cap rate
- 23.99%
- Cash-on-cash
- 63.20%
- DSCR
- 3.81
- GRM
- 3.2
CMA / ARV
- ARV (on-the-fly)
- $153,996
- Comps found
- 12
Show comp detail 12 sales within ~0.75 mi
| Address | Dist | Beds/Ba | Sqft | Sold | Price | $/sf | Match |
|---|---|---|---|---|---|---|---|
| 111 Magnolia St | 0.21mi | 3/2.0 | 1,252 (0%) | 6mo | $279,900 | $224 | 82 |
| 112 Fern St | 0.27mi | 3/2.0 | 1,248 (-0%) | 13mo | $170,000 | $136 | 72 |
| 502 Magnolia St | 0.26mi | 3/1.0 | 1,166 (-7%) | 6mo | $80,000 | $69 | 72 |
| 308 Brighton St | 0.18mi | 3/2.0 | 1,319 (+5%) | 12mo | $275,000 | $208 | 69 |
| 301 Bartow St | 0.19mi | 3/2.0 | 1,152 (-8%) | 10mo | $190,000 | $165 | 66 |
| 426 South St | 0.16mi | 2/2.0 (-1) | 1,107 (-12%) | 2mo | $237,900 | $215 | 63 |
| 314 Bartow St | 0.15mi | 2/1.0 (-1) | 1,406 (+12%) | 6mo | $53,000 | $38 | 63 |
| 316 Fern St | 0.15mi | 3/1.0 | 1,410 (+13%) | 12mo | $8,900 | $6 | 62 |
| 216 E Hill St | 0.56mi | 2/1.0 (-1) | 1,136 (-9%) | 5mo | $129,000 | $114 | 50 |
| 617 Blackshear St | 0.67mi | 3/2.0 | 1,382 (+10%) | 7mo | $169,900 | $123 | 42 |
| 138 Augusta Ave | 0.72mi | 3/1.0 | 1,073 (-14%) | 8mo | $118,000 | $110 | 36 |
| 218 Teddy St | 0.52mi | 2/2.0 (-1) | 1,068 (-15%) | 11mo | $45,500 | $43 | 33 |
Match score weights: distance 35% · size 25% · config 20% · recency 20%. Top-matched comps best support the ARV.
Projected returns pro-forma
-3.0% appreciation · 3.0% rent growth · sell at horizon
- IRR
- 62.2%
- Equity multiple
- 3.77×
- Total profit
- $54,381
- Equity at exit
- $10,437
- IRR
- 66.7%
- Equity multiple
- 7.73×
- Total profit
- $131,932
- Equity at exit
- $6,052
Cash invested: $19,600 (down + closing). Projections, not guarantees.
Landlord ↔ Tenant lean methodology
- Overall (STATE)
- 90 Strongly Landlord-Friendly
- State Georgia
- 90 Strongly Landlord-Friendly · R+3
- County
- — inherits STATE
- City
- — inherits STATE
ZIP-level market 31792
- Home prices YoY
- -29.0%
- Active inventory
- 203
- Price-to-rent
- 3.2×
Monthly cashflow live
- Estimated rent
- $1,824 high interval (Pro) →
- Mortgage (P&I)
- −$367
- Tax from tax record
- −$13 /mo · $152/yr
- Insurance
- −$29
- HOA
- −$0
- Vacancy / Maint / Mgmt
- −$383
- Net cashflow
- $1,032
Break-even live
UW: 25.0% down · 7.5% · 30yr · 1.5% tax · 5.0% vac · 8.0% maint · 8.0% mgmt
Financing live
Cash to close
- Down payment
- $17,500
- Closing costs
- $2,100
- Reserves months
- —
- Total cash needed
- —
Loan-product check · same deal, 3 products live
Conventional
25% down · 7.5% · 30yr
- Down + closing
- —
- Monthly P&I
- —
- Monthly cashflow
- —
- DSCR
- —
- Eligible?
- —
Personal DTI + credit; lowest rate.
DSCR
20% down · 8.5% · 30yr
- Down + closing
- —
- Monthly P&I
- —
- Monthly cashflow
- —
- DSCR
- —
- Eligible?
- —
No personal income docs; deal must DSCR.
Hard money
10% down · 12.0% · 12mo
- Down + closing
- —
- Monthly P&I
- —
- Monthly cashflow
- —
- DSCR
- —
- Eligible?
- —
Short-term bridge; refi at stabilization.
Rent comps 6 comps
| Address | Beds | Baths | Sqft | Rent | $/sqft | DOM | Units | Dist |
|---|---|---|---|---|---|---|---|---|
| 306 Brighton St Thomasville, GA | 3.0 | 2.0 | 1440 | $1,800 | $1.25 | 43d | 1 | 0.17mi |
| 100 Pine St Thomasville, GA | 2.0 | 2.5 | 1216 | $1,550 | $1.27 | 43d | 1 | 0.67mi |
| 403 Remington Ave Thomasville, GA | 2.0 | 1.0 | 891 | $1,575 | $1.77 | 43d | 1 | 0.77mi |
| 209 E Monroe St Unit 1 Thomasville, GA | 2.0 | 1.0 | 1236 | $1,500 | $1.21 | 43d | 1 | 0.97mi |
| 1720 S Pinetree Blvd Thomasville, GA | 3.0 | 2.0 | 924 | $1,150 | $1.24 | 21d | 1 | 1.20mi |
| 220 Covington Ave Thomasville, GA | 1.0–3.0 | 1.0–2.0 | 1014 | $1,350 | $1.33 | 43d | 10 | 1.45mi |
Listing history 19 events
-
2026-06-19days on market $70,000 Active 27 DOM
-
2026-06-18days on market $70,000 Active 26 DOM
-
2026-06-17days on market $70,000 Active 25 DOM
-
2026-06-16pricedays on market $70,000 Active 24 DOM
-
2026-06-15days on market $75,000 Active 23 DOM
-
2026-06-14days on market $75,000 Active 21 DOM
-
2026-06-12days on market $75,000 Active 20 DOM
-
2026-06-09days on market $75,000 Active 17 DOM
-
2026-06-08days on market $75,000 Active 16 DOM
-
2026-06-07days on market $75,000 Active 15 DOM
-
2026-06-07days on market $75,000 Active 14 DOM
-
2026-06-03days on market $75,000 Active 11 DOM
-
2026-06-02days on market $75,000 Active 10 DOM
-
2026-06-01days on market $75,000 Active 9 DOM
-
2026-05-31days on market $75,000 Active 8 DOM
-
2026-05-31days on market $75,000 Active 7 DOM
-
2026-05-27status Active
-
2026-05-21historical
-
2026-05-16$75,000 Active
ⓘ Source: listings_history table (triggers on properties + properties_extension) + one-shot
backfill from property_details.listing_events for pre-trigger history.
Tax reassessment forecast GA · Resets to sale price
- Current annual tax
- $152 · $13/mo
- Projected year-2 tax
- $644 · $54/mo
- Expected delta
- +$492/yr (+$41/mo · 325.0%)
ⓘ Screening estimate from a state-policy table — verify with the county assessor before closing.
Climate risk First Street
- Flood 3/10 Moderate FEMA zone X (unshaded) · 20% chance over 30 yrs
- Wildfire 2/10 Low
- Heat 8/10 Severe 7 d/yr ≥108°F today · 19 d/yr by 30 yrs out
- Wind 8/10 Severe 99% chance of damaging wind over 30 yrs
- Air quality 5/10 Major 8 unhealthy d/yr today · 8 by 30 yrs out
Nearby sold comps map
Loading sold comps map…
Walkable amenities ~0.75 mi
Loading nearby amenities…
Taxation est. · year 1
- Rental income
- $21,890
- − Mortgage interest
- −$3,921
- − Property taxes
- −$152
- − Insurance
- −$350
- − Repairs & maintenance
- −$1,751
- − Management
- −$1,751
- − Depreciation
- −$2,036
- Taxable income
- $11,929
- Est. tax owed @ 24.0%
- −$2,863
- After-tax cash flow
- $9,524/yr
For passive investors: Depreciation is non-cash, so a rental often shows a tax loss while cash-flowing — sheltering income. Rental losses are passive: they offset passive income freely, and up to $25,000/yr can offset ordinary (W-2) income if you actively participate and your MAGI is under $100k (phasing out to $0 by $150k); unused losses carry forward. On sale, claimed depreciation is recaptured at up to 25%, and gains may owe capital-gains tax (a 1031 exchange can defer both). Figures are a year-1 estimate at your 24.0% rate — not tax advice; consult a CPA.
Schools (NCES district)
- District
- Thomasville City
- NCES district ID
- 1304950
- Math proficiency
- 29% ▼ -6.00%
- Reading proficiency
- 37% ▼ -8.00%
- Median HH income
- $31,040
- Composite
- 26.85/100
- National rank
- #7106
- State rank
- #87 of 174 in GA
Livability — Thomasville
- Score
- 71/100
- State rank
- #77
- US rank
- #6678
Category grades
Schools grade is shown separately in the Schools card above.
Census & demographics
- Census place
- Thomasville, GA
- County
- Thomas County · 22,962 people
- City population
- 22,962
- Metro
- Thomasville, GA
- Population (ZIP)
- 22,962
- Household income
- $50,460
- Rent vs Own
- Severe rent burden
- 1059.0
Population outlook (Thomas County) Hauer SSP2
- Today (2025)
- 45,303 people
- By 2030
- 45,052 · -0.6%
- By 2040
- 44,034 · -2.8%
- By 2050
- 42,310 · -6.6%
- By 2075
- 37,569 · -17.1%
- By 2100
- 30,676 · -32.3%
Race, ethnicity, and origin ACS 2023
- Race & ethnicity
- Black 49% White 47% Two or more races 2% Hispanic / Latino 2%
- Common ancestry
- Slovak 2% Italian 1% Lithuanian 1%
- Foreign-born
- 2% · Canada
- Languages at home
- 96% English-only · Spanish 2%
Political lean MEDSL · Thomas
- 2024 margin
- Strong R (+24.1) · D 37.8% · R 61.9%
- 2008→2024 swing
- -8.3pp toward R · 2008: -15.8pp · 2024: -24.1pp
- All cycles
- 2024: R+24.1 2020: R+19.5 2016: R+21.8 2012: R+18.5 2008: R+15.8
Not yet ingested
- Civics
- —
Market trends
- HPI YoY
- ▼ -93.17%
- Current HPI
- 228.0107
- Rent YoY
- —
- Metro
- Thomasville, GA
- State GDP YoY
- ▲ 2.66%
- F500 in state
- 28
Industry mix (Fortune 500 HQ in GA)
| Industry | F500 HQs | Revenue |
|---|---|---|
| Paper / Packaging | 2 | $29B |
|
||
| Retail | 1 | $160B |
|
||
| Transportation / Logistics | 1 | $91B |
|
||
| Airlines | 1 | $62B |
|
||
| Consumer Goods | 1 | $47B |
|
||
| Utilities | 1 | $25B |
|
||
Price history
3 events — show timeline
- 2026-05-27 Relisted — TABRMLS
- 2026-05-21 Delisted — TABRMLS
- 2026-05-16 Listed $75,000 TABRMLS
Property tax history
+1.4%/yrLatest (2025): $152 · +0.2% YoY. Source: county tax records.
Cash-flow waterfall
monthlySold comps — $/sqft
last 12 mo · ≤1 miLoading sold comps…