 🏷️ Likely Rental
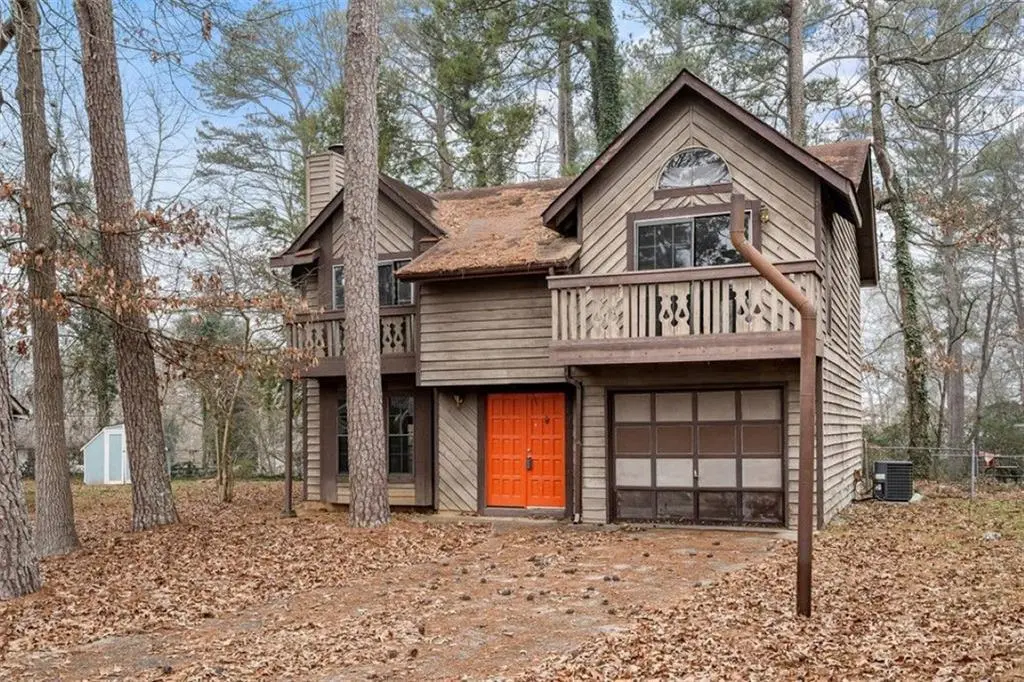
1043 Ascot Ct · Riverdale, GA
Flood risk 1/10 · Minimal
- FEMA flood zone
- X (unshaded)
- Chance of flooding over 30 yrs
- 0.0%
- Est. flood insurance / yr
- $507 – $1,088
Fire risk 1/10 · Minimal
- Est. fire insurance / yr
- $963 – $1,789
Heat risk 5/10 · Moderate
- Hot days now (above 104°F)
- 7 days/yr
- Hot days in 30 yrs
- 17 days/yr
Wind risk 6/10 · Moderate
- Chance of severe wind over 30 yrs
- 27.0%
Air-quality risk 4/10 · Minor
- Unhealthy air days now
- 4 days/yr
- Unhealthy air days in 30 yrs
- 7 days/yr
Risk factors via First Street. Map © Google.
Why this score? — see what drove the C grade
The composite is a weighted blend of 9 inputs, each scored 0–100. Each bar is that input's sub-score; the figure is the points it added to the 100-point composite (weight × sub-score).
- Cash flow +21.3/30.0
- ARV discount +15.0/15.0
- DSCR +6.8/10.0
- 1% rule +5.7/10.0
- Livability +3.5/5.0
- Rent growth +3.4/5.0
- Condition / age +2.5/5.0
- Schools +1.3/10.0
- Appreciation +0.0/10.0
$180,000
🖨 Deal sheet 📄 Offer letter ✓ Due diligence
Listing remarks MLS
Your next home is just waiting for a personal touch and it's sitting on a quiet cul-de-sac. This 3 bed, 2.5 bath light fixer-upper is also the perfect flip or rental for investors, with solid bones, cosmetic-only work needed, straightforward sweat equity, and an after-repair value pushing into the high $200s. That's real margin. What more do you need? Not in the mood for a full renovation? Skip the heavy lift, do a quick refresh and have a tenant paying you rent next month. The charming wood exterior gives it instant curb appeal and character you can't fake, while inside you'll find a spacious kitchen ready for a budget-friendly glow-up and an attached one-car garage that buyers and renters both love. Whether you're an owner-occupant looking to make it yours from day one or an investor who wants to put this property to work immediately, the math works either way. Come see the potential for yourself.
Key facts
- Quiet cul-de-sac
- Spacious kitchen
- 6,577 sq ft lot
Tags
Neighborhood map
What this means for you Summary
Snapshot
- This is a 3-bed/3.0-bath single-family listed at $180k.
Deal economics
- At list price, monthly cash flow is $263 ($3k/yr) — positive.
- The deal already cash-flows at list — no discount required.
- Meets the 1% rule at list price ($2k rent vs $180k).
- Recommended offer: $158k (12.0% below list) — sets the bar for market timing.
- Cap rate 8.0% vs local median 5.5% in Riverdale — top-decile yield for the area; either an underpriced asset or a hidden risk that comps aren't pricing in. Stress-test before assuming the spread holds.
Location & tenants
- Location reads 70/100 on livability (#100 in GA) — a middle-class / working-renter tenant base. Strengths: cost of living A+, housing A+; Watch: crime D, schools D-, amenities F.
- Clayton County (suburban): math 11% / reading 20% proficiency, ranked #155 of 174 in GA (top 89%) — low school quality limits family demand, transient renter base, plan for 1-2y turnover; 78% free/reduced lunch — lower-income household profile, screen leases tightly.
- Market conditions: Rents rising (+3.5%/yr); 135 active listings in the ZIP; 40 comparable units currently listed for rent nearby; rentals at typical pace (median 22d on market — plan ~3-4 weeks tenant-placement turnaround); 865 units permitted in Clayton County in 2024 (448 in 5+ unit buildings).
- This rent runs 37% of the median local income ($63k/yr) — at the standard rent-burdened threshold; future hikes will face affordability resistance.
Forward outlook
- Local home prices are declining (-3.0%/yr); year-one equity from $1k of loan paydown is wiped out by about $5k of value loss. Plan a longer hold.
- Clayton County population projected at +29% by 2050 — long-run rental-demand tailwind backs the buy-and-hold thesis.
Negotiation context
- It's been on market 125 days — a 12% lower offer ($158k) is reasonable based on typical stale-listing flexibility.
- 4 sale attempts since 12y ago with the ask held roughly flat each time — persistent listings suggest the price (not the market) is what's stuck; bring a comps-based counter.
- Current owner paid $54k; list at $180k implies a 233% gain — meaningful room to come down on a strong offer.
Risks & watch-outs
- Climate carrying-cost: major wind risk, 27% chance of damaging wind over 30y; extreme-heat days projected 7→17/yr by 2055 (HVAC capex compounding) — expect insurance premiums to compound above CPI over the hold.
Questions for the listing agent
- It's been on market 125 days. Have you received any prior offers? Is the seller open to a 12% concession, seller financing, or rate buy-down credit?
- Built in 1977 — when were the roof, HVAC, electrical panel, plumbing, and water heater last replaced?
- Why hasn't it sold? Are there any deal-killer items the seller is aware of (foundation, flood, title, zoning, code violations)?
- Is there a deadline driving the sale (1031 exchange, divorce, estate, relocation)? That informs how much negotiation room exists.
- Schools are D-rated, which usually means shorter tenancies and higher turnover. Who's the typical renter profile here, and what's been the actual vacancy rate?
- Crime grade is D in this area — have there been break-ins, vandalism, or insurance claims at this property in the last 3 years? What carrier currently insures it and at what premium?
- What's the average days-on-market for RENTAL listings here right now (not sales)? A rising rental-DOM trend means longer vacancies and softer asking-rent achievability than the comps imply.
- What's the recent tenant-quality profile in this submarket — average credit score on applications, eviction rate, late-payment / NSF rate, and stable-employment percentage? A property-management company in the area should have these aggregated.
- How much new for-sale + rental construction is in the pipeline within 1–3 miles? Heavy new supply typically softens prices + rents 12–24 months out; constrained supply supports both.
Investment metrics
- 1% rule
- 1.07% ✓
- Cap rate
- 8.05%
- Cash-on-cash
- 6.27%
- DSCR
- 1.28
- GRM
- 7.8
CMA / ARV
- ARV (median comp)
- $247,612
- List price
- $180,000
- Delta
- -27.31%
- Verdict
- UNDERPRICED
- Comps
- 20 within 1.0 mi
Show comp detail 12 sales within ~0.75 mi
| Address | Dist | Beds/Ba | Sqft | Sold | Price | $/sf | Match |
|---|---|---|---|---|---|---|---|
| 1039 River Bend Ct | 0.24mi | 4/3.0 (+1) | 1,633 (+0%) | 3mo | $295,000 | $181 | 81 |
| 1115 Mary Lee Ct | 0.16mi | 4/2.0 (+1) | 1,553 (-5%) | 7mo | $253,000 | $163 | 70 |
| 772 Verde Dr | 0.53mi | 3/3.0 | 1,602 (-2%) | 7mo | $195,000 | $122 | 67 |
| 6500 Wild Turkey Trl | 0.31mi | 3/2.0 | 1,530 (-6%) | 9mo | $219,000 | $143 | 64 |
| 6194 Golden Meadow Ct | 0.42mi | 3/1.0 | 1,678 (+3%) | 7mo | $210,000 | $125 | 62 |
| 742 Verde Dr | 0.58mi | 3/2.0 | 1,696 (+4%) | 1mo | $260,000 | $153 | 61 |
| 6549 Creekview Ct | 0.50mi | 3/2.5 | 1,566 (-4%) | 9mo | $254,900 | $163 | 60 |
| 945 King Rd | 0.20mi | 4/3.0 (+1) | 1,860 (+14%) | 4mo | $340,000 | $183 | 58 |
| 6470 Meadow Lark Dr | 0.29mi | 4/3.0 (+1) | 1,872 (+15%) | 1mo | $279,000 | $149 | 56 |
| 1038 River Bend Ct | 0.27mi | 4/2.0 (+1) | 1,443 (-12%) | 4mo | $164,900 | $114 | 56 |
| 1174 Drawbridge Dr | 0.42mi | 3/2.0 | 1,428 (-12%) | 3mo | $236,000 | $165 | 53 |
| 1189 E Fayetteville Rd | 0.62mi | 4/2.0 (+1) | 1,620 (-1%) | 11mo | $210,000 | $130 | 52 |
Match score weights: distance 35% · size 25% · config 20% · recency 20%. Top-matched comps best support the ARV.
Projected returns pro-forma
-3.0% appreciation · 3.55% rent growth · sell at horizon
- IRR
- -6.0%
- Equity multiple
- 0.78×
- Total profit
- $-11,282
- Equity at exit
- $26,839
- IRR
- 4.3%
- Equity multiple
- 1.33×
- Total profit
- $16,394
- Equity at exit
- $15,563
Cash invested: $50,400 (down + closing). Projections, not guarantees.
Landlord ↔ Tenant lean methodology
- Overall (STATE)
- 90 Strongly Landlord-Friendly
- State Georgia
- 90 Strongly Landlord-Friendly · R+3
- County
- — inherits STATE
- City
- — inherits STATE
ZIP-level market 30296
- Rents YoY
- 3.5%
- Active inventory
- 135
- Price-to-rent
- 7.8×
Monthly cashflow live
- Estimated rent
- $1,931 high interval (Pro) →
- Mortgage (P&I)
- −$944
- Tax from tax record
- −$243 /mo · $2,921/yr
- Insurance
- −$75
- HOA
- −$0
- Vacancy / Maint / Mgmt
- −$406
- Net cashflow
- $263
Break-even live
UW: 25.0% down · 7.5% · 30yr · 1.5% tax · 5.0% vac · 8.0% maint · 8.0% mgmt
Financing live
Cash to close
- Down payment
- $45,000
- Closing costs
- $5,400
- Reserves months
- —
- Total cash needed
- —
Loan-product check · same deal, 3 products live
Conventional
25% down · 7.5% · 30yr
- Down + closing
- —
- Monthly P&I
- —
- Monthly cashflow
- —
- DSCR
- —
- Eligible?
- —
Personal DTI + credit; lowest rate.
DSCR
20% down · 8.5% · 30yr
- Down + closing
- —
- Monthly P&I
- —
- Monthly cashflow
- —
- DSCR
- —
- Eligible?
- —
No personal income docs; deal must DSCR.
Hard money
10% down · 12.0% · 12mo
- Down + closing
- —
- Monthly P&I
- —
- Monthly cashflow
- —
- DSCR
- —
- Eligible?
- —
Short-term bridge; refi at stabilization.
Rent comps 40 comps
| Address | Beds | Baths | Sqft | Rent | $/sqft | DOM | Units | Dist |
|---|---|---|---|---|---|---|---|---|
| 1109 Mary Lee Ct Riverdale, GA | 3.0 | 2.5 | 1905 | $1,900 | $1.00 | 43d | 1 | 0.11mi |
| 6316 Steepleridge Ct Riverdale, GA | 4.0 | 2.5 | 1634 | $2,011 | $1.23 | 5d | 1 | 0.23mi |
| 1019 River Stone Ct Riverdale, GA | 3.0 | 2.0 | 1228 | $1,715 | $1.40 | 15d | 1 | 0.26mi |
| 6492 Meadow Lark Dr Riverdale, GA | 4.0 | 3.0 | 2158 | $2,260 | $1.05 | 2d | 1 | 0.29mi |
| 6554 River Glen Dr Riverdale, GA | 3.0 | 2.5 | 1634 | $1,861 | $1.14 | 5d | 1 | 0.31mi |
| 776 Glenshire Ct Riverdale, GA | 4.0 | 3.0 | 1454 | $1,766 | $1.21 | 43d | 1 | 0.33mi |
| 6061 Pine View Ter Riverdale, GA | 3.0 | 2.0 | 1508 | $1,811 | $1.20 | 2d | 1 | 0.50mi |
| 1118 Quail Hunt Dr Riverdale, GA | 4.0 | 2.5 | 2227 | $2,100 | $0.94 | 43d | 1 | 0.54mi |
| 1146 E Fayetteville Rd Riverdale, GA | 3.0 | 2.0 | 1590 | $1,781 | $1.12 | 12d | 1 | 0.58mi |
| 839 River Glen Pl Riverdale, GA | 3.0 | 2.0 | 1414 | $1,870 | $1.32 | 5d | 1 | 0.60mi |
| 6114 Riverdale Rd Atlanta, GA | 2.0 | 2.0 | 1113 | $1,735 | $1.56 | 43d | 1 | 0.63mi |
| 6181 Harkness Ct Riverdale, GA | 4.0 | 2.0 | 1355 | $2,099 | $1.55 | 43d | 1 | 0.65mi |
| 6616 Wellesley Dr Riverdale, GA | 4.0 | 3.0 | 1652 | $2,395 | $1.45 | 22d | 1 | 0.73mi |
| 828 Overlook Ter Atlanta, GA | 3.0 | 2.5 | 1270 | $1,495 | $1.18 | 3d | 1 | 0.73mi |
| 6030 Riverdale Rd Riverdale, GA | 2.0 | 2.0 | 1137 | $1,725 | $1.52 | 43d | 1 | 0.75mi |
| 6030 Riverdale Rd Atlanta, GA | 1.0–3.0 | 1.0–2.0 | 1043 | $1,895 | $1.82 | 43d | 21 | 0.75mi |
| 6635 Autumn West Dr Riverdale, GA | 3.0 | 2.0 | 1728 | $1,840 | $1.06 | 24d | 1 | 0.78mi |
| 654 Roy Huie Rd Unit 1 Riverdale, GA | 2.0 | 1.0 | 1125 | $1,250 | $1.11 | 24d | 1 | 0.83mi |
| 6491 Camp St Riverdale, GA | 2.0 | 1.0 | 1073 | $1,468 | $1.37 | 5d | 1 | 0.85mi |
| 6215 Stimson Way Riverdale, GA | 3.0 | 2.0 | 1384 | $1,805 | $1.30 | 2d | 1 | 0.92mi |
| 5890 Riverdale Rd Atlanta, GA | 3.0 | 2.0 | 1121 | $1,559 | $1.39 | 43d | 1 | 0.92mi |
| 934 Garden Walk Blvd Atlanta, GA | 1.0–2.0 | 1.0–2.0 | 875 | $1,610 | $1.84 | 2d | 12 | 0.96mi |
| 6232 Lance Ln Riverdale, GA | 3.0 | 2.0 | 1900 | $1,959 | $1.03 | 24d | 1 | 0.98mi |
| 504 Pinecrest Dr Riverdale, GA | 4.0 | 2.0 | 1500 | $1,700 | $1.13 | 24d | 1 | 1.00mi |
| 1357 Heather Cir Riverdale, GA | 3.0 | 2.0 | 1553 | $1,794 | $1.16 | 4d | 1 | 1.01mi |
| 6989 Cedar Dr Riverdale, GA | 3.0 | 2.0 | 1536 | $1,680 | $1.09 | 2d | 1 | 1.02mi |
| 500 Denham St Riverdale, GA | 3.0 | 2.0 | 1174 | $2,400 | $2.04 | 5d | 1 | 1.03mi |
| 6704 Amesbury Ln Riverdale, GA | 3.0 | 2.0 | 1654 | $1,985 | $1.20 | 43d | 1 | 1.03mi |
| 6798 Collier Way Riverdale, GA | 4.0 | 2.0 | 1900 | $1,900 | $1.00 | 24d | 1 | 1.06mi |
| 852 Garden Walk Blvd Atlanta, GA | 1.0–2.0 | 1.0–2.0 | 835 | $1,489 | $1.78 | 43d | 9 | 1.08mi |
| 1410 Willow Dr Riverdale, GA | 3.0 | 2.0 | 1365 | $1,599 | $1.17 | 43d | 1 | 1.11mi |
| 1110 Garden Walk Blvd Atlanta, GA | 1.0–3.0 | 1.0–2.0 | 1016 | $1,720 | $1.69 | 2d | 22 | 1.12mi |
| 1081 Garden Walk Blvd Atlanta, GA | 1.0–2.0 | 1.0–2.0 | 895 | $1,502 | $1.68 | 2d | 35 | 1.13mi |
| 563 Briar Hill Ct Riverdale, GA | 1.0–2.0 | 1.0–2.0 | 1132 | $1,350 | $1.19 | 18d | 9 | 1.14mi |
| 1387 Cater Ln Riverdale, GA | 4.0 | 2.5 | 2136 | $2,095 | $0.98 | 5d | 1 | 1.14mi |
| 6839 Sandy Creek Dr Riverdale, GA | 4.0 | 2.0 | 1566 | $4,600 | $2.94 | 43d | 1 | 1.16mi |
| 6476 Voyles Dr Unit 1 Riverdale, GA | 2.0 | 1.0 | 1200 | $2,250 | $1.88 | 24d | 1 | 1.17mi |
| 6476 Voyles Dr Riverdale, GA | 2.0 | 2.0 | 1200 | $2,250 | $1.88 | 22d | 1 | 1.17mi |
| 6055 Yellowood Ct Atlanta, GA | 3.0 | 3.0 | 2014 | $2,181 | $1.08 | 12d | 1 | 1.25mi |
| 6433 Valley Brook Dr Riverdale, GA | 4.0 | 2.0 | 2000 | $2,500 | $1.25 | 24d | 1 | 1.26mi |
Listing history 22 events
-
2026-06-18days on market $180,000 Active 125 DOM
-
2026-06-17days on market $180,000 Active 124 DOM
-
2026-06-16days on market $180,000 Active 123 DOM
-
2026-06-15days on market $180,000 Active 122 DOM
-
2026-06-13days on market $180,000 Active 120 DOM
-
2026-06-09days on market $180,000 Active 116 DOM
-
2026-06-08days on market $180,000 Active 115 DOM
-
2026-06-07days on market $180,000 Active 114 DOM
-
2026-06-04days on market $180,000 Active 111 DOM
-
2026-06-03days on market $180,000 Active 110 DOM
-
2026-06-02days on market $180,000 Active 109 DOM
-
2026-06-01days on market $180,000 Active 108 DOM
-
2026-05-31days on market $180,000 Active 107 DOM
-
2026-02-13$180,000 New 912-char remark
Show marketing remark (912 chars)
Your next home is just waiting for a personal touch and it's sitting on a quiet cul-de-sac. This 3 bed, 2.5 bath light fixer-upper is also the perfect flip or rental for investors, with solid bones, cosmetic-only work needed, straightforward sweat equity, and an after-repair value pushing into the high $200s. That's real margin. What more do you need? Not in the mood for a full renovation? Skip the heavy lift, do a quick refresh and have a tenant paying you rent next month. The charming wood exterior gives it instant curb appeal and character you can't fake, while inside you'll find a spacious kitchen ready for a budget-friendly glow-up and an attached one-car garage that buyers and renters both love. Whether you're an owner-occupant looking to make it yours from day one or an investor who wants to put this property to work immediately, the math works either way. Come see the potential for yourself.
-
2026-02-13$180,000 Active 912-char remark
Show marketing remark (912 chars)
Your next home is just waiting for a personal touch and it's sitting on a quiet cul-de-sac. This 3 bed, 2.5 bath light fixer-upper is also the perfect flip or rental for investors, with solid bones, cosmetic-only work needed, straightforward sweat equity, and an after-repair value pushing into the high $200s. That's real margin. What more do you need? Not in the mood for a full renovation? Skip the heavy lift, do a quick refresh and have a tenant paying you rent next month. The charming wood exterior gives it instant curb appeal and character you can't fake, while inside you'll find a spacious kitchen ready for a budget-friendly glow-up and an attached one-car garage that buyers and renters both love. Whether you're an owner-occupant looking to make it yours from day one or an investor who wants to put this property to work immediately, the math works either way. Come see the potential for yourself.
-
2025-09-04historical $1,700
-
2025-07-26$1,700
-
2014-05-01historical
-
2014-04-25price $80,000 Reduced
-
2014-03-13$86,000 New
-
1993-03-09soldstatus $54,079
-
1987-03-20soldstatus $70,900
ⓘ Source: listings_history table (triggers on properties + properties_extension) + one-shot
backfill from property_details.listing_events for pre-trigger history.
Tax reassessment forecast GA · Resets to sale price
- Current annual tax
- $2,921 · $243/mo
- Projected year-2 tax
- $2,921 · $243/mo
- Expected delta
- $0/yr ($0/mo · 0.0%)
ⓘ Screening estimate from a state-policy table — verify with the county assessor before closing.
Climate risk First Street
- Flood 1/10 Low FEMA zone X (unshaded) · 0% chance over 30 yrs
- Wildfire 1/10 Low
- Heat 5/10 Major 7 d/yr ≥104°F today · 17 d/yr by 30 yrs out
- Wind 6/10 Major 27% chance of damaging wind over 30 yrs
- Air quality 4/10 Moderate 4 unhealthy d/yr today · 7 by 30 yrs out
Nearby sold comps map
Loading sold comps map…
Walkable amenities ~0.75 mi
Loading nearby amenities…
Taxation est. · year 1
- Rental income
- $23,175
- − Mortgage interest
- −$10,083
- − Property taxes
- −$2,921
- − Insurance
- −$900
- − Repairs & maintenance
- −$1,854
- − Management
- −$1,854
- − Depreciation
- −$5,236
- Taxable income
- $327
- Est. tax owed @ 24.0%
- −$78
- After-tax cash flow
- $3,081/yr
For passive investors: Depreciation is non-cash, so a rental often shows a tax loss while cash-flowing — sheltering income. Rental losses are passive: they offset passive income freely, and up to $25,000/yr can offset ordinary (W-2) income if you actively participate and your MAGI is under $100k (phasing out to $0 by $150k); unused losses carry forward. On sale, claimed depreciation is recaptured at up to 25%, and gains may owe capital-gains tax (a 1031 exchange can defer both). Figures are a year-1 estimate at your 24.0% rate — not tax advice; consult a CPA.
Schools (NCES district)
- District
- Clayton County
- NCES district ID
- 1301230
- Math proficiency
- 11% ▼ -13.00%
- Reading proficiency
- 20% ▼ -9.00%
- Median HH income
- $42,266
- Composite
- 13.41/100
- National rank
- #9527
- State rank
- #155 of 174 in GA
Livability — Riverdale
- Score
- 70/100
- State rank
- #100
- US rank
- #7907
Category grades
Schools grade is shown separately in the Schools card above.
Census & demographics
- Census place
- Riverdale, GA
- County
- Clayton County · 230,153 people
- City population
- 61,126
- Metro
- Atlanta-Sandy Springs-Alpharetta, GA
- Population (ZIP)
- 27,045
- Household income
- $63,292
- Rent vs Own
- Severe rent burden
- 1400.0
Population outlook (Clayton County) Hauer SSP2
- Today (2025)
- 310,777 people
- By 2030
- 329,762 · +6.1%
- By 2040
- 368,052 · +18.4%
- By 2050
- 401,196 · +29.1%
- By 2075
- 472,488 · +52.0%
- By 2100
- 500,446 · +61.0%
Race, ethnicity, and origin ACS 2023
- Neighborhood character
- Predominantly Black (81%)
- Race & ethnicity
- Black 81% Hispanic / Latino 10% White 4% Asian 4% Two or more races 4%
- Hispanic origin (detail)
- Mexican 7%
- Common ancestry
- Hispanic 2%
- Foreign-born
- 14% · Canada, China, Vietnam
- Languages at home
- 80% English-only · Spanish 9% Chinese 3% French/Haitian/Cajun 2%
Political lean MEDSL · Clayton
- 2024 margin
- Solid D (+69.2) · D 84.3% · R 15.1%
- 2008→2024 swing
- +2.8pp toward D · 2008: 66.4pp · 2024: 69.2pp
- All cycles
- 2024: D+69.2 2020: D+70.9 2016: D+71.9 2012: D+70.1 2008: D+66.4
Not yet ingested
- Civics
- —
Market trends
- HPI YoY
- ▼ -137.25%
- Current HPI
- 209.7527
- Rent YoY
- ▲ 3.55%
- Metro
- Atlanta-Sandy Springs-Alpharetta, GA
- State GDP YoY
- ▲ 2.66%
- F500 in state
- 28
Industry mix (Fortune 500 HQ in GA)
| Industry | F500 HQs | Revenue |
|---|---|---|
| Paper / Packaging | 2 | $29B |
|
||
| Retail | 1 | $160B |
|
||
| Transportation / Logistics | 1 | $91B |
|
||
| Airlines | 1 | $62B |
|
||
| Consumer Goods | 1 | $47B |
|
||
| Utilities | 1 | $25B |
|
||
Price history
+153.9% since first listed9 events — show timeline
- 2026-02-13 Listed $180,000 FMLS
- 2026-02-13 Listed $180,000 GAMLS
- 2025-09-04 Rental Removed $1,700 SUNRENTALS
- 2025-07-26 Listed for Rent $1,700 SUNRENTALS
- 2014-05-01 Listing Removed — GAMLS
- 2014-04-25 Price Changed $80,000 GAMLS
- 2014-03-13 Listed $86,000 GAMLS
- 1993-03-09 Sold (Public Records) $54,079 Public Records
- 1987-03-20 Sold (Public Records) $70,900 Public Records
Property tax history
+5.1%/yrLatest (2025): $2,921 · +31.8% YoY. Source: county tax records.
Cash-flow waterfall
monthlySold comps — $/sqft
last 12 mo · ≤1 miLoading sold comps…