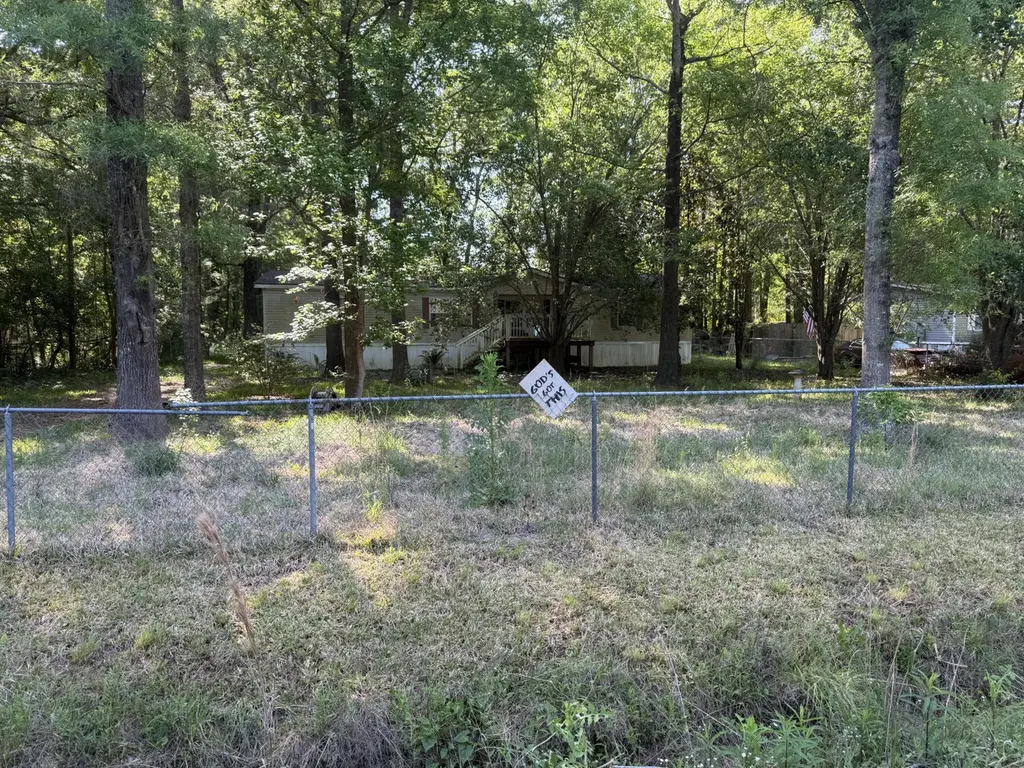
197 Frank St · Summerville, SC
Flood risk 1/10 · Minimal
- FEMA flood zone
- X (unshaded)
- Chance of flooding over 30 yrs
- 0.0%
- Est. flood insurance / yr
- $507 – $1,088
Fire risk 5/10 · Moderate
- Est. fire insurance / yr
- $783 – $1,453
Heat risk 8/10 · Major
- Hot days now (above 106°F)
- 7 days/yr
- Hot days in 30 yrs
- 17 days/yr
Wind risk 8/10 · Major
- Chance of severe wind over 30 yrs
- 97.0%
Air-quality risk 3/10 · Minor
- Unhealthy air days now
- 3 days/yr
- Unhealthy air days in 30 yrs
- 3 days/yr
Risk factors via First Street. Map © Google.
Why this score? — see what drove the B grade
The composite is a weighted blend of 9 inputs, each scored 0–100. Each bar is that input's sub-score; the figure is the points it added to the 100-point composite (weight × sub-score).
- Cash flow +30.0/30.0
- 1% rule +10.0/10.0
- DSCR +10.0/10.0
- ARV discount +7.5/15.0
- Schools +4.1/10.0
- Livability +3.2/5.0
- Rent growth +2.9/5.0
- Condition / age +2.5/5.0
- Appreciation +0.0/10.0
$130,000
🖨 Deal sheet 📄 Offer letter ✓ Due diligence
Listing remarks
Great investment opportunity close to everything in the Summerville area. Home has a large beautiful lot with mature trees. Home needs extensive work but appears to have great bones. Close to all Summerville has to offer and just a few minutes to the interstate.
Key facts
- 0.49 acre lot
- Built 2002
- Listed 12 days
Property features AI
Exterior
- Parking: Off-street parking
- Utilities: Private sewer
- Home design: Manufactured/mobile home (residential); Single-story; Ground-level entry
- Construction: Architectural roof; Vinyl skirt
- Exterior features: Chain link fencing; Level lot; Lot between 0.5 and 1 acre
Interior
- Bedrooms: 3 bedrooms
- Bathrooms: 2 bathrooms
- Interior features: Blown ceiling insulation
Neighborhood map
What this means for you Summary
Snapshot
- This is a 3-bed/2.0-bath manufactured listed at $130k.
Deal economics
- At list price, monthly cash flow is $1k ($13k/yr) — positive.
- The deal already cash-flows at list — no discount required.
- Meets the 1% rule at list price ($2k rent vs $130k).
- Cap rate 16.2% vs local median 4.0% in Summerville — top-decile yield for the area; either an underpriced asset or a hidden risk that comps aren't pricing in. Stress-test before assuming the spread holds.
Location & tenants
- Location reads 63/100 on livability (#167 in SC) — a middle-class / working-renter tenant base. Strengths: housing A+, cost of living B+; Watch: amenities F, commute F, health & safety F.
- Dorchester 02 (suburban): math 40% / reading 55% proficiency, ranked #12 of 80 in SC (top 15%) — families likely to look elsewhere, expect single-tenant / working-renter base with shorter leases.
- Zoned schools: William M. Reeves Elementary (math 51% / reading 55%, grade C, #138 of 597 statewide, top 24%, 914 students, 62% FRL); Charles B. Dubose Middle (math 30% / reading 45%, grade F, #90 of 229 statewide, top 42%, 950 students, 62% FRL); Summerville High (math 60% / reading 92%, grade A-, #34 of 196 statewide, top 17%, 3,308 students, 59% FRL) — zoned schools average 61% FRL vs 36% district-wide (25 pts higher); higher-poverty schools than district average — tighter screening recommended.
- Market conditions: Rents rising (+1.4%/yr); 741 active listings in the ZIP; 6 comparable units currently listed for rent nearby; rentals at typical pace (median 19d on market — plan ~3-4 weeks tenant-placement turnaround); solid renter incomes; 1,199 units permitted in Dorchester County in 2024 (0 in 5+ unit buildings).
- This rent runs 33% of the median local income ($86k/yr) — at the standard rent-burdened threshold; future hikes will face affordability resistance.
Forward outlook
- Local home prices are declining (-3.0%/yr); year-one equity from $899 of loan paydown is wiped out by about $4k of value loss. Plan a longer hold.
- Dorchester County population projected at +43% by 2050 — long-run rental-demand tailwind backs the buy-and-hold thesis.
- At projected returns (-3.0% appreciation + 1.4% rent growth), your $36k cash investment doubles in ~4 years — after that, you're playing with house money.
Negotiation context
- Only 12 days on market — expect competitive offers; lowballing is unlikely to land.
Risks & watch-outs
- Climate carrying-cost: severe wind risk, 97% chance of damaging wind over 30y; moderate wildfire risk; extreme-heat days projected 7→17/yr by 2055 (HVAC capex compounding) — expect insurance premiums to compound above CPI over the hold.
Questions for the listing agent
- Is there a deadline driving the sale (1031 exchange, divorce, estate, relocation)? That informs how much negotiation room exists.
- Schools are B-rated — typically a magnet for longer-tenancy family renters. What's the average tenant stay here, and is there a school-zone premium baked into asking?
- What's the average days-on-market for RENTAL listings here right now (not sales)? A rising rental-DOM trend means longer vacancies and softer asking-rent achievability than the comps imply.
- What's the recent tenant-quality profile in this submarket — average credit score on applications, eviction rate, late-payment / NSF rate, and stable-employment percentage? A property-management company in the area should have these aggregated.
- How much new for-sale + rental construction is in the pipeline within 1–3 miles? Heavy new supply typically softens prices + rents 12–24 months out; constrained supply supports both.
Investment metrics
- 1% rule
- 1.82% ✓
- Cap rate
- 16.17%
- Cash-on-cash
- 35.27%
- DSCR
- 2.57
- GRM
- 4.6
CMA / ARV
- ARV (on-the-fly)
- $270,592
- Comps found
- 12
Show comp detail 12 sales within ~0.75 mi
| Address | Dist | Beds/Ba | Sqft | Sold | Price | $/sf | Match |
|---|---|---|---|---|---|---|---|
| 197 Frank St | 0.00mi | 3/2.0 | 1,752 (-2%) | 0mo | $130,000 | $74 | 96 |
| 201 Frank St | 0.02mi | 3/2.0 | 1,680 (-6%) | 10mo | $229,900 | $137 | 80 |
| 138 George Keen Dr | 0.50mi | 3/2.0 | 1,792 (0%) | 3mo | $225,000 | $126 | 74 |
| 144 Allspice Dr | 0.51mi | 3/2.0 | 1,792 (0%) | 8mo | $310,000 | $173 | 70 |
| 108 Swanson Dr | 0.36mi | 4/2.0 (+1) | 1,791 (-0%) | 11mo | $305,000 | $170 | 69 |
| 106 Swanson Dr | 0.36mi | 4/2.0 (+1) | 1,762 (-2%) | 9mo | $294,500 | $167 | 68 |
| 175 Koger Dr | 0.45mi | 3/2.0 | 1,620 (-10%) | 3mo | $215,000 | $133 | 60 |
| 108 Lake Dr | 0.48mi | 4/2.0 (+1) | 1,680 (-6%) | 4mo | $148,000 | $88 | 59 |
| 202 George Keen Dr | 0.52mi | 4/2.0 (+1) | 1,900 (+6%) | 5mo | $310,000 | $163 | 56 |
| 99 Schoonover Dr | 0.57mi | 3/2.0 | 1,680 (-6%) | 20mo | $253,000 | $151 | 46 |
| 218 Dean Dr | 0.71mi | 4/2.0 (+1) | 1,762 (-2%) | 17mo | $284,350 | $161 | 45 |
| 220 Dean Dr | 0.70mi | 4/2.0 (+1) | 1,904 (+6%) | 16mo | $288,000 | $151 | 38 |
Match score weights: distance 35% · size 25% · config 20% · recency 20%. Top-matched comps best support the ARV.
Projected returns pro-forma
-3.0% appreciation · 1.45% rent growth · sell at horizon
- IRR
- 29.2%
- Equity multiple
- 2.19×
- Total profit
- $43,408
- Equity at exit
- $19,383
- IRR
- 35.6%
- Equity multiple
- 4.05×
- Total profit
- $110,979
- Equity at exit
- $11,240
Cash invested: $36,400 (down + closing). Projections, not guarantees.
Landlord ↔ Tenant lean methodology
- Overall (STATE)
- 90 Strongly Landlord-Friendly
- State South Carolina
- 90 Strongly Landlord-Friendly · R+6
- County
- — inherits STATE
- City
- — inherits STATE
ZIP-level market 29483
- Home prices YoY
- -34.6%
- Rents YoY
- 1.4%
- Active inventory
- 741
- Price-to-rent
- 4.6×
Monthly cashflow live
- Estimated rent
- $2,364 high interval (Pro) →
- Mortgage (P&I)
- −$682
- Tax from tax record
- −$62 /mo · $745/yr
- Insurance
- −$54
- HOA
- −$0
- Vacancy / Maint / Mgmt
- −$496
- Net cashflow
- $1,070
Break-even live
UW: 25.0% down · 7.5% · 30yr · 1.5% tax · 5.0% vac · 8.0% maint · 8.0% mgmt
Financing live
Cash to close
- Down payment
- $32,500
- Closing costs
- $3,900
- Reserves months
- —
- Total cash needed
- —
Loan-product check · same deal, 3 products live
Conventional
25% down · 7.5% · 30yr
- Down + closing
- —
- Monthly P&I
- —
- Monthly cashflow
- —
- DSCR
- —
- Eligible?
- —
Personal DTI + credit; lowest rate.
DSCR
20% down · 8.5% · 30yr
- Down + closing
- —
- Monthly P&I
- —
- Monthly cashflow
- —
- DSCR
- —
- Eligible?
- —
No personal income docs; deal must DSCR.
Hard money
10% down · 12.0% · 12mo
- Down + closing
- —
- Monthly P&I
- —
- Monthly cashflow
- —
- DSCR
- —
- Eligible?
- —
Short-term bridge; refi at stabilization.
Rent comps 6 comps
| Address | Beds | Baths | Sqft | Rent | $/sqft | DOM | Units | Dist |
|---|---|---|---|---|---|---|---|---|
| 212 Longford Dr Summerville, SC | 4.0 | 2.5 | 2100 | $2,450 | $1.17 | 19d | 1 | 0.46mi |
| 226 Saint Catherines Ct Unit Carlile Summerville, SC | 3.0 | 2.5 | 1540 | $2,100 | $1.36 | 23d | 1 | 0.58mi |
| 226 Saint Catherines Ct Unit Retreat Summerville, SC | 3.0 | 2.5 | 1540 | $2,000 | $1.30 | 23d | 1 | 0.58mi |
| 221 Berwick Dr Summerville, SC | 3.0 | 3.0 | 2284 | $2,500 | $1.09 | 3d | 1 | 0.74mi |
| 292 Greyback Rd Summerville, SC | 3.0 | 2.0 | 1500 | $2,995 | $2.00 | 2d | 1 | 0.91mi |
| 1000 N Pine St Summerville, SC | 3.0 | 1.0–3.0 | 1036 | $2,760 | $2.66 | 2d | 92 | 1.15mi |
Listing history 2 events
-
2026-04-29status Pending
-
2026-04-17$130,000 Active
ⓘ Source: listings_history table (triggers on properties + properties_extension) + one-shot
backfill from property_details.listing_events for pre-trigger history.
Tax reassessment forecast SC · Resets to sale price
- Current annual tax
- $745 · $62/mo
- Projected year-2 tax
- $745 · $62/mo
- Expected delta
- $0/yr ($0/mo · 0.0%)
ⓘ Screening estimate from a state-policy table — verify with the county assessor before closing.
Climate risk First Street
- Flood 1/10 Low FEMA zone X (unshaded) · 0% chance over 30 yrs
- Wildfire 5/10 Major
- Heat 8/10 Severe 7 d/yr ≥106°F today · 17 d/yr by 30 yrs out
- Wind 8/10 Severe 97% chance of damaging wind over 30 yrs
- Air quality 3/10 Moderate 3 unhealthy d/yr today · 3 by 30 yrs out
Nearby sold comps map
Loading sold comps map…
Walkable amenities ~0.75 mi
Loading nearby amenities…
Taxation est. · year 1
- Rental income
- $28,371
- − Mortgage interest
- −$7,282
- − Property taxes
- −$745
- − Insurance
- −$650
- − Repairs & maintenance
- −$2,270
- − Management
- −$2,270
- − Depreciation
- −$3,782
- Taxable income
- $11,372
- Est. tax owed @ 24.0%
- −$2,729
- After-tax cash flow
- $10,107/yr
For passive investors: Depreciation is non-cash, so a rental often shows a tax loss while cash-flowing — sheltering income. Rental losses are passive: they offset passive income freely, and up to $25,000/yr can offset ordinary (W-2) income if you actively participate and your MAGI is under $100k (phasing out to $0 by $150k); unused losses carry forward. On sale, claimed depreciation is recaptured at up to 25%, and gains may owe capital-gains tax (a 1031 exchange can defer both). Figures are a year-1 estimate at your 24.0% rate — not tax advice; consult a CPA.
Schools (NCES district)
- District
- Dorchester 02
- NCES district ID
- 4502010
- Math proficiency
- 40% ▼ -13.00%
- Reading proficiency
- 55% ▼ -4.00%
- Median HH income
- $57,937
- Composite
- 41.41/100
- National rank
- #3475
- State rank
- #12 of 80 in SC
Livability — Summerville
- Score
- 63/100
- State rank
- #167
- US rank
- #15058
Category grades
Schools grade is shown separately in the Schools card above.
Census & demographics
- County
- Dorchester County · 182,866 people
- City population
- 171,668
- Metro
- Charleston-North Charleston, SC
- Population (ZIP)
- 59,186
- Household income
- $85,750
- Rent vs Own
- Severe rent burden
- 1309.0
Population outlook (Dorchester County) Hauer SSP2
- Today (2025)
- 186,982 people
- By 2030
- 203,967 · +9.1%
- By 2040
- 237,160 · +26.8%
- By 2050
- 267,479 · +43.1%
- By 2075
- 333,025 · +78.1%
- By 2100
- 366,560 · +96.0%
Race, ethnicity, and origin ACS 2023
- Neighborhood character
- Predominantly White (68%)
- Race & ethnicity
- White 68% Black 19% Hispanic / Latino 7% Two or more races 6% Asian 1%
- Hispanic origin (detail)
- Mexican 3% Puerto Rican 1%
- Common ancestry
- Slovak 3% Lithuanian 3% Romanian 3%
- Foreign-born
- 5% · Canada
- Languages at home
- 93% English-only · Spanish 4%
Political lean MEDSL · Dorchester
- 2024 margin
- R (+14.6) · D 41.8% · R 56.4% · Other 1.9%
- 2008→2024 swing
- +0.9pp no change · 2008: -15.5pp · 2024: -14.6pp
- All cycles
- 2024: R+14.6 2020: R+10.5 2016: R+17.5 2012: R+16.0 2008: R+15.5
Not yet ingested
- Civics
- —
Market trends
- HPI YoY
- ▼ -131.42%
- Current HPI
- 248.8406
- Rent YoY
- ▲ 1.45%
- Metro
- Charleston-North Charleston, SC
- State GDP YoY
- ▲ 4.51%
- F500 in state
- 2
Industry mix (Fortune 500 HQ in SC)
| Industry | F500 HQs | Revenue |
|---|---|---|
| Packaging | 1 | $7B |
|
||
Price history
2 events — show timeline
- 2026-04-29 Pending — Charleston Trident MLS
- 2026-04-17 Listed $130,000 Charleston Trident MLS
Property tax history
+29.1%/yrLatest (2022): $745 · +777.0% YoY. Source: county tax records.
Cash-flow waterfall
monthlySold comps — $/sqft
last 12 mo · ≤1 miLoading sold comps…