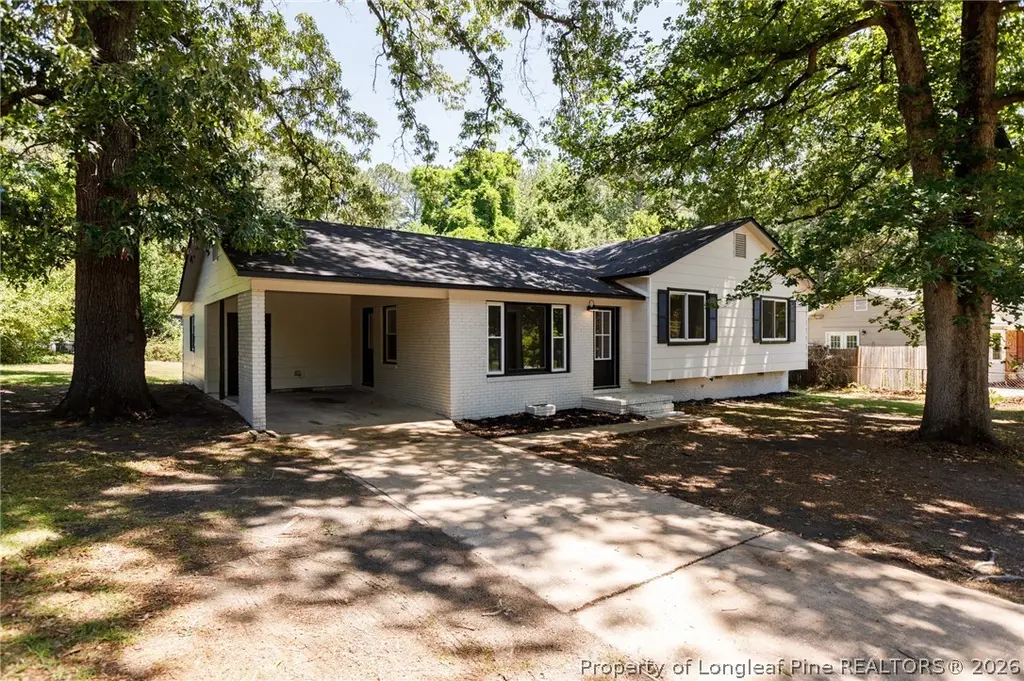
1034 Riverside Cir · Spring Lake, NC
Flood risk 1/10 · Minimal
- FEMA flood zone
- X (unshaded)
- Chance of flooding over 30 yrs
- 0.0%
- Est. flood insurance / yr
- $473 – $860
Fire risk 6/10 · Moderate
- Est. fire insurance / yr
- $906 – $1,684
Heat risk 7/10 · Major
- Hot days now (above 107°F)
- 7 days/yr
- Hot days in 30 yrs
- 16 days/yr
Wind risk 6/10 · Moderate
- Chance of severe wind over 30 yrs
- 65.0%
Air-quality risk 1/10 · Minimal
- Unhealthy air days now
- 0 days/yr
- Unhealthy air days in 30 yrs
- 0 days/yr
Risk factors via First Street. Map © Google.
Why this score? — see what drove the F grade
The composite is a weighted blend of 9 inputs, each scored 0–100. Each bar is that input's sub-score; the figure is the points it added to the 100-point composite (weight × sub-score).
- Cash flow +9.7/30.0
- ARV discount +7.5/15.0
- Rent growth +3.6/5.0
- Schools +3.1/10.0
- Livability +3.0/5.0
- DSCR +2.7/10.0
- Condition / age +2.5/5.0
- 1% rule +2.0/10.0
- Appreciation +0.0/10.0
$210,000
🖨 Deal sheet 📄 Offer letter ✓ Due diligence
Listing remarks
Beautifully updated 4-bedroom home with space for everyone! The kitchen is perfect for entertaining, featuring granite countertops, stainless steel appliances, and a large center island. A spacious bonus room at the back of the home offers the ideal spot for watching sports, hosting friends, or relaxing with family. Enjoy the privacy of a fenced-in backyard, perfect for gatherings, pets, or outdoor fun. All updates were completed in 2026, making this home move-in ready and a must-see!
Key facts
- Large center island
- Spacious bonus room
- Granite countertops
Tags
Property features AI
Exterior
- Parking: Attached carport; 1 covered space; 1 carport space
- Utilities: Public water; Holding tank or septic tank sewer
- Home design: Single-family residence; Residential property
- Construction: Brick veneer and frame construction
- Exterior features: Crawl space foundation; R10 residential zoning; Subdivision: Bragg Estates
Interior
- Kitchen: Dishwasher; Microwave; Range
- Flooring: Carpet; Vinyl
- Bathrooms: 2 full bathrooms
- Heating & cooling: Heat pump
- Interior features: Eat-in kitchen; Kitchen island; Pantry
- Laundry & utility: In-unit laundry
Neighborhood map
What this means for you Summary
Snapshot
- This is a 3-bed/2.0-bath single-family listed at $210k.
Deal economics
- At list price, monthly cash flow is $-139 ($-2k/yr) — negative.
- To cash-flow at today's rent, offer at most $185k (11.7% below list).
- To meet the 1% rule (rent ≥ 1% of price), the offer needs to be $147k (29.8% below list).
- Recommended offer: $147k (29.8% below list) — sets the bar for 1% rule.
- Cap rate 5.5% vs local median 4.5% in Spring Lake — meaningfully above typical; check what's discounted (condition, days-on-market, listing class) to confirm the premium yield is real.
Location & tenants
- Location reads 59/100 on livability (#543 in NC) — a working-class tenant base; expect higher turnover. Strengths: cost of living A+, housing A+; Watch: crime F, amenities F, commute F.
- Cumberland County Schools (urban): math 32% / reading 41% proficiency, ranked #126 of 178 in NC (top 71%) — families likely to look elsewhere, expect single-tenant / working-renter base with shorter leases.
- Zoned schools: Spring Lake Middle (math 15% / reading 31%, grade F, #406 of 475 statewide, top 86%, 512 students, 99% FRL); Pine Forest High (math 73% / reading 51%, grade B-, #184 of 535 statewide, top 37%, 1,572 students, 62% FRL) — zoned schools average 81% FRL vs 55% district-wide (26 pts higher); higher-poverty schools than district average — tighter screening recommended.
- Market conditions: Rents rising fast (+4.5%/yr); 348 active listings in the ZIP; 6 comparable units currently listed for rent nearby; rentals at typical pace (median 24d on market — plan ~3-4 weeks tenant-placement turnaround); 1,125 units permitted in Cumberland County in 2024 (104 in 5+ unit buildings).
Forward outlook
- Local home prices are declining (-3.0%/yr); year-one equity from $1k of loan paydown is wiped out by about $6k of value loss. Plan a longer hold.
Negotiation context
- It's been on market 23 days — a 2% lower offer ($207k) is reasonable based on typical stale-listing flexibility.
- Current owner paid $90k; list at $210k implies a 133% gain — meaningful room to come down on a strong offer.
Risks & watch-outs
- Climate carrying-cost: major wind risk, 65% chance of damaging wind over 30y; major wildfire risk; extreme-heat days projected 7→16/yr by 2055 (HVAC capex compounding) — expect insurance premiums to compound above CPI over the hold.
Questions for the listing agent
- What do current leases actually rent for vs. the listed asking? Can we see a recent rent roll and the last 12 months of T-12 income?
- Built in 1967 — when were the roof, HVAC, electrical panel, plumbing, and water heater last replaced?
- Is there a deadline driving the sale (1031 exchange, divorce, estate, relocation)? That informs how much negotiation room exists.
- Schools are D-rated, which usually means shorter tenancies and higher turnover. Who's the typical renter profile here, and what's been the actual vacancy rate?
- Crime grade is F in this area — have there been break-ins, vandalism, or insurance claims at this property in the last 3 years? What carrier currently insures it and at what premium?
- The area grade is low — what's the realistic commute time and amenity access for the typical tenant pool here? Any planned neighborhood developments (good or bad) we should know about?
- What's the average days-on-market for RENTAL listings here right now (not sales)? A rising rental-DOM trend means longer vacancies and softer asking-rent achievability than the comps imply.
- What's the recent tenant-quality profile in this submarket — average credit score on applications, eviction rate, late-payment / NSF rate, and stable-employment percentage? A property-management company in the area should have these aggregated.
- How much new for-sale + rental construction is in the pipeline within 1–3 miles? Heavy new supply typically softens prices + rents 12–24 months out; constrained supply supports both.
Investment metrics
- 1% rule
- 0.70% ✗
- Cap rate
- 5.50%
- Cash-on-cash
- -2.84%
- DSCR
- 0.87
- GRM
- 11.9
CMA / ARV
No comps found within radius.
Projected returns pro-forma
-3.0% appreciation · 4.49% rent growth · sell at horizon
- IRR
- -19.6%
- Equity multiple
- 0.31×
- Total profit
- $-40,716
- Equity at exit
- $31,312
- IRR
- -9.9%
- Equity multiple
- 0.36×
- Total profit
- $-37,661
- Equity at exit
- $18,157
Cash invested: $58,800 (down + closing). Projections, not guarantees.
Landlord ↔ Tenant lean methodology
- Overall (STATE)
- 85 Strongly Landlord-Friendly
- State North Carolina
- 85 Strongly Landlord-Friendly · R+3
- County
- — inherits STATE
- City
- — inherits STATE
ZIP-level market 28390
- Home prices YoY
- -15.2%
- Rents YoY
- 4.5%
- Active inventory
- 348
- Price-to-rent
- 11.9×
Monthly cashflow live
- Estimated rent
- $1,473 high interval (Pro) →
- Mortgage (P&I)
- −$1,101
- Tax from tax record
- −$114 /mo · $1,371/yr
- Insurance
- −$88
- HOA
- −$0
- Vacancy / Maint / Mgmt
- −$309
- Net cashflow
- $-139
Break-even live
UW: 25.0% down · 7.5% · 30yr · 1.5% tax · 5.0% vac · 8.0% maint · 8.0% mgmt
Financing live
Cash to close
- Down payment
- $52,500
- Closing costs
- $6,300
- Reserves months
- —
- Total cash needed
- —
Loan-product check · same deal, 3 products live
Conventional
25% down · 7.5% · 30yr
- Down + closing
- —
- Monthly P&I
- —
- Monthly cashflow
- —
- DSCR
- —
- Eligible?
- —
Personal DTI + credit; lowest rate.
DSCR
20% down · 8.5% · 30yr
- Down + closing
- —
- Monthly P&I
- —
- Monthly cashflow
- —
- DSCR
- —
- Eligible?
- —
No personal income docs; deal must DSCR.
Hard money
10% down · 12.0% · 12mo
- Down + closing
- —
- Monthly P&I
- —
- Monthly cashflow
- —
- DSCR
- —
- Eligible?
- —
Short-term bridge; refi at stabilization.
Rent comps 6 comps
| Address | Beds | Baths | Sqft | Rent | $/sqft | DOM | Units | Dist |
|---|---|---|---|---|---|---|---|---|
| 415 Vass Rd Spring Lake, NC | 3.0 | 2.0 | 1050 | $1,300 | $1.24 | 23d | 1 | 0.82mi |
| 222-232 W Manchester Rd Unit Manchester Arms Apartments Spring Lake, NC | 2.0 | 1.0 | 1000 | $1,200 | $1.20 | 23d | 1 | 1.17mi |
| 222 W Manchester Rd Unit 222 Spring Lake, NC | 2.0 | 1.0 | 1000 | $1,200 | $1.20 | 23d | 1 | 1.17mi |
| 222 W Manchester Rd Unit 222 Spring Lake, NC | 2.0 | 1.0 | 1000 | $1,200 | $1.20 | 21d | 1 | 1.17mi |
| 157 Maranatha Cir Spring Lake, NC | 3.0 | 2.0 | 1250 | $1,425 | $1.14 | 23d | 1 | 1.21mi |
| 1233 Wilderness Dr Spring Lake, NC | 3.0 | 2.0 | 1852 | $1,700 | $0.92 | 23d | 1 | 1.34mi |
Listing history 11 events
-
2026-06-07status $210,000 Pending 23 DOM
-
2026-06-03days on market $210,000 Active 23 DOM
-
2026-06-02days on market $210,000 Active 22 DOM
-
2026-06-01days on market $210,000 Active 21 DOM
-
2026-05-31days on market $210,000 Active 20 DOM
-
2026-05-30days on market $210,000 Active 19 DOM
-
2026-05-11$210,000 Active
-
2026-01-05soldstatus $90,000
-
1997-07-18soldstatus $71,000
-
1994-01-03soldstatus $62,000
-
1987-07-31soldstatus $49,000
ⓘ Source: listings_history table (triggers on properties + properties_extension) + one-shot
backfill from property_details.listing_events for pre-trigger history.
Tax reassessment forecast NC · Resets to sale price
- Current annual tax
- $1,371 · $114/mo
- Projected year-2 tax
- $1,722 · $144/mo
- Expected delta
- +$351/yr (+$29/mo · 25.6%)
ⓘ Screening estimate from a state-policy table — verify with the county assessor before closing.
Climate risk First Street
- Flood 1/10 Low FEMA zone X (unshaded) · 0% chance over 30 yrs
- Wildfire 6/10 Major
- Heat 7/10 Severe 7 d/yr ≥107°F today · 16 d/yr by 30 yrs out
- Wind 6/10 Major 65% chance of damaging wind over 30 yrs
- Air quality 1/10 Low 0 unhealthy d/yr today · 0 by 30 yrs out
Nearby sold comps map
Loading sold comps map…
Walkable amenities ~0.75 mi
Loading nearby amenities…
Taxation est. · year 1
- Rental income
- $17,679
- − Mortgage interest
- −$11,763
- − Property taxes
- −$1,371
- − Insurance
- −$1,050
- − Repairs & maintenance
- −$1,414
- − Management
- −$1,414
- − Depreciation
- −$6,109
- Taxable loss
- −$5,442
- Est. tax savings @ 24.0%
- +$1,306
- After-tax cash flow
- $-363/yr
For passive investors: Depreciation is non-cash, so a rental often shows a tax loss while cash-flowing — sheltering income. Rental losses are passive: they offset passive income freely, and up to $25,000/yr can offset ordinary (W-2) income if you actively participate and your MAGI is under $100k (phasing out to $0 by $150k); unused losses carry forward. On sale, claimed depreciation is recaptured at up to 25%, and gains may owe capital-gains tax (a 1031 exchange can defer both). Figures are a year-1 estimate at your 24.0% rate — not tax advice; consult a CPA.
Schools (NCES district)
- District
- Cumberland County Schools
- NCES district ID
- 3700011
- Math proficiency
- 32% ▼ -2.00%
- Reading proficiency
- 41% ▼ -1.00%
- Median HH income
- $44,168
- Composite
- 31.0/100
- National rank
- #6096
- State rank
- #126 of 178 in NC
Livability — Spring Lake
- Score
- 59/100
- State rank
- #543
- US rank
- #19811
Category grades
Schools grade is shown separately in the Schools card above.
Census & demographics
- County
- Harnett County · 125,715 people
- City population
- 24,000
- Metro
- Fayetteville, NC
- Population (ZIP)
- 24,000
- Household income
- $62,972
- Rent vs Own
- Severe rent burden
- 811.0
Population outlook (Cumberland County) Hauer SSP2
- Today (2025)
- 330,855 people
- By 2030
- 333,523 · +0.8%
- By 2040
- 335,583 · +1.4%
- By 2050
- 335,325 · +1.4%
- By 2075
- 342,853 · +3.6%
- By 2100
- 340,698 · +3.0%
Race, ethnicity, and origin ACS 2023
- Neighborhood character
- Diverse neighborhood (Simpson 0.70)
- Race & ethnicity
- White 41% Black 33% Hispanic / Latino 14% Two or more races 12% Asian 2% Native American 1%
- Hispanic origin (detail)
- Mexican 6% Puerto Rican 4%
- Common ancestry
- Italian 1% Slovak 1% Romanian 1%
- Foreign-born
- 7% · Canada, South Korea, Jamaica
- Languages at home
- 88% English-only · Spanish 8% German/W. Germanic 1% Korean 1%
Political lean MEDSL · Cumberland
- 2024 margin
- D (+13.4) · D 56.1% · R 42.7% · Other 1.2%
- 2008→2024 swing
- -4.3pp toward R · 2008: 17.7pp · 2024: 13.4pp
- All cycles
- 2024: D+13.4 2020: D+16.6 2016: D+16.0 2012: D+19.7 2008: D+17.7
Not yet ingested
- Civics
- —
Market trends
- HPI YoY
- ▼ -37.43%
- Current HPI
- 207.9349
- Rent YoY
- ▲ 4.49%
- Metro
- Fayetteville, NC
- State GDP YoY
- ▲ 3.28%
- F500 in state
- 26
Industry mix (Fortune 500 HQ in NC)
| Industry | F500 HQs | Revenue |
|---|---|---|
| Financial Services | 2 | $213B |
|
||
| Retail | 2 | $95B |
|
||
| Industrial Conglomerate | 1 | $38B |
|
||
| Metals / Steel | 1 | $35B |
|
||
| Utilities | 1 | $30B |
|
||
| Industrial Machinery | 1 | $19B |
|
||
Price history
+328.6% since first listed5 events — show timeline
- 2026-05-11 Listed $210,000 LPRMLS
- 2026-01-05 Sold (Public Records) $90,000 Public Records
- 1997-07-18 Sold (Public Records) $71,000 Public Records
- 1994-01-03 Sold (Public Records) $62,000 Public Records
- 1987-07-31 Sold (Public Records) $49,000 Public Records
Property tax history
+4.6%/yrLatest (2025): $1,371 · +55.9% YoY. Source: county tax records.
Cash-flow waterfall
monthlySold comps — $/sqft
last 12 mo · ≤1 miLoading sold comps…