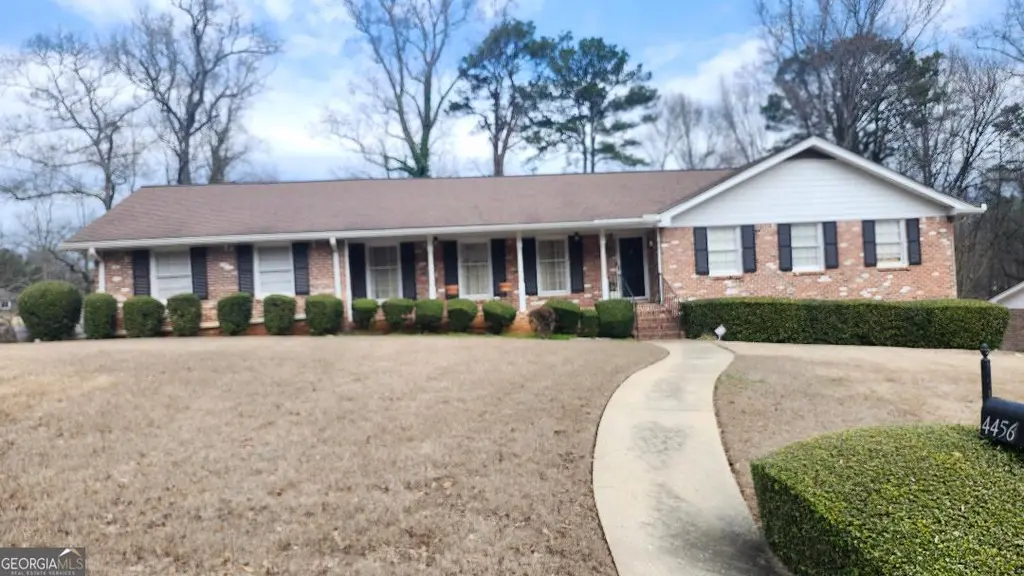
4456 Luxembourg Dr SW · Stonecrest, GA
Flood risk 1/10 · Minimal
- FEMA flood zone
- X (unshaded)
- Chance of flooding over 30 yrs
- 0.0%
- Est. flood insurance / yr
- $473 – $860
Fire risk 1/10 · Minimal
- Est. fire insurance / yr
- $963 – $1,789
Heat risk 6/10 · Moderate
- Hot days now (above 106°F)
- 7 days/yr
- Hot days in 30 yrs
- 18 days/yr
Wind risk 5/10 · Moderate
- Chance of severe wind over 30 yrs
- 26.0%
Air-quality risk 5/10 · Moderate
- Unhealthy air days now
- 7 days/yr
- Unhealthy air days in 30 yrs
- 10 days/yr
Risk factors via First Street. Map © Google.
Why this score? — see what drove the D grade
The composite is a weighted blend of 9 inputs, each scored 0–100. Each bar is that input's sub-score; the figure is the points it added to the 100-point composite (weight × sub-score).
- Cash flow +17.5/30.0
- ARV discount +6.3/15.0
- DSCR +5.5/10.0
- 1% rule +4.3/10.0
- Rent growth +3.0/5.0
- Livability +2.5/5.0
- Condition / age +2.5/5.0
- Schools +2.1/10.0
- Appreciation +0.0/10.0
$390,000
🖨 Deal sheet (PDF) 📄 Offer letter ✓ Due diligence
Listing remarks MLS
A must see! Sought after spacious, full brick ranch on full finished basement, corner lot at end of street and well maintained. Boasting 3 bedrooms on main, one in basement with a full bath. Great entertainment floor plan. Updated kitchen and baths, hardwood and tiled flooring, private patio of from family room, two car garage. Don't hesitate on this one call for an appoint to preview.
Key facts
- Full brick ranch
- Well maintained
- Corner lot
Tags
Neighborhood map
What this means for you Summary
Snapshot
- This is a 4-bed/3.0-bath single-family listed at $390k.
Deal economics
- At list price, monthly cash flow is $302 ($4k/yr) — positive.
- The deal already cash-flows at list — no discount required.
- To meet the 1% rule (rent ≥ 1% of price), the offer needs to be $362k (7.3% below list).
- Recommended offer: $362k (7.3% below list) — sets the bar for 1% rule.
- Cap rate 7.2% vs local median 5.1% in Stonecrest — top-decile yield for the area; either an underpriced asset or a hidden risk that comps aren't pricing in. Stress-test before assuming the spread holds.
Location & tenants
- Location reads: area grade D — affects rentability + tenant quality, not the cash-flow math above.
- Dekalb County (suburban): math 19% / reading 28% proficiency, ranked #125 of 174 in GA (top 72%) — low school quality limits family demand, transient renter base, plan for 1-2y turnover; 68% free/reduced lunch — lower-income household profile, screen leases tightly.
- Zoned schools: Browns Mill Elementary School (math 5% / reading 24%, grade F, #988 of 1,228 statewide, top 81%, 383 students, 100% FRL); Chapel Hill Middle School (math 12% / reading 27%, grade F, #356 of 470 statewide, top 78%, 692 students, 100% FRL); Southwest Dekalb High School (math 17% / reading 37%, grade F, #162 of 424 statewide, top 40%, 1,307 students, 100% FRL) — zoned schools average 100% FRL vs 68% district-wide (32 pts higher); higher-poverty schools than district average — tighter screening recommended.
- Market conditions: Rents rising (+2.2%/yr); 356 active listings in the ZIP; 2 comparable units currently listed for rent nearby; 1,240 units permitted in DeKalb County in 2024 (385 in 5+ unit buildings).
- At $3,615/mo this rent would consume 68% of the median local household income ($64k/yr) (locally 1659% of renters already pay >50% of income on rent) — very limited rent-growth headroom before tenants either downsize or default.
Forward outlook
- Local home prices are declining (-3.0%/yr); year-one equity from $3k of loan paydown is wiped out by about $12k of value loss. Plan a longer hold.
- DeKalb County population projected at +28% by 2050 — long-run rental-demand tailwind backs the buy-and-hold thesis.
Negotiation context
- It's been on market 86 days — a 6% lower offer ($367k) is reasonable based on typical stale-listing flexibility.
Risks & watch-outs
- Climate carrying-cost: moderate wind risk, 26% chance of damaging wind over 30y; extreme-heat days projected 7→18/yr by 2055 (HVAC capex compounding) — expect insurance premiums to compound above CPI over the hold.
Questions for the listing agent
- It's been on market 86 days. Have you received any prior offers? Is the seller open to a 7% concession, seller financing, or rate buy-down credit?
- Built in 1970 — when were the roof, HVAC, electrical panel, plumbing, and water heater last replaced?
- Why hasn't it sold? Are there any deal-killer items the seller is aware of (foundation, flood, title, zoning, code violations)?
- Is there a deadline driving the sale (1031 exchange, divorce, estate, relocation)? That informs how much negotiation room exists.
- The area grade is low — what's the realistic commute time and amenity access for the typical tenant pool here? Any planned neighborhood developments (good or bad) we should know about?
- What's the average days-on-market for RENTAL listings here right now (not sales)? A rising rental-DOM trend means longer vacancies and softer asking-rent achievability than the comps imply.
- What's the recent tenant-quality profile in this submarket — average credit score on applications, eviction rate, late-payment / NSF rate, and stable-employment percentage? A property-management company in the area should have these aggregated.
- How much new for-sale + rental construction is in the pipeline within 1–3 miles? Heavy new supply typically softens prices + rents 12–24 months out; constrained supply supports both.
Investment metrics
- 1% rule
- 0.93% ✗
- Cap rate
- 7.22%
- Cash-on-cash
- 3.32%
- DSCR
- 1.15
- GRM
- 9.0
CMA / ARV
- ARV (median comp)
- $379,848
- List price
- $390,000
- Delta
- 2.67%
- Verdict
- FAIR
- Comps
- 20 within 1.0 mi
Show comp detail 3 sales within ~0.75 mi
| Address | Dist | Beds/Ba | Sqft | Sold | Price | $/sf | Match |
|---|---|---|---|---|---|---|---|
| 3132 Riders Trl | 0.40mi | 5/3.0 (+1) | 3,197 (-14%) | 8mo | $384,000 | $120 | 46 |
| 4671 Jakes Trl | 0.73mi | 4/2.5 | 3,296 (-11%) | 5mo | $240,000 | $73 | 41 |
| 3361 Hollow Tree Dr | 0.45mi | 5/2.5 (+1) | 3,382 (-9%) | 22mo | $274,500 | $81 | 38 |
Match score weights: distance 35% · size 25% · config 20% · recency 20%. Top-matched comps best support the ARV.
Projected returns pro-forma
-3.0% appreciation · 2.18% rent growth · sell at horizon
- IRR
- -12.0%
- Equity multiple
- 0.57×
- Total profit
- $-46,954
- Equity at exit
- $58,150
- IRR
- -4.0%
- Equity multiple
- 0.74×
- Total profit
- $-28,193
- Equity at exit
- $33,720
Cash invested: $109,200 (down + closing). Projections, not guarantees.
Landlord ↔ Tenant lean methodology
- Overall (STATE)
- 90 Strongly Landlord-Friendly
- State Georgia
- 90 Strongly Landlord-Friendly · R+3
- County
- — inherits STATE
- City
- — inherits STATE
ZIP-level market 30034
- Home prices YoY
- -27.4%
- Rents YoY
- 2.2%
- Active inventory
- 356
- Price-to-rent
- 9.0×
Monthly cashflow live
- Estimated rent
- $3,615 medium interval (Pro) →
- Mortgage (P&I)
- −$2,045
- Tax from tax record
- −$346 /mo · $4,156/yr
- Insurance
- −$162
- HOA
- −$0
- Vacancy / Maint / Mgmt
- −$759
- Net cashflow
- $302
Break-even live
Sensitivity live
| Price | -10% $523 | -5% $412 | +0% $302 | +5% $192 | +10% $81 |
|---|---|---|---|---|---|
| Rent | -10% $16 | -5% $159 | +0% $302 | +5% $445 | +10% $588 |
| Rate | -1.0pp $498 | -0.5pp $401 | base $302 | +0.5pp $201 | +1.0pp $98 |
UW: 25.0% down · 7.5% · 30yr · 1.5% tax · 5.0% vac · 8.0% maint · 8.0% mgmt
Financing live
Cash to close
- Down payment
- $97,500
- Closing costs
- $11,700
- Reserves months
- —
- Total cash needed
- —
Loan-product check · same deal, 3 products live
Conventional
25% down · 7.5% · 30yr
- Down + closing
- —
- Monthly P&I
- —
- Monthly cashflow
- —
- DSCR
- —
- Eligible?
- —
Personal DTI + credit; lowest rate.
DSCR
20% down · 8.5% · 30yr
- Down + closing
- —
- Monthly P&I
- —
- Monthly cashflow
- —
- DSCR
- —
- Eligible?
- —
No personal income docs; deal must DSCR.
Hard money
10% down · 12.0% · 12mo
- Down + closing
- —
- Monthly P&I
- —
- Monthly cashflow
- —
- DSCR
- —
- Eligible?
- —
Short-term bridge; refi at stabilization.
Rent comps 2 comps
| Address | Beds | Baths | Sqft | Rent | $/sqft | DOM | Units | Dist |
|---|---|---|---|---|---|---|---|---|
| 3170 Sherwood Oaks Ct Decatur, GA | 4.0 | 2.5 | 2987 | $3,200 | $1.07 | 1d | 1 | 0.57mi |
| 2884 Thompson Cir Decatur, GA | 4.0 | 3.5 | 2868 | $6,400 | $2.23 | 26d | 1 | 0.70mi |
Listing history 15 events
-
2026-06-21days on market $390,000 Active 86 DOM
-
2026-06-18days on market $390,000 Active 83 DOM
-
2026-06-17days on market $390,000 Active 82 DOM
-
2026-06-16days on market $390,000 Active 81 DOM
-
2026-06-15days on market $390,000 Active 80 DOM
-
2026-06-13days on market $390,000 Active 78 DOM
-
2026-06-09days on market $390,000 Active 74 DOM
-
2026-06-08days on market $390,000 Active 73 DOM
-
2026-06-07days on market $390,000 Active 72 DOM
-
2026-06-04days on market $390,000 Active 69 DOM
-
2026-06-03days on market $390,000 Active 68 DOM
-
2026-06-02days on market $390,000 Active 67 DOM
-
2026-06-01days on market $390,000 Active 66 DOM
-
2026-05-31days on market $390,000 Active 65 DOM
-
2026-03-25$390,000 New 388-char remark
Show marketing remark (388 chars)
A must see! Sought after spacious, full brick ranch on full finished basement, corner lot at end of street and well maintained. Boasting 3 bedrooms on main, one in basement with a full bath. Great entertainment floor plan. Updated kitchen and baths, hardwood and tiled flooring, private patio of from family room, two car garage. Don't hesitate on this one call for an appoint to preview.
ⓘ Source: listings_history table (triggers on properties + properties_extension) + one-shot
backfill from property_details.listing_events for pre-trigger history.
Tax reassessment forecast GA · Resets to sale price
- Current annual tax
- $4,156 · $346/mo
- Projected year-2 tax
- $4,156 · $346/mo
- Expected delta
- $0/yr ($0/mo · 0.0%)
ⓘ Screening estimate from a state-policy table — verify with the county assessor before closing.
Climate risk First Street
- Flood 1/10 Low FEMA zone X (unshaded) · 0% chance over 30 yrs
- Wildfire 1/10 Low
- Heat 6/10 Major 7 d/yr ≥106°F today · 18 d/yr by 30 yrs out
- Wind 5/10 Major 26% chance of damaging wind over 30 yrs
- Air quality 5/10 Major 7 unhealthy d/yr today · 10 by 30 yrs out
Nearby sold comps map
Loading sold comps map…
Walkable amenities ~0.75 mi
Loading nearby amenities…
Taxation est. · year 1
- Rental income
- $43,383
- − Mortgage interest
- −$21,846
- − Property taxes
- −$4,156
- − Insurance
- −$1,950
- − Repairs & maintenance
- −$3,471
- − Management
- −$3,471
- − Depreciation
- −$11,345
- Taxable loss
- −$2,856
- Est. tax savings @ 24.0%
- +$685
- After-tax cash flow
- $4,309/yr
For passive investors: Depreciation is non-cash, so a rental often shows a tax loss while cash-flowing — sheltering income. Rental losses are passive: they offset passive income freely, and up to $25,000/yr can offset ordinary (W-2) income if you actively participate and your MAGI is under $100k (phasing out to $0 by $150k); unused losses carry forward. On sale, claimed depreciation is recaptured at up to 25%, and gains may owe capital-gains tax (a 1031 exchange can defer both). Figures are a year-1 estimate at your 24.0% rate — not tax advice; consult a CPA.
Schools (NCES district)
- District
- Dekalb County
- NCES district ID
- 1301740
- Math proficiency
- 19% ▼ -12.00%
- Reading proficiency
- 28% ▼ -7.00%
- Median HH income
- $51,448
- Composite
- 20.92/100
- National rank
- #8482
- State rank
- #125 of 174 in GA
Livability — Stonecrest
No livability data for this city. (Only ~50 U.S. cities are tracked.)
Census & demographics
- County
- Dekalb County · 782,738 people
- City population
- 106,165
- Metro
- Atlanta-Sandy Springs-Alpharetta, GA
- Population (ZIP)
- 41,847
- Household income
- $63,517
- Rent vs Own
- Severe rent burden
- 1659.0
Population outlook (DeKalb County) Hauer SSP2
- Today (2025)
- 839,977 people
- By 2030
- 891,768 · +6.2%
- By 2040
- 988,894 · +17.7%
- By 2050
- 1,074,583 · +27.9%
- By 2075
- 1,245,026 · +48.2%
- By 2100
- 1,303,135 · +55.1%
Race, ethnicity, and origin ACS 2023
- Neighborhood character
- Predominantly Black (90%)
- Race & ethnicity
- Black 90% White 4% Two or more races 3% Hispanic / Latino 2%
- Common ancestry
- Hispanic 1% Lithuanian 1%
- Foreign-born
- 8% · Canada
- Languages at home
- 93% English-only · Spanish 2% French/Haitian/Cajun 1%
Political lean MEDSL · DeKalb
- 2024 margin
- Solid D (+64.8) · D 81.9% · R 17.1% · Other 1.0%
- 2008→2024 swing
- +6.1pp toward D · 2008: 58.6pp · 2024: 64.8pp
- All cycles
- 2024: D+64.8 2020: D+67.4 2016: D+64.8 2012: D+56.8 2008: D+58.6
Not yet ingested
- Civics
- —
Market trends
- HPI YoY
- ▼ -78.92%
- Current HPI
- 209.5638
- Rent YoY
- ▲ 2.18%
- Metro
- Atlanta-Sandy Springs-Alpharetta, GA
- State GDP YoY
- ▲ 2.66%
- F500 in state
- 28
Industry mix (Fortune 500 HQ in GA)
| Industry | F500 HQs | Revenue |
|---|---|---|
| Paper / Packaging | 2 | $29B |
|
||
| Retail | 1 | $160B |
|
||
| Transportation / Logistics | 1 | $91B |
|
||
| Airlines | 1 | $62B |
|
||
| Consumer Goods | 1 | $47B |
|
||
| Utilities | 1 | $25B |
|
||
Price history
1 event — show timeline
- 2026-03-25 Listed $390,000 GAMLS
Property tax history
+3.5%/yrLatest (2025): $4,156 · +1.0% YoY. Source: county tax records.
Cash-flow waterfall
monthlySold comps — $/sqft
last 12 mo · ≤1 miLoading sold comps…