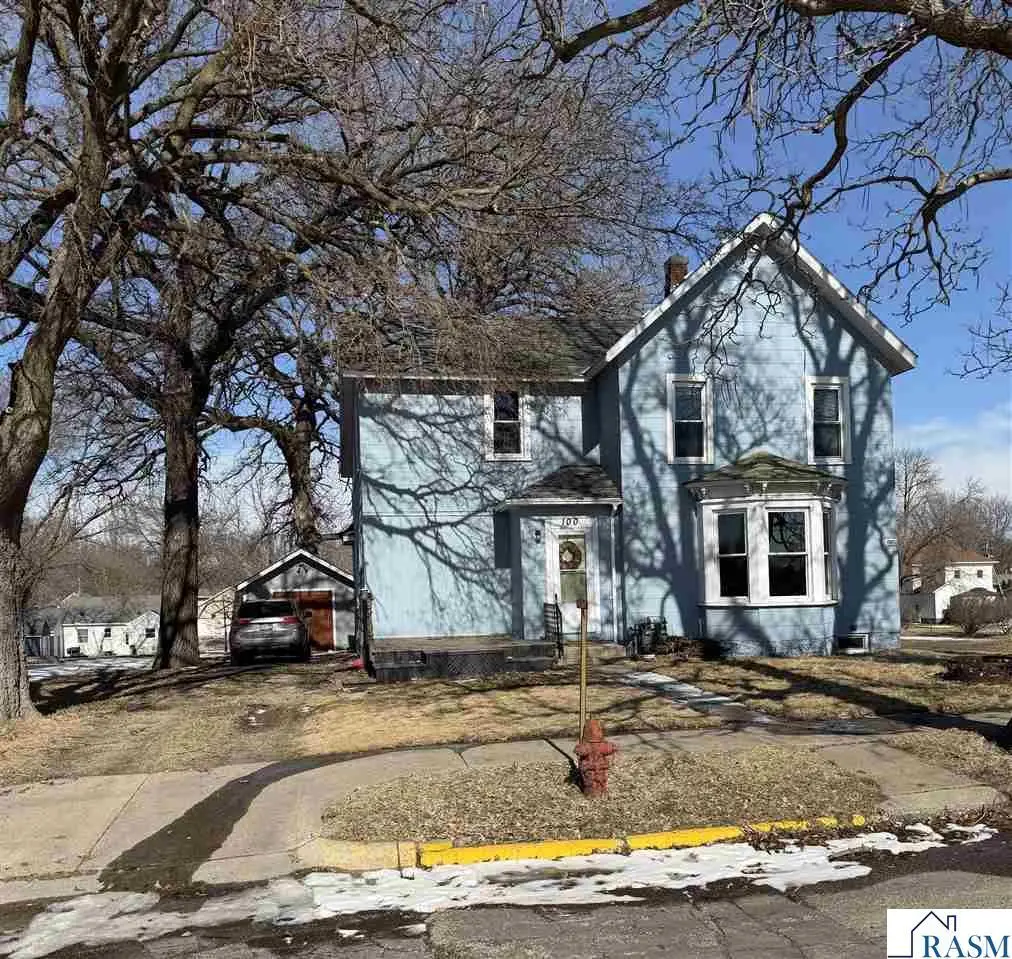
100 NW Greenback St · Sleepy Eye, MN
Flood risk 1/10 · Minimal
- FEMA flood zone
- X (unshaded)
- Chance of flooding over 30 yrs
- 0.0%
- Est. flood insurance / yr
- $473 – $860
Fire risk 1/10 · Minimal
- Est. fire insurance / yr
- $888 – $1,650
Heat risk 2/10 · Minimal
- Hot days now (above 99°F)
- 7 days/yr
- Hot days in 30 yrs
- 15 days/yr
Wind risk 2/10 · Minimal
- Chance of severe wind over 30 yrs
- —
Air-quality risk 1/10 · Minimal
- Unhealthy air days now
- 0 days/yr
- Unhealthy air days in 30 yrs
- 0 days/yr
Risk factors via First Street. Map © Google.
Why this score? — see what drove the C+ grade
The composite is a weighted blend of 9 inputs, each scored 0–100. Each bar is that input's sub-score; the figure is the points it added to the 100-point composite (weight × sub-score).
- Cash flow +19.0/30.0
- Appreciation +10.0/10.0
- ARV discount +7.5/15.0
- DSCR +6.0/10.0
- Schools +4.8/10.0
- 1% rule +4.2/10.0
- Livability +4.0/5.0
- Rent growth +2.5/5.0
- Condition / age +2.5/5.0
$134,900
🖨 Deal sheet 📄 Offer letter ✓ Due diligence
Listing remarks MLS
This 4 bedroom, 2 bath home is currently being used as a duplex but could be turned back into a single family home with two bedrooms and a full bath upstairs and two bedrooms and a full bathroom on the main floor. All the utilities are separated, so, if two bedrooms are enough, you could have someone helping to pay your mortgage until you need the extra space. There are three sheds behind the home that are included in the sale. The one at the end of the driveway has electricity also.
Key facts
- 7,841 sq ft lot
- Built 1898
- Listed 111 days
Neighborhood map
What this means for you Summary
Snapshot
- This is a 4-bed/2.0-bath single-family listed at $135k.
Deal economics
- At list price, monthly cash flow is $142 ($2k/yr) — positive.
- The deal already cash-flows at list — no discount required.
- To meet the 1% rule (rent ≥ 1% of price), the offer needs to be $124k (8.3% below list).
- Recommended offer: $123k (9.0% below list) — sets the bar for market timing.
Location & tenants
- Location reads 79/100 on livability (#91 in MN, #2,057 nationally) — a middle-class / working-renter tenant base. Strengths: crime A+, cost of living A+, housing A+; Watch: amenities D-, commute F.
- Sleepy Eye Public School District (town): math 51% / reading 58% proficiency, ranked #232 of 467 in MN (top 50%) — acceptable for families but not a draw, mixed tenant base, ~2y average lease.
- Market conditions: 17 active listings in the ZIP; 41 units permitted in Brown County in 2024 (18 in 5+ unit buildings).
Forward outlook
- In year one you build about $14k of equity ($933 loan paydown + $13k appreciation (10.0% local appreciation)).
- Brown County population projected at -14% by 2050 — secular population decline; favor cash flow + early exit over multi-decade hold.
- At projected returns (10.0% appreciation + 3.0% rent growth), your $38k cash investment doubles in ~3 years — after that, you're playing with house money.
- By year 3, paydown + projected appreciation supports a ~$37k cash-out refi (75% LTV) — recoverable capital for the next deal without selling this one.
Negotiation context
- It's been on market 112 days — a 9% lower offer ($123k) is reasonable based on typical stale-listing flexibility.
- 5 sale attempts since 4y ago with the ask held roughly flat each time — persistent listings suggest the price (not the market) is what's stuck; bring a comps-based counter.
- Current owner paid $58k; list at $135k implies a 133% gain — meaningful room to come down on a strong offer.
Risks & watch-outs
- Watch-outs: built in 1898 — expect roof / HVAC / electrical / plumbing capex.
Questions for the listing agent
- It's been on market 112 days. Have you received any prior offers? Is the seller open to a 9% concession, seller financing, or rate buy-down credit?
- Built in 1898 — when were the roof, HVAC, electrical panel, plumbing, and water heater last replaced?
- Why hasn't it sold? Are there any deal-killer items the seller is aware of (foundation, flood, title, zoning, code violations)?
- Is there a deadline driving the sale (1031 exchange, divorce, estate, relocation)? That informs how much negotiation room exists.
- Schools are B-rated — typically a magnet for longer-tenancy family renters. What's the average tenant stay here, and is there a school-zone premium baked into asking?
- What's the average days-on-market for RENTAL listings here right now (not sales)? A rising rental-DOM trend means longer vacancies and softer asking-rent achievability than the comps imply.
- What's the recent tenant-quality profile in this submarket — average credit score on applications, eviction rate, late-payment / NSF rate, and stable-employment percentage? A property-management company in the area should have these aggregated.
- How much new for-sale + rental construction is in the pipeline within 1–3 miles? Heavy new supply typically softens prices + rents 12–24 months out; constrained supply supports both.
Investment metrics
- 1% rule
- 0.92% ✗
- Cap rate
- 7.55%
- Cash-on-cash
- 4.50%
- DSCR
- 1.20
- GRM
- 9.1
CMA / ARV
- ARV (median comp)
- $89,321
- List price
- $134,900
- Delta
- 51.03%
- Verdict
- OVERPRICED
- Comps
- 2 within 1.0 mi
Show comp detail 11 sales within ~0.75 mi
| Address | Dist | Beds/Ba | Sqft | Sold | Price | $/sf | Match |
|---|---|---|---|---|---|---|---|
| 312 Elm Street St NW | 0.15mi | 3/2.0 (-1) | 1,776 (+1%) | 22mo | $184,000 | $104 | 69 |
| 318 SW Maple St | 0.22mi | 3/1.0 (-1) | 1,728 (-2%) | 16mo | $92,500 | $54 | 64 |
| 305 NE Elm St | 0.34mi | 4/2.0 | 1,604 (-9%) | 9mo | $127,750 | $80 | 62 |
| 633 NE 2nd Ave | 0.40mi | 4/3.0 | 1,764 (+0%) | 24mo | $187,200 | $106 | 57 |
| 532 N First Ave | 0.26mi | 3/1.0 (-1) | 1,640 (-7%) | 14mo | $75,000 | $46 | 55 |
| 105 S Shore Dr Dr | 0.32mi | 3/2.0 (-1) | 1,636 (-7%) | 20mo | $222,000 | $136 | 51 |
| 629 NE 3rd Ave | 0.49mi | 3/2.0 (-1) | 1,580 (-10%) | 13mo | $185,000 | $117 | 44 |
| 113 SE Burnside St | 0.57mi | 3/1.5 (-1) | 1,564 (-11%) | 10mo | $120,000 | $77 | 39 |
| 105 SW Southdale St | 0.75mi | 3/2.0 (-1) | 1,650 (-6%) | 14mo | $160,000 | $97 | 38 |
| 220 SE Summit | 0.51mi | 3/1.5 (-1) | 1,919 (+9%) | 23mo | $175,000 | $91 | 35 |
| 400 Burnside Street St SE | 0.63mi | 3/2.0 (-1) | 1,983 (+12%) | 20mo | $180,000 | $91 | 28 |
Match score weights: distance 35% · size 25% · config 20% · recency 20%. Top-matched comps best support the ARV.
Projected returns pro-forma
10.0% appreciation · 3.0% rent growth · sell at horizon
- IRR
- 27.5%
- Equity multiple
- 3.18×
- Total profit
- $82,450
- Equity at exit
- $121,529
- IRR
- 24.0%
- Equity multiple
- 7.24×
- Total profit
- $235,627
- Equity at exit
- $262,081
Cash invested: $37,772 (down + closing). Projections, not guarantees.
Landlord ↔ Tenant lean methodology
- Overall (STATE)
- 46 Balanced
- State Minnesota
- 46 Balanced · D+2
- County
- — inherits STATE
- City
- — inherits STATE
ZIP-level market 56085
- Home prices YoY
- 30.3%
- Active inventory
- 17
- Price-to-rent
- 9.1×
Monthly cashflow live
- Estimated rent
- $1,237 medium interval (Pro) →
- Mortgage (P&I)
- −$707
- Tax from tax record
- −$72 /mo · $860/yr
- Insurance
- −$56
- HOA
- −$0
- Vacancy / Maint / Mgmt
- −$260
- Net cashflow
- $142
Break-even live
UW: 25.0% down · 7.5% · 30yr · 1.5% tax · 5.0% vac · 8.0% maint · 8.0% mgmt
Financing live
Cash to close
- Down payment
- $33,725
- Closing costs
- $4,047
- Reserves months
- —
- Total cash needed
- —
Loan-product check · same deal, 3 products live
Conventional
25% down · 7.5% · 30yr
- Down + closing
- —
- Monthly P&I
- —
- Monthly cashflow
- —
- DSCR
- —
- Eligible?
- —
Personal DTI + credit; lowest rate.
DSCR
20% down · 8.5% · 30yr
- Down + closing
- —
- Monthly P&I
- —
- Monthly cashflow
- —
- DSCR
- —
- Eligible?
- —
No personal income docs; deal must DSCR.
Hard money
10% down · 12.0% · 12mo
- Down + closing
- —
- Monthly P&I
- —
- Monthly cashflow
- —
- DSCR
- —
- Eligible?
- —
Short-term bridge; refi at stabilization.
Listing history 28 events
-
2026-06-18days on market $134,900 Active 112 DOM
-
2026-06-17days on market $134,900 Active 111 DOM
-
2026-06-16days on market $134,900 Active 110 DOM
-
2026-06-15days on market $134,900 Active 109 DOM
-
2026-06-13days on market $134,900 Active 107 DOM
-
2026-06-12days on market $134,900 Active 106 DOM
-
2026-06-09days on market $134,900 Active 103 DOM
-
2026-06-08days on market $134,900 Active 102 DOM
-
2026-06-07days on market $134,900 Active 101 DOM
-
2026-06-07days on market $134,900 Active 100 DOM
-
2026-06-04days on market $134,900 Active 97 DOM
-
2026-06-02days on market $134,900 Active 96 DOM
-
2026-06-01days on market $134,900 Active 95 DOM
-
2026-05-31days on market $134,900 Active 94 DOM
-
2026-05-31days on market $134,900 Active 93 DOM
-
2026-03-23price $134,900 488-char remark
Show marketing remark (398 chars)
This 4 bedroom, 2 bath home is currently being used as a duplex but could be turned back into a single family home with two bedrooms and a full bath upstairs and two bedrooms and a full bathroom on the main floor. There is currently a renter on the main floor paying $700 per month. So, if two bedrooms are enough, you could have someone helping to pay your mortgage until you need the extra space.
-
2026-03-23price $134,900 398-char remark
Show marketing remark (398 chars)
This 4 bedroom, 2 bath home is currently being used as a duplex but could be turned back into a single family home with two bedrooms and a full bath upstairs and two bedrooms and a full bathroom on the main floor. There is currently a renter on the main floor paying $700 per month. So, if two bedrooms are enough, you could have someone helping to pay your mortgage until you need the extra space.
-
2026-02-26$139,900 Active 488-char remark
Show marketing remark (398 chars)
This 4 bedroom, 2 bath home is currently being used as a duplex but could be turned back into a single family home with two bedrooms and a full bath upstairs and two bedrooms and a full bathroom on the main floor. There is currently a renter on the main floor paying $700 per month. So, if two bedrooms are enough, you could have someone helping to pay your mortgage until you need the extra space.
-
2026-02-26$139,900 Active 398-char remark
Show marketing remark (398 chars)
This 4 bedroom, 2 bath home is currently being used as a duplex but could be turned back into a single family home with two bedrooms and a full bath upstairs and two bedrooms and a full bathroom on the main floor. There is currently a renter on the main floor paying $700 per month. So, if two bedrooms are enough, you could have someone helping to pay your mortgage until you need the extra space.
-
2025-08-31historical
-
2025-06-09status Active
-
2025-06-02historical Contingent - Inspection
-
2025-05-19$139,900 Active
-
2022-05-20soldstatus $58,000
-
2022-04-20$44,900
-
2002-11-25soldstatus $26,000
-
1995-07-01soldstatus $23,000
-
1990-08-21soldstatus $18,000
ⓘ Source: listings_history table (triggers on properties + properties_extension) + one-shot
backfill from property_details.listing_events for pre-trigger history.
Tax reassessment forecast MN · Partial reset (capped growth)
- Current annual tax
- $860 · $72/mo
- Projected year-2 tax
- $1,185 · $99/mo
- Expected delta
- +$325/yr (+$27/mo · 37.8%)
ⓘ Screening estimate from a state-policy table — verify with the county assessor before closing.
Climate risk First Street
- Flood 1/10 Low FEMA zone X (unshaded) · 0% chance over 30 yrs
- Wildfire 1/10 Low
- Heat 2/10 Low 7 d/yr ≥99°F today · 15 d/yr by 30 yrs out
- Wind 2/10 Low
- Air quality 1/10 Low 0 unhealthy d/yr today · 0 by 30 yrs out
Nearby sold comps map
Loading sold comps map…
Walkable amenities ~0.75 mi
Loading nearby amenities…
Taxation est. · year 1
- Rental income
- $14,840
- − Mortgage interest
- −$7,556
- − Property taxes
- −$860
- − Insurance
- −$674
- − Repairs & maintenance
- −$1,187
- − Management
- −$1,187
- − Depreciation
- −$3,924
- Taxable loss
- −$550
- Est. tax savings @ 24.0%
- +$132
- After-tax cash flow
- $1,832/yr
For passive investors: Depreciation is non-cash, so a rental often shows a tax loss while cash-flowing — sheltering income. Rental losses are passive: they offset passive income freely, and up to $25,000/yr can offset ordinary (W-2) income if you actively participate and your MAGI is under $100k (phasing out to $0 by $150k); unused losses carry forward. On sale, claimed depreciation is recaptured at up to 25%, and gains may owe capital-gains tax (a 1031 exchange can defer both). Figures are a year-1 estimate at your 24.0% rate — not tax advice; consult a CPA.
Schools (NCES district)
- District
- Sleepy Eye Public School District
- NCES district ID
- 2733210
- Math proficiency
- 51% ▼ -5.00%
- Reading proficiency
- 58% ▬ 0.00%
- Median HH income
- $51,329
- Composite
- 48.46/100
- National rank
- #4643
- State rank
- #232 of 467 in MN
Livability — Sleepy Eye
- Score
- 79/100
- State rank
- #91
- US rank
- #2057
Category grades
Schools grade is shown separately in the Schools card above.
Census & demographics
- Census place
- Sleepy Eye, MN
- City population
- 5,013
- Population (ZIP)
- 5,013
Population outlook (Brown County) Hauer SSP2
- Today (2025)
- 24,403 people
- By 2030
- 23,790 · -2.5%
- By 2040
- 22,309 · -8.6%
- By 2050
- 20,948 · -14.2%
- By 2075
- 19,038 · -22.0%
- By 2100
- 16,658 · -31.7%
Race, ethnicity, and origin ACS 2023
- Neighborhood character
- Predominantly White (88%)
- Race & ethnicity
- White 88% Hispanic / Latino 10% Two or more races 6%
- Hispanic origin (detail)
- Mexican 9%
- Common ancestry
- Portuguese 10% Italian 2% Lithuanian 1%
- Foreign-born
- 6% · Canada
- Languages at home
- 90% English-only · Spanish 8% German/W. Germanic 1% Other Indo-European 1%
Political lean MEDSL · Brown
- 2024 margin
- Solid R (+35.2) · D 31.5% · R 66.7% · Other 1.8%
- 2008→2024 swing
- -23.1pp toward R · 2008: -12.1pp · 2024: -35.2pp
- All cycles
- 2024: R+35.2 2020: R+32.8 2016: R+36.2 2012: R+16.6 2008: R+12.1
Not yet ingested
- Civics
- —
Market trends
- HPI YoY
- ▲ 56.76%
- Current HPI
- 244.1
- Rent YoY
- —
- Metro
- —
- State GDP YoY
- ▲ 2.41%
- F500 in state
- 34
Industry mix (Fortune 500 HQ in MN)
| Industry | F500 HQs | Revenue |
|---|---|---|
| Healthcare | 2 | $407B |
|
||
| Retail | 2 | $150B |
|
||
| Consumer Goods | 2 | $32B |
|
||
| Industrial Machinery | 2 | $6B |
|
||
| Agriculture | 1 | $40B |
|
||
| Healthcare / Medical Devices | 1 | $32B |
|
||
Price history
+649.4% since first listed13 events — show timeline
- 2026-03-23 Price Changed $134,900 RASM
- 2026-03-23 Price Changed $134,900 NORTHSTARMLS as Distributed by MLS Grid
- 2026-02-26 Listed $139,900 NORTHSTARMLS as Distributed by MLS Grid
- 2026-02-26 Listed $139,900 RASM
- 2025-08-31 Listing Removed — NORTHSTARMLS as Distributed by MLS Grid
- 2025-06-09 Relisted — NORTHSTARMLS as Distributed by MLS Grid
- 2025-06-02 Contingent — NORTHSTARMLS as Distributed by MLS Grid
- 2025-05-19 Listed $139,900 NORTHSTARMLS as Distributed by MLS Grid
- 2022-05-20 Sold (MLS) $58,000 RASM
- 2022-04-20 Listed $44,900 RASM
- 2002-11-25 Sold (Public Records) $26,000 Public Records
- 1995-07-01 Sold (Public Records) $23,000 Public Records
- 1990-08-21 Sold (Public Records) $18,000 Public Records
Property tax history
+8.5%/yrLatest (2025): $860 · +0.7% YoY. Source: county tax records.
Cash-flow waterfall
monthlySold comps — $/sqft
last 12 mo · ≤1 miLoading sold comps…