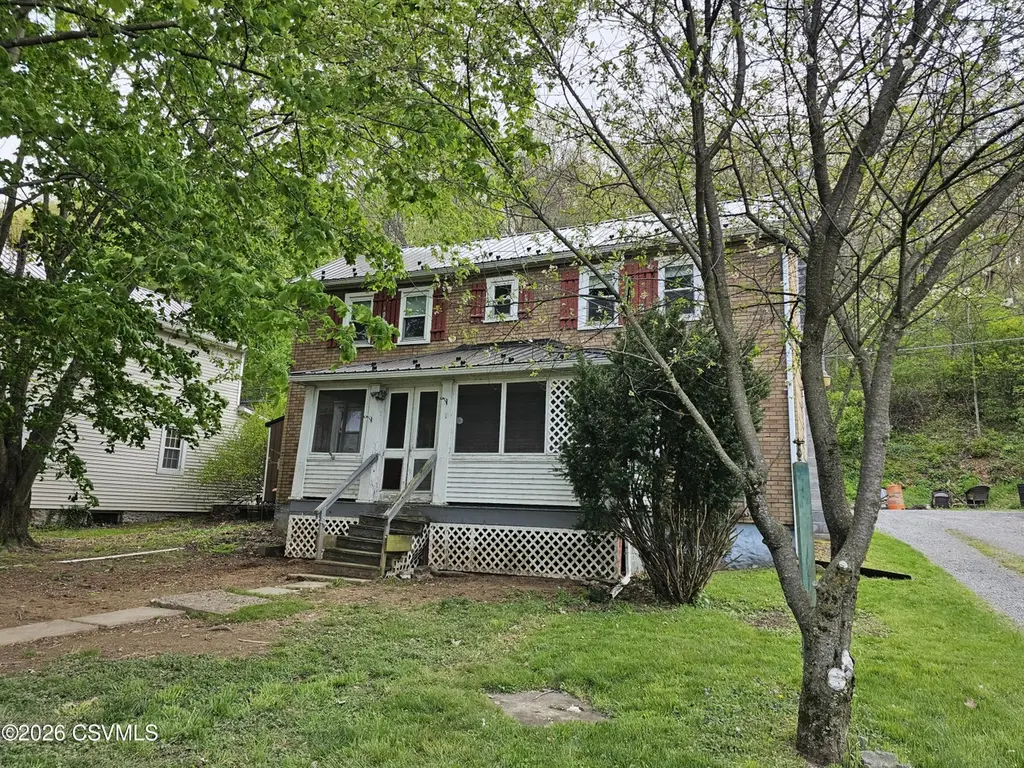
3015 Westbranch Hwy · East Buffalo, PA
Flood risk 9/10 · Severe
- FEMA flood zone
- X (shaded)
- Chance of flooding over 30 yrs
- 0.99%
- Est. flood insurance / yr
- $473 – $860
Fire risk 1/10 · Minimal
- Est. fire insurance / yr
- $511 – $949
Heat risk 5/10 · Moderate
- Hot days now (above 99°F)
- 7 days/yr
- Hot days in 30 yrs
- 15 days/yr
Wind risk 2/10 · Minimal
- Chance of severe wind over 30 yrs
- 3.0%
Air-quality risk 2/10 · Minimal
- Unhealthy air days now
- 0 days/yr
- Unhealthy air days in 30 yrs
- 1 days/yr
Risk factors via First Street. Map © Google.
Why this score? — see what drove the B grade
The composite is a weighted blend of 9 inputs, each scored 0–100. Each bar is that input's sub-score; the figure is the points it added to the 100-point composite (weight × sub-score).
- Cash flow +30.0/30.0
- 1% rule +10.0/10.0
- DSCR +10.0/10.0
- ARV discount +7.5/15.0
- Schools +5.9/10.0
- Rent growth +2.5/5.0
- Livability +2.5/5.0
- Condition / age +2.5/5.0
- Appreciation +0.0/10.0
$100,000
🖨 Deal sheet (PDF) 📄 Offer letter ✓ Due diligence
Listing remarks MLS
Conveniently located to Lewisburg & Selinsgrove, well cared for home. New replacement windows, newer furnace in 2004. Property will most likely not qualify for FHA or VA financing. Property is in the flood zone. Call 570-412-5801 for all showings.
Key facts
- Shed for storage
- Screened in porch
- 9,147 sq ft lot
Tags
Property features AI
Finance
- HOA & community: No community features
Exterior
- Parking: 1-car garage; 2 additional parking spaces
- Utilities: Well water; Cable available
- Home design: Single family residence; Residential property; R-1 zoning
- Construction: Frame construction; No foundation specified; Built area above grade: 1,152 (finished)
- Exterior features: Metal roof; Cable service available
Interior
- Kitchen: Refrigerator
- Bathrooms: 1 full bathroom; 1 half bathroom
- Heating & cooling: Has heating; Window unit(s) for cooling; Ceiling fan(s)
- Interior features: Washer and dryer included; Refrigerator included
- Laundry & utility: Washer; Dryer
Neighborhood map
What this means for you Summary
Snapshot
- This is a 3-bed/1.0-bath other listed at $100k.
Deal economics
- At list price, monthly cash flow is $958 ($12k/yr) — positive.
- The deal already cash-flows at list — no discount required.
- Meets the 1% rule at list price ($2k rent vs $100k).
- Recommended offer: $94k (6.0% below list) — sets the bar for market timing.
Location & tenants
- Location reads: area grade B — affects rentability + tenant quality, not the cash-flow math above.
- Lewisburg Area SD (town): math 65% / reading 74% proficiency, ranked #31 of 539 in PA (top 6%) — acceptable for families but not a draw, mixed tenant base, ~2y average lease.
- Zoned schools: Kelly El Sch (math 67% / reading 72%, grade A-, #151 of 1,518 statewide, top 12%, 548 students, 30% FRL); Donald H Eichhorn Ms (math 59% / reading 75%, grade A-, #17 of 512 statewide, top 4%, 413 students, 29% FRL); Lewisburg Hs (math 87%, 610 students, 25% FRL).
- Market conditions: 52 active listings in the ZIP; solid renter incomes; 49 units permitted in Union County in 2024 (0 in 5+ unit buildings).
Forward outlook
- Local home prices are declining (-3.0%/yr); year-one equity from $691 of loan paydown is wiped out by about $3k of value loss. Plan a longer hold.
- Union County population projected at +5% by 2050 — modest demand growth; plan on rents tracking national, not racing it.
- At projected returns (-3.0% appreciation + 3.0% rent growth), your $28k cash investment doubles in ~3 years — after that, you're playing with house money.
Negotiation context
- It's been on market 62 days — a 6% lower offer ($94k) is reasonable based on typical stale-listing flexibility.
- 2 sale attempts since 12y ago; this cycle's ask has dropped $25k (20%) from the opening price — seller is motivated, your offer sets the floor, not the list.
- Current owner paid $34k; list at $100k implies a 194% gain — meaningful room to come down on a strong offer.
Risks & watch-outs
- Watch-outs: flood insurance adds $56/mo; built in 1900 — expect roof / HVAC / electrical / plumbing capex.
- Climate carrying-cost: severe flood risk; extreme-heat days projected 7→15/yr by 2055 (HVAC capex compounding) — expect insurance premiums to compound above CPI over the hold.
Questions for the listing agent
- It's been on market 62 days. Have you received any prior offers? Is the seller open to a 6% concession, seller financing, or rate buy-down credit?
- Built in 1900 — when were the roof, HVAC, electrical panel, plumbing, and water heater last replaced?
- What's the actual annual flood-insurance premium (NFIP or private), and is the property in a SFHA with mandatory coverage?
- Why hasn't it sold? Are there any deal-killer items the seller is aware of (foundation, flood, title, zoning, code violations)?
- Is there a deadline driving the sale (1031 exchange, divorce, estate, relocation)? That informs how much negotiation room exists.
- What's the average days-on-market for RENTAL listings here right now (not sales)? A rising rental-DOM trend means longer vacancies and softer asking-rent achievability than the comps imply.
- What's the recent tenant-quality profile in this submarket — average credit score on applications, eviction rate, late-payment / NSF rate, and stable-employment percentage? A property-management company in the area should have these aggregated.
- How much new for-sale + rental construction is in the pipeline within 1–3 miles? Heavy new supply typically softens prices + rents 12–24 months out; constrained supply supports both.
Investment metrics
- 1% rule
- 2.20% ✓
- Cap rate
- 18.46%
- Cash-on-cash
- 43.46%
- DSCR
- 2.93
- GRM
- 3.8
CMA / ARV
- ARV (median comp)
- $295,714
- List price
- $100,000
- Delta
- -61.11%
- Verdict
- UNDERPRICED
- Comps
- 4 within 1.0 mi
Projected returns pro-forma
-3.0% appreciation · 3.0% rent growth · sell at horizon
- IRR
- 37.6%
- Equity multiple
- 2.60×
- Total profit
- $44,930
- Equity at exit
- $14,910
- IRR
- 44.2%
- Equity multiple
- 5.22×
- Total profit
- $118,091
- Equity at exit
- $8,646
Cash invested: $28,000 (down + closing). Projections, not guarantees.
Landlord ↔ Tenant lean methodology
- Overall (STATE)
- 62 Landlord-Friendly
- State Pennsylvania
- 62 Landlord-Friendly · EVEN
- County
- — inherits STATE
- City
- — inherits STATE
ZIP-level market 17837
- Active inventory
- 52
- Price-to-rent
- 3.8×
Monthly cashflow live
- Estimated rent
- $2,202 medium interval (Pro) →
- Mortgage (P&I)
- −$524
- Tax from tax record
- −$159 /mo · $1,914/yr
- Insurance
- −$42
- Flood insurance flood zone
- −$56 /mo · $666/yr
- HOA
- −$0
- Vacancy / Maint / Mgmt
- −$462
- Net cashflow
- $958
Break-even live
Sensitivity live
| Price | -10% $1,015 | -5% $987 | +0% $958 | +5% $930 | +10% $902 |
|---|---|---|---|---|---|
| Rent | -10% $785 | -5% $872 | +0% $958 | +5% $1,045 | +10% $1,132 |
| Rate | -1.0pp $1,009 | -0.5pp $984 | base $958 | +0.5pp $933 | +1.0pp $906 |
UW: 25.0% down · 7.5% · 30yr · 1.5% tax · 5.0% vac · 8.0% maint · 8.0% mgmt
Financing live
Cash to close
- Down payment
- $25,000
- Closing costs
- $3,000
- Reserves months
- —
- Total cash needed
- —
Loan-product check · same deal, 3 products live
Conventional
25% down · 7.5% · 30yr
- Down + closing
- —
- Monthly P&I
- —
- Monthly cashflow
- —
- DSCR
- —
- Eligible?
- —
Personal DTI + credit; lowest rate.
DSCR
20% down · 8.5% · 30yr
- Down + closing
- —
- Monthly P&I
- —
- Monthly cashflow
- —
- DSCR
- —
- Eligible?
- —
No personal income docs; deal must DSCR.
Hard money
10% down · 12.0% · 12mo
- Down + closing
- —
- Monthly P&I
- —
- Monthly cashflow
- —
- DSCR
- —
- Eligible?
- —
Short-term bridge; refi at stabilization.
Listing history 23 events
-
2026-06-22days on market $100,000 Active 62 DOM
-
2026-06-21pricedays on market $100,000 Active 61 DOM
-
2026-06-19days on market $115,000 Active 59 DOM
-
2026-06-18days on market $115,000 Active 58 DOM
-
2026-06-17days on market $115,000 Active 57 DOM
-
2026-06-16days on market $115,000 Active 56 DOM
-
2026-06-15days on market $115,000 Active 55 DOM
-
2026-06-14days on market $115,000 Active 53 DOM
-
2026-06-12days on market $115,000 Active 52 DOM
-
2026-06-09days on market $115,000 Active 49 DOM
-
2026-06-09price $115,000 Active 48 DOM
-
2026-06-08days on market $124,999 Active 48 DOM
-
2026-06-07days on market $124,999 Active 47 DOM
-
2026-06-07days on market $124,999 Active 46 DOM
-
2026-06-04days on market $124,999 Active 43 DOM
-
2026-06-02days on market $124,999 Active 42 DOM
-
2026-06-01days on market $124,999 Active 41 DOM
-
2026-05-31days on market $124,999 Active 40 DOM
-
2026-05-31days on market $124,999 Active 39 DOM
-
2026-04-20$124,999 Active 253-char remark
-
2015-12-14soldstatus $34,000 255-char remark
Show marketing remark (255 chars)
Conveniently located to Lewisburg & Selinsgrove, well cared for home. New replacement windows, newer furnace in 2004. Property will most likely not qualify for FHA or VA financing. Property is in the flood zone. Call 570-412-5801 for all showings.
-
2014-07-01$40,000 255-char remark
Show marketing remark (255 chars)
Conveniently located to Lewisburg & Selinsgrove, well cared for home. New replacement windows, newer furnace in 2004. Property will most likely not qualify for FHA or VA financing. Property is in the flood zone. Call 570-412-5801 for all showings.
-
1998-04-01soldstatus $42,000
ⓘ Source: listings_history table (triggers on properties + properties_extension) + one-shot
backfill from property_details.listing_events for pre-trigger history.
Tax reassessment forecast PA · Partial reset (capped growth)
- Current annual tax
- $1,914 · $159/mo
- Projected year-2 tax
- $1,914 · $159/mo
- Expected delta
- $0/yr ($0/mo · 0.0%)
ⓘ Screening estimate from a state-policy table — verify with the county assessor before closing.
Climate risk First Street
- Flood 9/10 Extreme FEMA zone X (shaded) · 99% chance over 30 yrs
- Wildfire 1/10 Low
- Heat 5/10 Major 7 d/yr ≥99°F today · 15 d/yr by 30 yrs out
- Wind 2/10 Low 3% chance of damaging wind over 30 yrs
- Air quality 2/10 Low 0 unhealthy d/yr today · 1 by 30 yrs out
Nearby sold comps map
Loading sold comps map…
Walkable amenities ~0.75 mi
Loading nearby amenities…
Taxation est. · year 1
- Rental income
- $26,424
- − Mortgage interest
- −$5,602
- − Property taxes
- −$1,914
- − Insurance
- −$1,166
- − Repairs & maintenance
- −$2,114
- − Management
- −$2,114
- − Depreciation
- −$2,909
- Taxable income
- $10,605
- Est. tax owed @ 24.0%
- −$2,545
- After-tax cash flow
- $8,956/yr
For passive investors: Depreciation is non-cash, so a rental often shows a tax loss while cash-flowing — sheltering income. Rental losses are passive: they offset passive income freely, and up to $25,000/yr can offset ordinary (W-2) income if you actively participate and your MAGI is under $100k (phasing out to $0 by $150k); unused losses carry forward. On sale, claimed depreciation is recaptured at up to 25%, and gains may owe capital-gains tax (a 1031 exchange can defer both). Figures are a year-1 estimate at your 24.0% rate — not tax advice; consult a CPA.
Schools (NCES district)
- District
- Lewisburg Area SD
- NCES district ID
- 4213590
- Math proficiency
- 65% ▼ -2.00%
- Reading proficiency
- 74% ▼ -7.00%
- Median HH income
- $50,129
- Composite
- 58.94/100
- National rank
- #968
- State rank
- #31 of 539 in PA
Livability — East Buffalo
No livability data for this city. (Only ~50 U.S. cities are tracked.)
Census & demographics
- County
- Union County · 18,403 people
- Metro
- Lewisburg, PA
- Population (ZIP)
- 18,403
- Household income
- $88,975
- Rent vs Own
- Severe rent burden
- 456.0
Population outlook (Union County) Hauer SSP2
- Today (2025)
- 46,664 people
- By 2030
- 47,704 · +2.2%
- By 2040
- 48,798 · +4.6%
- By 2050
- 49,048 · +5.1%
- By 2075
- 47,491 · +1.8%
- By 2100
- 41,817 · -10.4%
Race, ethnicity, and origin ACS 2023
- Neighborhood character
- Predominantly White (86%)
- Race & ethnicity
- White 86% Hispanic / Latino 5% Black 4% Asian 3% Two or more races 3%
- Hispanic origin (detail)
- Puerto Rican 2%
- Common ancestry
- Romanian 2% Italian 2% Lithuanian 2%
- Foreign-born
- 4% · Canada, China, Jamaica
- Languages at home
- 89% English-only · Spanish 4% German/W. Germanic 2% Other Indo-European 2%
Political lean MEDSL · Union
- 2024 margin
- Strong R (+23.4) · D 37.8% · R 61.2%
- 2008→2024 swing
- -8.9pp toward R · 2008: -14.5pp · 2024: -23.4pp
- All cycles
- 2024: R+23.4 2020: R+24.3 2016: R+25.7 2012: R+23.5 2008: R+14.5
Not yet ingested
- Civics
- —
Market trends
- HPI YoY
- ▼ -122.78%
- Current HPI
- 177.9792
- Rent YoY
- —
- Metro
- Lewisburg, PA
- State GDP YoY
- ▲ 1.68%
- F500 in state
- 34
Industry mix (Fortune 500 HQ in PA)
| Industry | F500 HQs | Revenue |
|---|---|---|
| Healthcare | 2 | $309B |
|
||
| Insurance | 2 | $27B |
|
||
| Telecommunications / Media | 1 | $124B |
|
||
| Industrial Distribution | 1 | $22B |
|
||
| Financial Services | 1 | $20B |
|
||
| Chemicals / Materials | 1 | $18B |
|
||
Price history
+138.1% since first listed6 events — show timeline
- 2026-06-19 Price Changed $100,000 CSVBR
- 2026-06-08 Price Changed $115,000 CSVBR
- 2026-04-20 Listed $124,999 CSVBR
- 2015-12-14 Sold (MLS) $34,000 CSVBR
- 2014-07-01 Listed $40,000 CSVBR
- 1998-04-01 Sold (Public Records) $42,000 Public Records
Property tax history
+1.2%/yrLatest (2026): $1,914 · +2.1% YoY. Source: county tax records.
Cash-flow waterfall
monthlySold comps — $/sqft
last 12 mo · ≤1 miLoading sold comps…