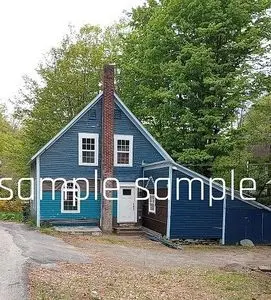
138 Valley St · Springfield, VT
Flood risk 10/10 · Severe
- FEMA flood zone
- X (unshaded)
- Chance of flooding over 30 yrs
- 0.99%
- Est. flood insurance / yr
- $473 – $860
Fire risk 3/10 · Minor
- Est. fire insurance / yr
- $480 – $892
Heat risk 2/10 · Minimal
- Hot days now (above 92°F)
- 7 days/yr
- Hot days in 30 yrs
- 16 days/yr
Wind risk 3/10 · Minor
- Chance of severe wind over 30 yrs
- 7.0%
Air-quality risk 1/10 · Minimal
- Unhealthy air days now
- 0 days/yr
- Unhealthy air days in 30 yrs
- 0 days/yr
Risk factors via First Street. Map © Google.
Why this score? — see what drove the B grade
The composite is a weighted blend of 9 inputs, each scored 0–100. Each bar is that input's sub-score; the figure is the points it added to the 100-point composite (weight × sub-score).
- Cash flow +30.0/30.0
- 1% rule +10.0/10.0
- DSCR +10.0/10.0
- ARV discount +7.5/15.0
- Schools +5.0/10.0
- Livability +3.7/5.0
- Rent growth +2.5/5.0
- Condition / age +2.5/5.0
- Appreciation +0.0/10.0
$90,000
🖨 Deal sheet (PDF) 📄 Offer letter ✓ Due diligence
Listing remarks MLS
Springfield Charmer: This home offers 3 bedrooms, 1 bath, nice kitchen, dining area, living room, laundry area and a den on the main level. Upstairs has 3 bedrooms. There is an enclosed 13x20 rear deck, a mud room, 2 attached sheds and a detached 2-car garage. Oil BBHW heating system, 100 amp electrical service, a drilled well, on site septic, nice garden area and the rear boundry is the Valley St. Brook. It is possible the property may require flood insurance.
Key facts
- New stove
- Remodeled kitchen
- New hood vent
Tags
Neighborhood map
What this means for you Summary
Snapshot
- This is a 3-bed/1.0-bath single-family listed at $90k.
Deal economics
- At list price, monthly cash flow is $770 ($9k/yr) — positive.
- The deal already cash-flows at list — no discount required.
- Meets the 1% rule at list price ($2k rent vs $90k).
- Recommended offer: $89k (1.5% below list) — sets the bar for market timing.
- Cap rate 17.3% vs local median 5.1% in Springfield — top-decile yield for the area; either an underpriced asset or a hidden risk that comps aren't pricing in. Stress-test before assuming the spread holds.
Location & tenants
- Location reads 73/100 on livability (#21 in VT) — a middle-class / working-renter tenant base. Strengths: cost of living A+, health & safety A+, crime A; Watch: amenities F, commute F, employment F.
- Market conditions: 50 active listings in the ZIP; 3 comparable units currently listed for rent nearby; rentals lingering (median 44d on market — plan ~5-8 weeks vacancy on turnover, expect pricing pressure); 100% of comp listings sitting > 30 days — soft ceiling on asking rent; 339 units permitted in Windsor County in 2024 (240 in 5+ unit buildings).
Forward outlook
- Local home prices are declining (-3.0%/yr); year-one equity from $622 of loan paydown is wiped out by about $3k of value loss. Plan a longer hold.
- Windsor County population projected at -21% by 2050 — secular population decline; favor cash flow + early exit over multi-decade hold.
- At projected returns (-3.0% appreciation + 3.0% rent growth), your $25k cash investment doubles in ~4 years — after that, you're playing with house money.
Negotiation context
- It's been on market 15 days — a 2% lower offer ($89k) is reasonable based on typical stale-listing flexibility.
- 2 sale attempts since 15y ago; this cycle's ask is 125% above the opening price — seller raised mid-cycle; expect resistance to lowballs.
- Current owner paid $30k; list at $90k implies a 200% gain — meaningful room to come down on a strong offer.
Risks & watch-outs
- Watch-outs: flood insurance adds $56/mo; built in 1890 — expect roof / HVAC / electrical / plumbing capex.
- Climate carrying-cost: severe flood risk — expect insurance premiums to compound above CPI over the hold.
Questions for the listing agent
- Built in 1890 — when were the roof, HVAC, electrical panel, plumbing, and water heater last replaced?
- What's the actual annual flood-insurance premium (NFIP or private), and is the property in a SFHA with mandatory coverage?
- Is there a deadline driving the sale (1031 exchange, divorce, estate, relocation)? That informs how much negotiation room exists.
- Schools are B-rated — typically a magnet for longer-tenancy family renters. What's the average tenant stay here, and is there a school-zone premium baked into asking?
- What's the average days-on-market for RENTAL listings here right now (not sales)? A rising rental-DOM trend means longer vacancies and softer asking-rent achievability than the comps imply.
- What's the recent tenant-quality profile in this submarket — average credit score on applications, eviction rate, late-payment / NSF rate, and stable-employment percentage? A property-management company in the area should have these aggregated.
- How much new for-sale + rental construction is in the pipeline within 1–3 miles? Heavy new supply typically softens prices + rents 12–24 months out; constrained supply supports both.
Investment metrics
- 1% rule
- 2.02% ✓
- Cap rate
- 17.30%
- Cash-on-cash
- 39.32%
- DSCR
- 2.75
- GRM
- 4.1
CMA / ARV
- ARV (median comp)
- $184,186
- List price
- $90,000
- Delta
- -51.14%
- Verdict
- UNDERPRICED
- Comps
- 20 within 1.0 mi
Show comp detail 10 sales within ~0.75 mi
| Address | Dist | Beds/Ba | Sqft | Sold | Price | $/sf | Match |
|---|---|---|---|---|---|---|---|
| 62 Mark St | 0.12mi | 3/1.5 | 1,056 (+2%) | 3mo | $231,500 | $219 | 86 |
| 226 Fellows Hill Rd | 0.36mi | 3/1.0 | 1,075 (+4%) | 6mo | $60,000 | $56 | 71 |
| 16 Mary St | 0.27mi | 2/1.5 (-1) | 1,048 (+2%) | 13mo | $201,000 | $192 | 67 |
| 10 Curtis St | 0.23mi | 2/1.0 (-1) | 998 (-3%) | 15mo | $184,500 | $185 | 67 |
| 15 Randall St | 0.30mi | 3/1.0 | 1,152 (+12%) | 9mo | $160,000 | $139 | 59 |
| 8 Curtis St | 0.23mi | 3/1.0 | 1,154 (+12%) | 18mo | $160,000 | $139 | 54 |
| 12 Slack Ave | 0.62mi | 3/1.0 | 1,071 (+4%) | 21mo | $160,000 | $149 | 47 |
| 79 Wall St | 0.62mi | 2/1.0 (-1) | 925 (-10%) | 10mo | $190,000 | $205 | 41 |
| 37 Coolidge Rd | 0.73mi | 2/1.0 (-1) | 942 (-8%) | 8mo | $193,000 | $205 | 40 |
| 2 Woolson Ave | 0.60mi | 2/1.5 (-1) | 1,136 (+10%) | 16mo | $218,000 | $192 | 34 |
Match score weights: distance 35% · size 25% · config 20% · recency 20%. Top-matched comps best support the ARV.
Projected returns pro-forma
-3.0% appreciation · 3.0% rent growth · sell at horizon
- IRR
- 32.5%
- Equity multiple
- 2.37×
- Total profit
- $34,519
- Equity at exit
- $13,419
- IRR
- 39.6%
- Equity multiple
- 4.71×
- Total profit
- $93,443
- Equity at exit
- $7,782
Cash invested: $25,200 (down + closing). Projections, not guarantees.
Landlord ↔ Tenant lean methodology
- Overall (STATE)
- 41 Moderately Tenant-Leaning
- State Vermont
- 41 Moderately Tenant-Leaning · D+15
- County
- — inherits STATE
- City
- — inherits STATE
ZIP-level market 05156
- Home prices YoY
- -12.2%
- Active inventory
- 50
- Price-to-rent
- 4.1×
Monthly cashflow live
- Estimated rent
- $1,822 medium interval (Pro) →
- Mortgage (P&I)
- −$472
- Tax from tax record
- −$104 /mo · $1,248/yr
- Insurance
- −$38
- Flood insurance flood zone
- −$56 /mo · $666/yr
- HOA
- −$0
- Vacancy / Maint / Mgmt
- −$383
- Net cashflow
- $770
Break-even live
Sensitivity live
| Price | -10% $821 | -5% $796 | +0% $770 | +5% $745 | +10% $719 |
|---|---|---|---|---|---|
| Rent | -10% $626 | -5% $698 | +0% $770 | +5% $842 | +10% $914 |
| Rate | -1.0pp $815 | -0.5pp $793 | base $770 | +0.5pp $747 | +1.0pp $723 |
UW: 25.0% down · 7.5% · 30yr · 1.5% tax · 5.0% vac · 8.0% maint · 8.0% mgmt
Financing live
Cash to close
- Down payment
- $22,500
- Closing costs
- $2,700
- Reserves months
- —
- Total cash needed
- —
Loan-product check · same deal, 3 products live
Conventional
25% down · 7.5% · 30yr
- Down + closing
- —
- Monthly P&I
- —
- Monthly cashflow
- —
- DSCR
- —
- Eligible?
- —
Personal DTI + credit; lowest rate.
DSCR
20% down · 8.5% · 30yr
- Down + closing
- —
- Monthly P&I
- —
- Monthly cashflow
- —
- DSCR
- —
- Eligible?
- —
No personal income docs; deal must DSCR.
Hard money
10% down · 12.0% · 12mo
- Down + closing
- —
- Monthly P&I
- —
- Monthly cashflow
- —
- DSCR
- —
- Eligible?
- —
Short-term bridge; refi at stabilization.
Rent comps 3 comps
| Address | Beds | Baths | Sqft | Rent | $/sqft | DOM | Units | Dist |
|---|---|---|---|---|---|---|---|---|
| 104 Park St Apt 2 Springfield, VT | 3.0 | 1.0 | 1150 | $1,645 | $1.43 | 44d | 1 | 0.59mi |
| 104 Park St Apt 4 Springfield, VT | 2.0 | 1.0 | 950 | $1,362 | $1.43 | 44d | 1 | 0.59mi |
| 39 Summit Ave Unit Na Springfield, VT | 2.0 | 2.0 | 1150 | $2,750 | $2.39 | 44d | 1 | 0.84mi |
Listing history 8 events
-
2026-05-12$90,000 Active 1540-char remark
-
2021-06-02soldstatus $30,000
-
2021-05-21soldstatus $30,000 Closed
-
2021-05-07status Pending
-
2021-05-04$40,000 Active
-
2012-04-23soldstatus $46,500
-
2012-04-20soldstatus $46,500
Show marketing remark (465 chars)
Springfield Charmer: This home offers 3 bedrooms, 1 bath, nice kitchen, dining area, living room, laundry area and a den on the main level. Upstairs has 3 bedrooms. There is an enclosed 13x20 rear deck, a mud room, 2 attached sheds and a detached 2-car garage. Oil BBHW heating system, 100 amp electrical service, a drilled well, on site septic, nice garden area and the rear boundry is the Valley St. Brook. It is possible the property may require flood insurance.
-
2011-03-08$48,000
Show marketing remark (465 chars)
Springfield Charmer: This home offers 3 bedrooms, 1 bath, nice kitchen, dining area, living room, laundry area and a den on the main level. Upstairs has 3 bedrooms. There is an enclosed 13x20 rear deck, a mud room, 2 attached sheds and a detached 2-car garage. Oil BBHW heating system, 100 amp electrical service, a drilled well, on site septic, nice garden area and the rear boundry is the Valley St. Brook. It is possible the property may require flood insurance.
ⓘ Source: listings_history table (triggers on properties + properties_extension) + one-shot
backfill from property_details.listing_events for pre-trigger history.
Tax reassessment forecast VT · Partial reset (capped growth)
- Current annual tax
- $1,248 · $104/mo
- Projected year-2 tax
- $1,479 · $123/mo
- Expected delta
- +$231/yr (+$19/mo · 18.5%)
ⓘ Screening estimate from a state-policy table — verify with the county assessor before closing.
Climate risk First Street
- Flood 10/10 Extreme FEMA zone X (unshaded) · 99% chance over 30 yrs
- Wildfire 3/10 Moderate
- Heat 2/10 Low 7 d/yr ≥92°F today · 16 d/yr by 30 yrs out
- Wind 3/10 Moderate 7% chance of damaging wind over 30 yrs
- Air quality 1/10 Low 0 unhealthy d/yr today · 0 by 30 yrs out
Nearby sold comps map
Loading sold comps map…
Walkable amenities ~0.75 mi
Loading nearby amenities…
Taxation est. · year 1
- Rental income
- $21,859
- − Mortgage interest
- −$5,041
- − Property taxes
- −$1,248
- − Insurance
- −$1,116
- − Repairs & maintenance
- −$1,749
- − Management
- −$1,749
- − Depreciation
- −$2,618
- Taxable income
- $8,338
- Est. tax owed @ 24.0%
- −$2,001
- After-tax cash flow
- $7,240/yr
For passive investors: Depreciation is non-cash, so a rental often shows a tax loss while cash-flowing — sheltering income. Rental losses are passive: they offset passive income freely, and up to $25,000/yr can offset ordinary (W-2) income if you actively participate and your MAGI is under $100k (phasing out to $0 by $150k); unused losses carry forward. On sale, claimed depreciation is recaptured at up to 25%, and gains may owe capital-gains tax (a 1031 exchange can defer both). Figures are a year-1 estimate at your 24.0% rate — not tax advice; consult a CPA.
Schools (NCES district)
No district data.
Livability — Springfield
- Score
- 73/100
- State rank
- #21
- US rank
- #5125
Category grades
Schools grade is shown separately in the Schools card above.
Census & demographics
- Census place
- Springfield, VT
- Population (ZIP)
- 9,028
Population outlook (Windsor County) Hauer SSP2
- Today (2025)
- 53,235 people
- By 2030
- 51,269 · -3.7%
- By 2040
- 46,517 · -12.6%
- By 2050
- 41,859 · -21.4%
- By 2075
- 33,298 · -37.5%
- By 2100
- 24,523 · -53.9%
Race, ethnicity, and origin ACS 2023
- Neighborhood character
- Predominantly White (93%)
- Race & ethnicity
- White 93% Two or more races 5% Hispanic / Latino 3%
- Common ancestry
- Lithuanian 13% Romanian 4% Serbian 3%
- Foreign-born
- 2% · Canada
- Languages at home
- 96% English-only · Spanish 2% French/Haitian/Cajun 1%
Political lean MEDSL · Windsor
- 2024 margin
- Solid D (+35.6) · D 66.3% · R 30.7% · Other 2.9%
- 2008→2024 swing
- -4.1pp toward R · 2008: 39.7pp · 2024: 35.6pp
- All cycles
- 2024: D+35.6 2020: D+38.9 2016: D+32.1 2012: D+38.1 2008: D+39.7
Not yet ingested
- Civics
- —
Market trends
- HPI YoY
- ▼ -43.22%
- Current HPI
- 310.0154
- Rent YoY
- —
- Metro
- —
- State GDP YoY
- —
- F500 in state
- 0
Price history
-37.5% since first listed7 events — show timeline
- 2021-06-02 Sold (Public Records) $30,000 Public Records
- 2021-05-21 Sold (MLS) $30,000 PrimeMLS
- 2021-05-07 Pending — PrimeMLS
- 2021-05-04 Listed $40,000 PrimeMLS
- 2012-04-23 Sold (Public Records) $46,500 Public Records
- 2012-04-20 Sold (MLS) $46,500 PrimeMLS
- 2011-03-08 Listed $48,000 PrimeMLS
Property tax history
+1.8%/yrLatest (2024): $1,248 · +10.5% YoY. Source: county tax records.
Cash-flow waterfall
monthlySold comps — $/sqft
last 12 mo · ≤1 miLoading sold comps…