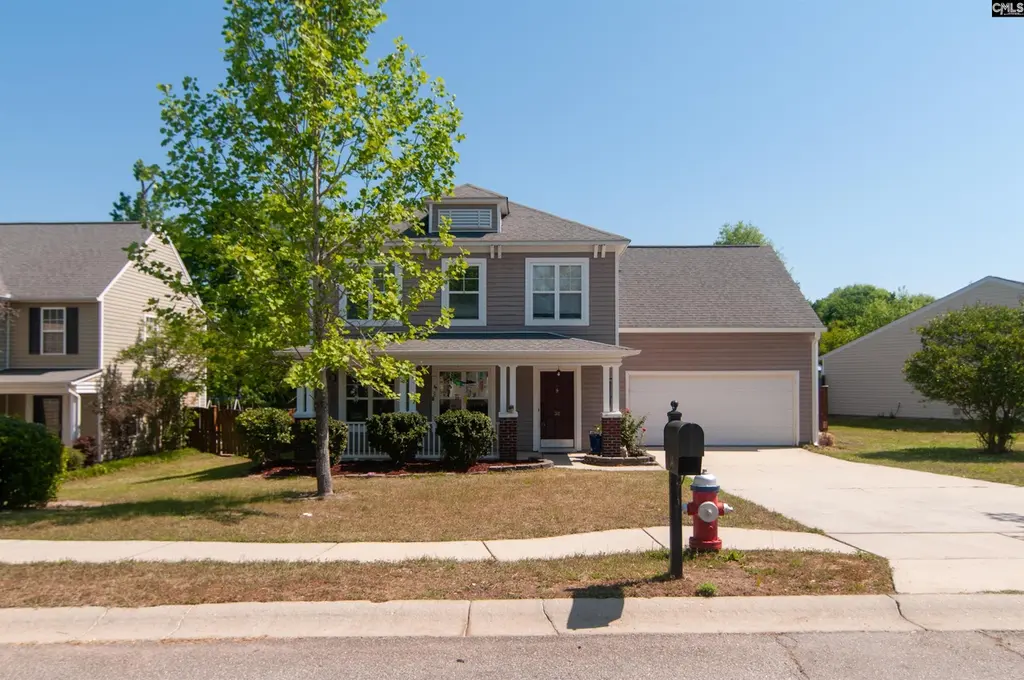
341 Foxport Dr · Lake Murray of Richland, SC
Flood risk 1/10 · Minimal
- FEMA flood zone
- X (unshaded)
- Chance of flooding over 30 yrs
- 0.0%
- Est. flood insurance / yr
- $507 – $1,088
Fire risk 4/10 · Minor
- Est. fire insurance / yr
- $783 – $1,453
Heat risk 6/10 · Moderate
- Hot days now (above 108°F)
- 7 days/yr
- Hot days in 30 yrs
- 16 days/yr
Wind risk 6/10 · Moderate
- Chance of severe wind over 30 yrs
- 52.0%
Air-quality risk 3/10 · Minor
- Unhealthy air days now
- 2 days/yr
- Unhealthy air days in 30 yrs
- 3 days/yr
Risk factors via First Street. Map © Google.
Why this score? — see what drove the D grade
The composite is a weighted blend of 9 inputs, each scored 0–100. Each bar is that input's sub-score; the figure is the points it added to the 100-point composite (weight × sub-score).
- Cash flow +13.5/30.0
- ARV discount +8.6/15.0
- Schools +4.5/10.0
- DSCR +4.1/10.0
- Livability +3.4/5.0
- 1% rule +3.1/10.0
- Rent growth +2.5/5.0
- Condition / age +2.5/5.0
- Appreciation +0.0/10.0
$316,900
🖨 Deal sheet (PDF) 📄 Offer letter ✓ Due diligence
Listing remarks
Welcome to this beautifully maintained home located in the highly desirable neighborhood of Foxport in Chapin and award winning LEX/RICH 5 school district. This 3 bedroom, 2 1/2 bath home has new LVP flooring throughout the entire home. Large living room, Dinning room and spacious kitchen with new appliances. As you walk upstairs there is a flex space great for a small office space and large FROG that could be 4th bedroom. Also upstairs is the spacious master bedroom with walk in closet and master bath with newly update master shower. New tankless hot water heater. Two additional bedrooms on 2nd floor with another full bathroom. A large fully fenced backyard for plenty of privacy and nicel
Key facts
- 9,583 sq ft lot
- 2 garage spots
- Built 2008
Property features AI
Finance
- Other: Sidewalks in the community
- HOA & community: Homeowners association present; Association covers common area maintenance and street light maintenance
Exterior
- Parking: Attached garage (main level) with parking for 2 cars; Total of 2 parking spaces
- Utilities: Public water; Public sewer
- Home design: Two-story home
- Construction: Vinyl exterior finish; Slab foundation
- Exterior features: Full wood privacy fence; Full gutters; Covered front porch; Uncovered back porch; Paved road access
Interior
- Kitchen: Formica countertops; Stained wood cabinets; Microwave installed above the stove; Dishwasher; Disposal; Refrigerator; Smooth-surface convection range with self-cleaning
- Bedrooms: Master bedroom on second floor with private bath and separate shower; Second bedroom on second floor with shared bath; Third bedroom on second floor with shared bath
- Flooring: Luxury vinyl plank flooring throughout main living areas, formal dining, formal living, kitchen, and bedrooms
- Bathrooms: Two full bathrooms; One half bathroom; Additional two full secondary baths listed
- Heating & cooling: Central cooling; Electric heating
- Interior features: Ceiling fans in master, other bedrooms, and formal living room; Bonus room (finished) and FROG (finished room over garage without closet); Gas water heater; Convection, self-cleaning, smooth-surface range
- Laundry & utility: Main-level laundry in a closet; Electric dryer; Washer included
Neighborhood map
What this means for you Summary
Snapshot
- This is a 3-bed/3.0-bath single-family listed at $317k.
Deal economics
- At list price, monthly cash flow is $14 ($170/yr) — positive.
- The deal already cash-flows at list — no discount required.
- To meet the 1% rule (rent ≥ 1% of price), the offer needs to be $258k (18.5% below list).
- Recommended offer: $258k (18.5% below list) — sets the bar for 1% rule.
Location & tenants
- Location reads 67/100 on livability (#102 in SC) — a middle-class / working-renter tenant base. Strengths: crime A+, employment A+, housing A+; Watch: amenities F, commute F, cost of living F.
- Lexington 05 (suburban): math 47% / reading 55% proficiency, ranked #5 of 80 in SC (top 6%) — acceptable for families but not a draw, mixed tenant base, ~2y average lease.
- Zoned schools: Lake Murray Elementary (math 78% / reading 82%, grade A+, #4 of 597 statewide, top 1%, 809 students, 18% FRL); Chapin Middle (math 50% / reading 57%, grade C+, #29 of 229 statewide, top 13%, 991 students, 27% FRL); Chapin High (math 82% / reading 91%, grade A, #7 of 196 statewide, top 4%, 1,615 students, 100% FRL) — zoned schools average 48% FRL vs 27% district-wide (21 pts higher); higher-poverty schools than district average — tighter screening recommended.
- Zoned-school proficiency averages 73% at this address vs 51% district-wide (+22 pts) — the actual schools serving this property are materially stronger than the Lexington 05 average implies; a family-tenant draw the district grade alone would hide.
- Market conditions: 443 active listings in the ZIP; 4 comparable units currently listed for rent nearby; rentals leasing fast (median 13d on market — plan ~1-2 weeks tenant-placement turnaround); high-income renter base; 3,472 units permitted in Richland County in 2024 (1,096 in 5+ unit buildings).
Forward outlook
- Local home prices are declining (-3.0%/yr); year-one equity from $2k of loan paydown is wiped out by about $10k of value loss. Plan a longer hold.
- Richland County population projected at +30% by 2050 — long-run rental-demand tailwind backs the buy-and-hold thesis.
Negotiation context
- It's been on market 59 days — a 3% lower offer ($307k) is reasonable based on typical stale-listing flexibility.
- 2 sale attempts since 3y ago with the ask held roughly flat each time — persistent listings suggest the price (not the market) is what's stuck; bring a comps-based counter.
- Current owner paid $197k; list at $317k implies a 61% gain — meaningful room to come down on a strong offer.
Risks & watch-outs
- Climate carrying-cost: major wind risk, 52% chance of damaging wind over 30y; extreme-heat days projected 7→16/yr by 2055 (HVAC capex compounding) — expect insurance premiums to compound above CPI over the hold.
Questions for the listing agent
- It's been on market 59 days. Have you received any prior offers? Is the seller open to a 19% concession, seller financing, or rate buy-down credit?
- What does the HOA fee cover, when was the last increase, and are there any pending special assessments or reserve-fund shortfalls?
- Is there a deadline driving the sale (1031 exchange, divorce, estate, relocation)? That informs how much negotiation room exists.
- Schools are D-rated, which usually means shorter tenancies and higher turnover. Who's the typical renter profile here, and what's been the actual vacancy rate?
- The area grade is low — what's the realistic commute time and amenity access for the typical tenant pool here? Any planned neighborhood developments (good or bad) we should know about?
- What's the average days-on-market for RENTAL listings here right now (not sales)? A rising rental-DOM trend means longer vacancies and softer asking-rent achievability than the comps imply.
- What's the recent tenant-quality profile in this submarket — average credit score on applications, eviction rate, late-payment / NSF rate, and stable-employment percentage? A property-management company in the area should have these aggregated.
- How much new for-sale + rental construction is in the pipeline within 1–3 miles? Heavy new supply typically softens prices + rents 12–24 months out; constrained supply supports both.
Investment metrics
- 1% rule
- 0.81% ✗
- Cap rate
- 6.35%
- Cash-on-cash
- 0.19%
- DSCR
- 1.01
- GRM
- 10.2
CMA / ARV
- ARV (on-the-fly)
- $324,768
- Comps found
- 1
Show comp detail 1 sale within ~0.75 mi
| Address | Dist | Beds/Ba | Sqft | Sold | Price | $/sf | Match |
|---|---|---|---|---|---|---|---|
| 14 Redbrush Ct | 0.30mi | 3/2.5 | 2,052 (-14%) | 21mo | $279,900 | $136 | 43 |
Match score weights: distance 35% · size 25% · config 20% · recency 20%. Top-matched comps best support the ARV.
Projected returns pro-forma
-3.0% appreciation · 3.0% rent growth · sell at horizon
- IRR
- -16.0%
- Equity multiple
- 0.43×
- Total profit
- $-50,513
- Equity at exit
- $47,251
- IRR
- -7.7%
- Equity multiple
- 0.51×
- Total profit
- $-43,079
- Equity at exit
- $27,400
Cash invested: $88,732 (down + closing). Projections, not guarantees.
Landlord ↔ Tenant lean methodology
- Overall (STATE)
- 90 Strongly Landlord-Friendly
- State South Carolina
- 90 Strongly Landlord-Friendly · R+6
- County
- — inherits STATE
- City
- — inherits STATE
ZIP-level market 29036
- Active inventory
- 443
- Price-to-rent
- 10.2×
Monthly cashflow live
- Estimated rent
- $2,582 medium interval (Pro) →
- Mortgage (P&I)
- −$1,662
- Tax from tax record
- −$201 /mo · $2,407/yr
- Insurance
- −$132
- HOA
- −$31
- Vacancy / Maint / Mgmt
- −$542
- Net cashflow
- $14
Break-even live
Sensitivity live
| Price | -10% $194 | -5% $104 | +0% $14 | +5% $-76 | +10% $-165 |
|---|---|---|---|---|---|
| Rent | -10% $-190 | -5% $-88 | +0% $14 | +5% $116 | +10% $218 |
| Rate | -1.0pp $174 | -0.5pp $95 | base $14 | +0.5pp $-68 | +1.0pp $-152 |
UW: 25.0% down · 7.5% · 30yr · 1.5% tax · 5.0% vac · 8.0% maint · 8.0% mgmt
Financing live
Cash to close
- Down payment
- $79,225
- Closing costs
- $9,507
- Reserves months
- —
- Total cash needed
- —
Loan-product check · same deal, 3 products live
Conventional
25% down · 7.5% · 30yr
- Down + closing
- —
- Monthly P&I
- —
- Monthly cashflow
- —
- DSCR
- —
- Eligible?
- —
Personal DTI + credit; lowest rate.
DSCR
20% down · 8.5% · 30yr
- Down + closing
- —
- Monthly P&I
- —
- Monthly cashflow
- —
- DSCR
- —
- Eligible?
- —
No personal income docs; deal must DSCR.
Hard money
10% down · 12.0% · 12mo
- Down + closing
- —
- Monthly P&I
- —
- Monthly cashflow
- —
- DSCR
- —
- Eligible?
- —
Short-term bridge; refi at stabilization.
Rent comps 4 comps
| Address | Beds | Baths | Sqft | Rent | $/sqft | DOM | Units | Dist |
|---|---|---|---|---|---|---|---|---|
| 40 Rustyred Ct Chapin, SC | 4.0 | 2.5 | 2400 | $2,450 | $1.02 | 13d | 1 | 0.22mi |
| 756 Helmsman Ln Chapin, SC | 4.0 | 2.5 | 1948 | $2,450 | $1.26 | 16d | 1 | 0.36mi |
| 628 Willowood Pkwy Chapin, SC | 4.0 | 2.0 | 2000 | $2,760 | $1.38 | 5d | 1 | 0.42mi |
| 339 Explorer Dr Chapin, SC | 4.0 | 2.0 | 1740 | $2,200 | $1.26 | 5d | 1 | 0.65mi |
HOA detail
- Monthly dues
- $31 · $372/yr
- Likely covers
- water
Listing history 13 events
-
2026-06-21days on market $316,900 Active 59 DOM
-
2026-06-08days on market $316,900 Active 57 DOM
-
2026-06-07days on market $316,900 Active 56 DOM
-
2026-06-03days on market $316,900 Active 52 DOM
-
2026-06-03days on market $316,900 Active 51 DOM
-
2026-06-01days on market $316,900 Active 50 DOM
-
2026-05-31days on market $316,900 Active 49 DOM
-
2026-04-30price $316,900
-
2026-04-12$319,900 Active
-
2023-05-02soldstatus $196,757
-
2023-04-07historical Active - Contingent
-
2023-03-17price $280,000
-
2023-03-02$295,000 Active
ⓘ Source: listings_history table (triggers on properties + properties_extension) + one-shot
backfill from property_details.listing_events for pre-trigger history.
Tax reassessment forecast SC · Resets to sale price
- Current annual tax
- $2,407 · $201/mo
- Projected year-2 tax
- $2,407 · $201/mo
- Expected delta
- $0/yr ($0/mo · 0.0%)
ⓘ Screening estimate from a state-policy table — verify with the county assessor before closing.
Climate risk First Street
- Flood 1/10 Low FEMA zone X (unshaded) · 0% chance over 30 yrs
- Wildfire 4/10 Moderate
- Heat 6/10 Major 7 d/yr ≥108°F today · 16 d/yr by 30 yrs out
- Wind 6/10 Major 52% chance of damaging wind over 30 yrs
- Air quality 3/10 Moderate 2 unhealthy d/yr today · 3 by 30 yrs out
Nearby sold comps map
Loading sold comps map…
Walkable amenities ~0.75 mi
Loading nearby amenities…
Taxation est. · year 1
- Rental income
- $30,982
- − Mortgage interest
- −$17,751
- − Property taxes
- −$2,407
- − Insurance
- −$1,584
- − Repairs & maintenance
- −$2,479
- − Management
- −$2,479
- − HOA
- −$372
- − Depreciation
- −$9,219
- Taxable loss
- −$5,309
- Est. tax savings @ 24.0%
- +$1,274
- After-tax cash flow
- $1,444/yr
For passive investors: Depreciation is non-cash, so a rental often shows a tax loss while cash-flowing — sheltering income. Rental losses are passive: they offset passive income freely, and up to $25,000/yr can offset ordinary (W-2) income if you actively participate and your MAGI is under $100k (phasing out to $0 by $150k); unused losses carry forward. On sale, claimed depreciation is recaptured at up to 25%, and gains may owe capital-gains tax (a 1031 exchange can defer both). Figures are a year-1 estimate at your 24.0% rate — not tax advice; consult a CPA.
Schools (NCES district)
- District
- Lexington 05
- NCES district ID
- 4502820
- Math proficiency
- 47% ▼ -7.00%
- Reading proficiency
- 55% ▼ -4.00%
- Median HH income
- $67,732
- Composite
- 45.28/100
- National rank
- #2656
- State rank
- #5 of 80 in SC
Livability — Lake Murray of Richland
- Score
- 67/100
- State rank
- #102
- US rank
- #10903
Category grades
Schools grade is shown separately in the Schools card above.
Census & demographics
- Census place
- Lake Murray of Richland, SC
- County
- Lexington County · 232,571 people
- City population
- 179
- Metro
- Columbia, SC
- Population (ZIP)
- 26,620
- Household income
- $113,986
- Rent vs Own
- Severe rent burden
- 212.0
Population outlook (Richland County) Hauer SSP2
- Today (2025)
- 459,667 people
- By 2030
- 487,524 · +6.1%
- By 2040
- 542,035 · +17.9%
- By 2050
- 595,371 · +29.5%
- By 2075
- 732,998 · +59.5%
- By 2100
- 820,415 · +78.5%
Race, ethnicity, and origin ACS 2023
- Neighborhood character
- Predominantly White (86%)
- Race & ethnicity
- White 86% Asian 5% Two or more races 4% Black 3% Hispanic / Latino 3%
- Common ancestry
- Lithuanian 4% Slovak 4% Italian 2%
- Foreign-born
- 6% · Canada, South Korea, China
- Languages at home
- 95% English-only · Other Indo-European 2% Spanish 1% Korean 1%
Political lean MEDSL · Richland
- 2024 margin
- Solid D (+34.6) · D 66.4% · R 31.8% · Other 1.8%
- 2008→2024 swing
- +5.7pp toward D · 2008: 28.9pp · 2024: 34.6pp
- All cycles
- 2024: D+34.6 2020: D+38.3 2016: D+32.9 2012: D+33.3 2008: D+28.9
Not yet ingested
- Civics
- —
Market trends
- HPI YoY
- ▼ -134.76%
- Current HPI
- 248.3807
- Rent YoY
- —
- Metro
- Columbia, SC
- State GDP YoY
- ▲ 4.51%
- F500 in state
- 2
Industry mix (Fortune 500 HQ in SC)
| Industry | F500 HQs | Revenue |
|---|---|---|
| Packaging | 1 | $7B |
|
||
Price history
+7.4% since first listed6 events — show timeline
- 2026-04-30 Price Changed $316,900 Consolidated MLS
- 2026-04-12 Listed $319,900 Consolidated MLS
- 2023-05-02 Sold (Public Records) $196,757 Public Records
- 2023-04-07 Contingent — Consolidated MLS
- 2023-03-17 Price Changed $280,000 Consolidated MLS
- 2023-03-02 Listed $295,000 Consolidated MLS
Property tax history
+5.2%/yrLatest (2025): $2,407 · +4.1% YoY. Source: county tax records.
Cash-flow waterfall
monthlySold comps — $/sqft
last 12 mo · ≤1 miLoading sold comps…