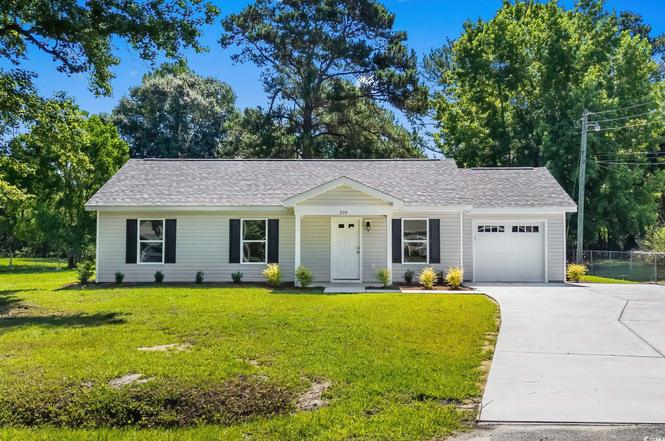
210 Nu-shell St · Georgetown, SC
Flood risk 1/10 · Minimal
- FEMA flood zone
- X (unshaded)
- Chance of flooding over 30 yrs
- 0.0%
- Est. flood insurance / yr
- $507 – $1,088
Fire risk 5/10 · Moderate
- Est. fire insurance / yr
- $783 – $1,453
Heat risk 9/10 · Severe
- Hot days now (above 108°F)
- 7 days/yr
- Hot days in 30 yrs
- 17 days/yr
Wind risk 8/10 · Major
- Chance of severe wind over 30 yrs
- 99.0%
Air-quality risk 2/10 · Minimal
- Unhealthy air days now
- 0 days/yr
- Unhealthy air days in 30 yrs
- 1 days/yr
Risk factors via First Street. Map © Google.
Why this score? — see what drove the D grade
The composite is a weighted blend of 9 inputs, each scored 0–100. Each bar is that input's sub-score; the figure is the points it added to the 100-point composite (weight × sub-score).
- Cash flow +13.7/30.0
- ARV discount +7.5/15.0
- DSCR +4.2/10.0
- 1% rule +3.9/10.0
- Livability +3.2/5.0
- Schools +2.7/10.0
- Rent growth +2.5/5.0
- Condition / age +2.5/5.0
- Appreciation +0.0/10.0
$264,400
🖨 Deal sheet (PDF) 📄 Offer letter ✓ Due diligence
Listing remarks
Welcome home to this newly-built residence situated on an expansive 0.46-acre lot in the heart of Georgetown. Offering the perfect blend of modern finishes, functionality and an unbeatable location. Inside, you'll find thoughtful upgrades throughout, including granite countertops in the kitchen & bathrooms, luxury vinyl plank flooring throughout the main living areas, and comfortable carpeting in the bedrooms. The spacious primary suite features a large walk-in closet and a well-appointed en-suite bath designed for everyday comfort. A standout feature of this property is the impressive 24' x 30' workshop/storage building, offering endless possibilities and an oversized concrete drivew
Key facts
- Walk-in closet
- Floored attic space
- Custom finishes
Tags
Property features AI
Finance
- HOA & community: Monthly association fee
Exterior
- Parking: Attached garage; Garage with 1 space; Total of 3 parking spaces
- Home design: Single-story home; New construction; Built by CGR Homes, LLC
- Construction: Never occupied (new construction)
- Exterior features: Lot approximately 0.46 acres; Lot dimensions roughly 100 x 200 x 100 x 200; Zoned residential
Interior
- Bathrooms: 1 full bathroom; 1 half bathroom
- Interior features: Unfurnished; Never occupied (new construction)
Neighborhood map
What this means for you Summary
Snapshot
- This is a 3-bed/1.0-bath other listed at $264k.
Deal economics
- At list price, monthly cash flow is $22 ($259/yr) — positive.
- The deal already cash-flows at list — no discount required.
- To meet the 1% rule (rent ≥ 1% of price), the offer needs to be $234k (11.5% below list).
- Recommended offer: $233k (12.0% below list) — sets the bar for market timing.
- Cap rate 6.4% vs local median 4.7% in Georgetown — top-decile yield for the area; either an underpriced asset or a hidden risk that comps aren't pricing in. Stress-test before assuming the spread holds.
Location & tenants
- Location reads 65/100 on livability (#141 in SC) — a middle-class / working-renter tenant base. Strengths: cost of living A+, housing A+, health & safety A+; Watch: amenities D, crime F, commute F.
- Georgetown 01 (town): math 26% / reading 38% proficiency, ranked #51 of 80 in SC (top 64%) — families likely to look elsewhere, expect single-tenant / working-renter base with shorter leases.
- Zoned schools: Mcdonald Elementary (math 16% / reading 17%, grade F, #535 of 597 statewide, top 90%, 429 students, 100% FRL); Georgetown Middle (math 15% / reading 23%, grade F, #185 of 229 statewide, top 81%, 712 students, 100% FRL); Georgetown High (math 27% / reading 75%, grade D+, #148 of 196 statewide, top 76%, 940 students, 77% FRL) — zoned schools average 92% FRL vs 59% district-wide (33 pts higher); higher-poverty schools than district average — tighter screening recommended.
- Market conditions: 412 active listings in the ZIP; 323 units permitted in Georgetown County in 2024 (0 in 5+ unit buildings).
Forward outlook
- Local home prices are declining (-3.0%/yr); year-one equity from $2k of loan paydown is wiped out by about $8k of value loss. Plan a longer hold.
Negotiation context
- It's been on market 198 days — a 12% lower offer ($233k) is reasonable based on typical stale-listing flexibility.
Risks & watch-outs
- Climate carrying-cost: severe wind risk, 99% chance of damaging wind over 30y; moderate wildfire risk; extreme-heat days projected 7→17/yr by 2055 (HVAC capex compounding) — expect insurance premiums to compound above CPI over the hold.
Questions for the listing agent
- It's been on market 198 days. Have you received any prior offers? Is the seller open to a 12% concession, seller financing, or rate buy-down credit?
- Why hasn't it sold? Are there any deal-killer items the seller is aware of (foundation, flood, title, zoning, code violations)?
- Is there a deadline driving the sale (1031 exchange, divorce, estate, relocation)? That informs how much negotiation room exists.
- Schools are F-rated, which usually means shorter tenancies and higher turnover. Who's the typical renter profile here, and what's been the actual vacancy rate?
- Crime grade is F in this area — have there been break-ins, vandalism, or insurance claims at this property in the last 3 years? What carrier currently insures it and at what premium?
- The area grade is low — what's the realistic commute time and amenity access for the typical tenant pool here? Any planned neighborhood developments (good or bad) we should know about?
- What's the average days-on-market for RENTAL listings here right now (not sales)? A rising rental-DOM trend means longer vacancies and softer asking-rent achievability than the comps imply.
- What's the recent tenant-quality profile in this submarket — average credit score on applications, eviction rate, late-payment / NSF rate, and stable-employment percentage? A property-management company in the area should have these aggregated.
- How much new for-sale + rental construction is in the pipeline within 1–3 miles? Heavy new supply typically softens prices + rents 12–24 months out; constrained supply supports both.
Investment metrics
- 1% rule
- 0.89% ✗
- Cap rate
- 6.39%
- Cash-on-cash
- 0.35%
- DSCR
- 1.02
- GRM
- 9.4
CMA / ARV
No comps found within radius.
Projected returns pro-forma
-3.0% appreciation · 3.0% rent growth · sell at horizon
- IRR
- -15.7%
- Equity multiple
- 0.44×
- Total profit
- $-41,432
- Equity at exit
- $39,423
- IRR
- -7.3%
- Equity multiple
- 0.54×
- Total profit
- $-34,163
- Equity at exit
- $22,860
Cash invested: $74,032 (down + closing). Projections, not guarantees.
Landlord ↔ Tenant lean methodology
- Overall (STATE)
- 90 Strongly Landlord-Friendly
- State South Carolina
- 90 Strongly Landlord-Friendly · R+6
- County
- — inherits STATE
- City
- — inherits STATE
ZIP-level market 29440
- Home prices YoY
- -34.9%
- Active inventory
- 412
- Price-to-rent
- 9.4×
Monthly cashflow live
- Estimated rent
- $2,340 medium interval (Pro) →
- Mortgage (P&I)
- −$1,387
- Tax est. 1.5%
- −$330 /mo · $3,966/yr
- Insurance
- −$110
- HOA
- −$0
- Vacancy / Maint / Mgmt
- −$491
- Net cashflow
- $22
Break-even live
Sensitivity live
| Price | -10% $204 | -5% $113 | +0% $22 | +5% $-70 | +10% $-161 |
|---|---|---|---|---|---|
| Rent | -10% $-163 | -5% $-71 | +0% $22 | +5% $114 | +10% $206 |
| Rate | -1.0pp $155 | -0.5pp $89 | base $22 | +0.5pp $-47 | +1.0pp $-117 |
UW: 25.0% down · 7.5% · 30yr · 1.5% tax · 5.0% vac · 8.0% maint · 8.0% mgmt
Financing live
Cash to close
- Down payment
- $66,100
- Closing costs
- $7,932
- Reserves months
- —
- Total cash needed
- —
Loan-product check · same deal, 3 products live
Conventional
25% down · 7.5% · 30yr
- Down + closing
- —
- Monthly P&I
- —
- Monthly cashflow
- —
- DSCR
- —
- Eligible?
- —
Personal DTI + credit; lowest rate.
DSCR
20% down · 8.5% · 30yr
- Down + closing
- —
- Monthly P&I
- —
- Monthly cashflow
- —
- DSCR
- —
- Eligible?
- —
No personal income docs; deal must DSCR.
Hard money
10% down · 12.0% · 12mo
- Down + closing
- —
- Monthly P&I
- —
- Monthly cashflow
- —
- DSCR
- —
- Eligible?
- —
Short-term bridge; refi at stabilization.
Listing history 19 events
-
2026-06-22days on market $264,400 Active 198 DOM
-
2026-06-18days on market $264,400 Active 195 DOM
-
2026-06-17days on market $264,400 Active 194 DOM
-
2026-06-16days on market $264,400 Active 193 DOM
-
2026-06-15days on market $264,400 Active 192 DOM
-
2026-06-14days on market $264,400 Active 190 DOM
-
2026-06-10remarks 695-char remark
-
2026-06-10days on market $264,400 Active 187 DOM
-
2026-06-09days on market $264,400 Active 186 DOM
-
2026-06-09days on market $264,400 Active 185 DOM
-
2026-06-03days on market $264,400 Active 183 DOM
-
2026-06-02days on market $264,400 Active 182 DOM
-
2026-06-01days on market $264,400 Active 181 DOM
-
2026-05-31days on market $264,400 Active 180 DOM
-
2026-05-30days on market $264,400 Active 179 DOM
-
2026-05-11price $264,400
-
2026-03-03price $259,900
-
2026-02-25price $264,500
-
2025-12-02$264,900 Active
ⓘ Source: listings_history table (triggers on properties + properties_extension) + one-shot
backfill from property_details.listing_events for pre-trigger history.
Climate risk First Street
- Flood 1/10 Low FEMA zone X (unshaded) · 0% chance over 30 yrs
- Wildfire 5/10 Major
- Heat 9/10 Extreme 7 d/yr ≥108°F today · 17 d/yr by 30 yrs out
- Wind 8/10 Severe 99% chance of damaging wind over 30 yrs
- Air quality 2/10 Low 0 unhealthy d/yr today · 1 by 30 yrs out
Nearby sold comps map
Loading sold comps map…
Walkable amenities ~0.75 mi
Loading nearby amenities…
Taxation est. · year 1
- Rental income
- $28,083
- − Mortgage interest
- −$14,811
- − Property taxes
- −$3,966
- − Insurance
- −$1,322
- − Repairs & maintenance
- −$2,247
- − Management
- −$2,247
- − Depreciation
- −$7,692
- Taxable loss
- −$4,200
- Est. tax savings @ 24.0%
- +$1,008
- After-tax cash flow
- $1,267/yr
For passive investors: Depreciation is non-cash, so a rental often shows a tax loss while cash-flowing — sheltering income. Rental losses are passive: they offset passive income freely, and up to $25,000/yr can offset ordinary (W-2) income if you actively participate and your MAGI is under $100k (phasing out to $0 by $150k); unused losses carry forward. On sale, claimed depreciation is recaptured at up to 25%, and gains may owe capital-gains tax (a 1031 exchange can defer both). Figures are a year-1 estimate at your 24.0% rate — not tax advice; consult a CPA.
Schools (NCES district)
- District
- Georgetown 01
- NCES district ID
- 4502280
- Math proficiency
- 26% ▼ -11.00%
- Reading proficiency
- 38% ▼ -5.00%
- Median HH income
- $43,045
- Composite
- 27.15/100
- National rank
- #7030
- State rank
- #51 of 80 in SC
Livability — Georgetown
- Score
- 65/100
- State rank
- #141
- US rank
- #13446
Category grades
Schools grade is shown separately in the Schools card above.
Census & demographics
- Population (ZIP)
- 26,419
Population outlook (Georgetown County) Hauer SSP2
- Today (2025)
- 63,275 people
- By 2030
- 63,630 · +0.6%
- By 2040
- 63,130 · -0.2%
- By 2050
- 61,904 · -2.2%
- By 2075
- 59,305 · -6.3%
- By 2100
- 53,852 · -14.9%
Race, ethnicity, and origin ACS 2023
- Neighborhood character
- Majority White (52%)
- Race & ethnicity
- White 52% Black 45% Hispanic / Latino 2%
- Common ancestry
- Italian 3% Lithuanian 2% Slovak 1%
- Foreign-born
- 3% · Canada
- Languages at home
- 97% English-only · Spanish 2%
Political lean MEDSL · Georgetown
- 2024 margin
- R (+19.5) · D 39.6% · R 59.1% · Other 1.2%
- 2008→2024 swing
- -14.2pp toward R · 2008: -5.2pp · 2024: -19.5pp
- All cycles
- 2024: R+19.5 2020: R+12.7 2016: R+13.0 2012: R+7.6 2008: R+5.2
Not yet ingested
- Civics
- —
Market trends
- HPI YoY
- ▼ -111.84%
- Current HPI
- 208.6792
- Rent YoY
- —
- Metro
- —
- State GDP YoY
- ▲ 4.51%
- F500 in state
- 2
Industry mix (Fortune 500 HQ in SC)
| Industry | F500 HQs | Revenue |
|---|---|---|
| Packaging | 1 | $7B |
|
||
Price history
-0.2% since first listed4 events — show timeline
- 2026-05-11 Price Changed $264,400 CCAR
- 2026-03-03 Price Changed $259,900 CCAR
- 2026-02-25 Price Changed $264,500 CCAR
- 2025-12-02 Listed $264,900 CCAR
Property tax history
-9.5%/yrLatest (2025): $347 · -76.5% YoY. Source: county tax records.
Cash-flow waterfall
monthlySold comps — $/sqft
last 12 mo · ≤1 miLoading sold comps…