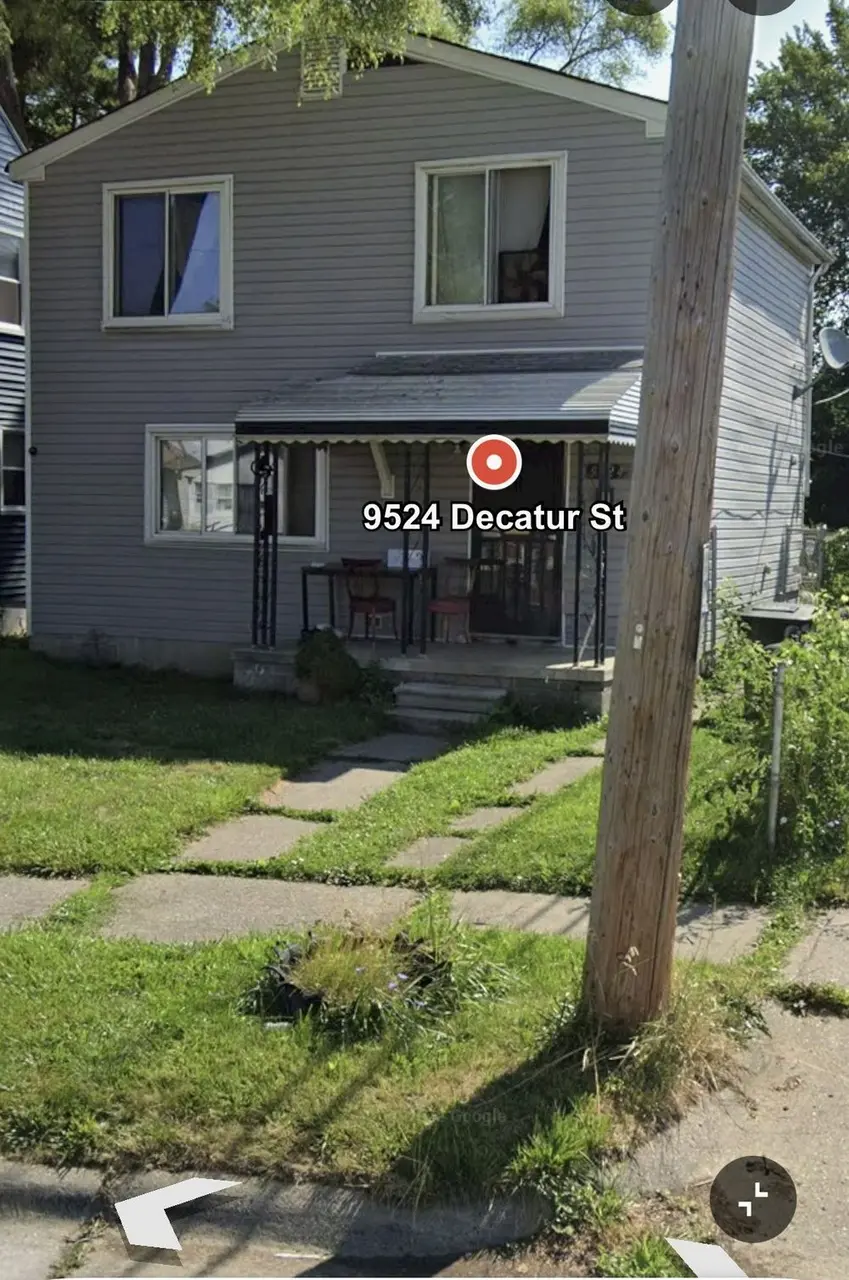
9524 Decatur St · Detroit, MI
Flood risk 1/10 · Minimal
- FEMA flood zone
- X (unshaded)
- Chance of flooding over 30 yrs
- 0.0%
- Est. flood insurance / yr
- $507 – $1,088
Fire risk 1/10 · Minimal
- Est. fire insurance / yr
- $784 – $1,456
Heat risk 3/10 · Minor
- Hot days now (above 97°F)
- 7 days/yr
- Hot days in 30 yrs
- 15 days/yr
Wind risk 2/10 · Minimal
- Chance of severe wind over 30 yrs
- —
Air-quality risk 3/10 · Minor
- Unhealthy air days now
- 2 days/yr
- Unhealthy air days in 30 yrs
- 5 days/yr
Risk factors via First Street. Map © Google.
Why this score? — see what drove the D grade
The composite is a weighted blend of 9 inputs, each scored 0–100. Each bar is that input's sub-score; the figure is the points it added to the 100-point composite (weight × sub-score).
- Cash flow +15.0/30.0
- ARV discount +7.5/15.0
- 1% rule +5.0/10.0
- DSCR +5.0/10.0
- Rent growth +3.9/5.0
- Livability +3.7/5.0
- Condition / age +2.5/5.0
- Schools +1.3/10.0
- Appreciation +0.0/10.0
$35,000
🖨 Deal sheet 📄 Offer letter ✓ Due diligence
Listing remarks
This is a 4 bedroom 2 bath with no basement with a huge backyard. This house do need some repairs but for this price it great. Please feel free to contact me at 313-646-5161 for more information.
Key facts
- 4,356 sq ft lot
- Built 1972
- Listed 14 days
Property features AI
Exterior
- Home design: House
- Construction: Living area approximately 1,344
- Exterior features: Lot is approximately 4,356 sq ft
Neighborhood map
What this means for you Summary
Snapshot
- This is a 4-bed/1.0-bath single-family listed at $35k.
Deal economics
- At list price, monthly cash flow is $910 ($11k/yr) — positive.
- The deal already cash-flows at list — no discount required.
- Meets the 1% rule at list price ($1k rent vs $35k).
- Cap rate 37.5% vs local median 10.2% in Detroit — top-decile yield for the area; either an underpriced asset or a hidden risk that comps aren't pricing in. Stress-test before assuming the spread holds.
Location & tenants
- Location reads 73/100 on livability (#218 in MI) — a middle-class / working-renter tenant base. Strengths: amenities A+, commute A+, cost of living A+; Watch: schools F, crime F, employment F.
- Detroit Public Schools Community District (urban): math 10% / reading 24% proficiency, ranked #499 of 540 in MI (top 92%) — low school quality limits family demand, transient renter base, plan for 1-2y turnover; 90% free/reduced lunch — lower-income household profile, screen leases tightly.
- Market conditions: Rents rising fast (+5.6%/yr); 385 active listings in the ZIP; 31 comparable units currently listed for rent nearby; rentals at typical pace (median 24d on market — plan ~3-4 weeks tenant-placement turnaround); 48% of comp listings sitting > 30 days — soft ceiling on asking rent; lower-income renter base — watch delinquency; 2,639 units permitted in Wayne County in 2024 (1,216 in 5+ unit buildings).
- At $1,458/mo this rent would consume 48% of the median local household income ($37k/yr) (locally 2371% of renters already pay >50% of income on rent) — very limited rent-growth headroom before tenants either downsize or default.
Forward outlook
- Local home prices are declining (-3.0%/yr); year-one equity from $242 of loan paydown is wiped out by about $1k of value loss. Plan a longer hold.
- Wayne County population projected at -17% by 2050 — secular population decline; favor cash flow + early exit over multi-decade hold.
- At projected returns (-3.0% appreciation + 5.6% rent growth), your $10k cash investment doubles in ~1 year — after that, you're playing with house money.
Negotiation context
- Only 14 days on market — expect competitive offers; lowballing is unlikely to land.
- 9 sale attempts since 18y ago with the ask held roughly flat each time — persistent listings suggest the price (not the market) is what's stuck; bring a comps-based counter.
Questions for the listing agent
- Built in 1972 — when were the roof, HVAC, electrical panel, plumbing, and water heater last replaced?
- Is there a deadline driving the sale (1031 exchange, divorce, estate, relocation)? That informs how much negotiation room exists.
- Schools are F-rated, which usually means shorter tenancies and higher turnover. Who's the typical renter profile here, and what's been the actual vacancy rate?
- Crime grade is F in this area — have there been break-ins, vandalism, or insurance claims at this property in the last 3 years? What carrier currently insures it and at what premium?
- The area grade is low — what's the realistic commute time and amenity access for the typical tenant pool here? Any planned neighborhood developments (good or bad) we should know about?
- What's the average days-on-market for RENTAL listings here right now (not sales)? A rising rental-DOM trend means longer vacancies and softer asking-rent achievability than the comps imply.
- What's the recent tenant-quality profile in this submarket — average credit score on applications, eviction rate, late-payment / NSF rate, and stable-employment percentage? A property-management company in the area should have these aggregated.
- How much new for-sale + rental construction is in the pipeline within 1–3 miles? Heavy new supply typically softens prices + rents 12–24 months out; constrained supply supports both.
Investment metrics
- 1% rule
- 4.17% ✓
- Cap rate
- 37.50%
- Cash-on-cash
- 111.47%
- DSCR
- 5.96
- GRM
- 2.0
CMA / ARV
- ARV (on-the-fly)
- $94,080
- Comps found
- 12
Show comp detail 12 sales within ~0.75 mi
| Address | Dist | Beds/Ba | Sqft | Sold | Price | $/sf | Match |
|---|---|---|---|---|---|---|---|
| 9119 Littlefield St | 0.41mi | 3/1.0 (-1) | 1,298 (-3%) | 2mo | $60,000 | $46 | 68 |
| 11406 Strathmoor St | 0.51mi | 4/2.5 | 1,294 (-4%) | 1mo | $76,000 | $59 | 63 |
| 9412 Steel St | 0.50mi | 3/1.5 (-1) | 1,353 (+1%) | 7mo | $95,000 | $70 | 63 |
| 9141 Hartwell St | 0.36mi | 3/1.5 (-1) | 1,431 (+6%) | 6mo | $90,000 | $63 | 60 |
| 9576 Hubbell St | 0.38mi | 3/2.0 (-1) | 1,270 (-6%) | 6mo | $134,900 | $106 | 59 |
| 9231 Sorrento St | 0.48mi | 5/2.0 (+1) | 1,389 (+3%) | 7mo | $165,000 | $119 | 58 |
| 9535 Terry St | 0.57mi | 3/1.5 (-1) | 1,387 (+3%) | 6mo | $110,000 | $79 | 56 |
| 9180 Hartwell St | 0.35mi | 3/1.5 (-1) | 1,174 (-13%) | 5mo | $62,000 | $53 | 52 |
| 8590 Littlefield St | 0.66mi | 3/1.5 (-1) | 1,218 (-9%) | 1mo | $100,000 | $82 | 46 |
| 11366 Terry St | 0.66mi | 3/1.0 (-1) | 1,209 (-10%) | 7mo | $89,000 | $74 | 42 |
| 8849 Lauder St | 0.70mi | 3/1.0 (-1) | 1,200 (-11%) | 5mo | $41,500 | $35 | 40 |
| 11431 Marlowe St | 0.63mi | 3/1.0 (-1) | 1,172 (-13%) | 6mo | $48,000 | $41 | 40 |
Match score weights: distance 35% · size 25% · config 20% · recency 20%. Top-matched comps best support the ARV.
Projected returns pro-forma
-3.0% appreciation · 5.59% rent growth · sell at horizon
- IRR
- —
- Equity multiple
- 6.74×
- Total profit
- $56,228
- Equity at exit
- $5,219
- IRR
- —
- Equity multiple
- 15.35×
- Total profit
- $140,582
- Equity at exit
- $3,026
Cash invested: $9,800 (down + closing). Projections, not guarantees.
Landlord ↔ Tenant lean methodology
- Overall (STATE)
- 62 Landlord-Friendly
- State Michigan
- 62 Landlord-Friendly · EVEN
- County
- — inherits STATE
- City
- — inherits STATE
ZIP-level market 48227
- Rents YoY
- 5.6%
- Active inventory
- 385
- Price-to-rent
- 2.0×
Monthly cashflow live
- Estimated rent
- $1,458 high interval (Pro) →
- Mortgage (P&I)
- −$184
- Tax est. 1.5%
- −$44 /mo · $525/yr
- Insurance
- −$15
- HOA
- −$0
- Vacancy / Maint / Mgmt
- −$306
- Net cashflow
- $910
Break-even live
UW: 25.0% down · 7.5% · 30yr · 1.5% tax · 5.0% vac · 8.0% maint · 8.0% mgmt
Financing live
Cash to close
- Down payment
- $8,750
- Closing costs
- $1,050
- Reserves months
- —
- Total cash needed
- —
Loan-product check · same deal, 3 products live
Conventional
25% down · 7.5% · 30yr
- Down + closing
- —
- Monthly P&I
- —
- Monthly cashflow
- —
- DSCR
- —
- Eligible?
- —
Personal DTI + credit; lowest rate.
DSCR
20% down · 8.5% · 30yr
- Down + closing
- —
- Monthly P&I
- —
- Monthly cashflow
- —
- DSCR
- —
- Eligible?
- —
No personal income docs; deal must DSCR.
Hard money
10% down · 12.0% · 12mo
- Down + closing
- —
- Monthly P&I
- —
- Monthly cashflow
- —
- DSCR
- —
- Eligible?
- —
Short-term bridge; refi at stabilization.
Rent comps 31 comps
| Address | Beds | Baths | Sqft | Rent | $/sqft | DOM | Units | Dist |
|---|---|---|---|---|---|---|---|---|
| 9340 Hartwell St Detroit, MI | 3.0 | 1.0 | 1000 | $1,364 | $1.36 | 43d | 1 | 0.23mi |
| 9355 Ward St Detroit, MI | 3.0 | 1.0 | 1200 | $1,327 | $1.11 | 43d | 1 | 0.37mi |
| 9501 Lauder St Detroit, MI | 3.0 | 2.0 | 1152 | $1,350 | $1.17 | 43d | 1 | 0.51mi |
| 9558 Meyers Rd Detroit, MI | 3.0 | 1.0 | 950 | $1,150 | $1.21 | 43d | 1 | 0.64mi |
| 11431 Marlowe St Detroit, MI | 3.0 | 1.0 | 1172 | $1,400 | $1.19 | 16d | 1 | 0.64mi |
| 9386 Coyle St Detroit, MI | 3.0 | 1.0 | 1000 | $1,300 | $1.30 | 1d | 1 | 0.66mi |
| 10015 Robson St Detroit, MI | 3.0 | 2.0 | 1000 | $1,400 | $1.40 | 17d | 1 | 0.68mi |
| 9546 Sussex St Detroit, MI | 3.0 | 1.0 | 1000 | $1,400 | $1.40 | 43d | 1 | 0.70mi |
| 10002 Manor Unit 2 Detroit, MI | 3.0 | 1.0 | 1100 | $1,150 | $1.05 | 43d | 1 | 0.75mi |
| 9209 Pinehurst St Detroit, MI | 3.0 | 1.0 | 1589 | $1,500 | $0.94 | 43d | 1 | 0.77mi |
| 12039 Lauder St Detroit, MI | 3.0 | 1.5 | 1000 | $1,500 | $1.50 | 24d | 1 | 0.84mi |
| 11634 Sussex St Detroit, MI | 3.0 | 1.0 | 1091 | $1,326 | $1.22 | 24d | 1 | 0.88mi |
| 11397 Whitcomb St Detroit, MI | 3.0 | 1.0 | 1070 | $1,400 | $1.31 | 16d | 1 | 0.89mi |
| 11393 Prest St Detroit, MI | 3.0 | 1.0 | 900 | $1,550 | $1.72 | 16d | 1 | 0.94mi |
| 8604 Whitcomb St Detroit, MI | 3.0 | 2.0 | 1033 | $1,300 | $1.26 | 43d | 1 | 0.96mi |
| 8212 Lauder St Detroit, MI | 3.0 | 1.0 | 1026 | $1,150 | $1.12 | 43d | 1 | 0.96mi |
| 9973 Winthrop St Detroit, MI | 3.0 | 1.0 | 960 | $1,400 | $1.46 | 43d | 1 | 0.99mi |
| 8114 Marlowe St Unit home Detroit, MI | 3.0 | 1.0 | 985 | $1,350 | $1.37 | 43d | 1 | 1.00mi |
| 9936 Montrose St Detroit, MI | 3.0 | 1.0 | 963 | $1,200 | $1.25 | 16d | 1 | 1.01mi |
| 9222 Forrer St Detroit, MI | 3.0 | 1.0 | 947 | $1,450 | $1.53 | 16d | 1 | 1.05mi |
| 8331 Whitcomb St Detroit, MI | 4.0 | 1.0 | 1342 | $1,350 | $1.01 | 21d | 1 | 1.06mi |
| 8047 Robson St Detroit, MI | 3.0 | 2.0 | 1184 | $1,200 | $1.01 | 43d | 1 | 1.15mi |
| 12778 Strathmoor St Detroit, MI | 3.0 | 1.0 | 1597 | $1,150 | $0.72 | 4d | 1 | 1.20mi |
| 9589 Mansfield St Detroit, MI | 4.0 | 1.0 | 1250 | $1,500 | $1.20 | 4d | 1 | 1.21mi |
| 12754 Marlowe St Detroit, MI | 3.0 | 2.0 | 1008 | $1,400 | $1.39 | 16d | 1 | 1.21mi |
| 9220 Mansfield St Detroit, MI | 3.0 | 1.0 | 1200 | $1,300 | $1.08 | 43d | 1 | 1.22mi |
| 11641 Mansfield St Unit 2 Detroit, MI | 3.0 | 1.0 | 1449 | $1,300 | $0.90 | 43d | 1 | 1.32mi |
| 12144 Washburn St Detroit, MI | 3.0 | 1.0 | 1200 | $1,200 | $1.00 | 14d | 1 | 1.33mi |
| 12650 Griggs St Detroit, MI | 3.0 | 2.0 | 1628 | $1,375 | $0.84 | 24d | 1 | 1.42mi |
| 13331 Strathmoor St Detroit, MI | 3.0 | 1.0 | 1084 | $1,100 | $1.01 | 16d | 1 | 1.43mi |
| 13279 Coyle St Detroit, MI | 3.0 | 1.0 | 1444 | $1,373 | $0.95 | 43d | 1 | 1.50mi |
Listing history 10 events
-
2026-06-18days on market $35,000 Active 14 DOM
-
2026-06-17days on market $35,000 Active 13 DOM
-
2026-06-15days on market $35,000 Active 11 DOM
-
2026-06-13days on market $35,000 Active 9 DOM
-
2026-06-13days on market $35,000 Active 8 DOM
-
2026-06-09days on market $35,000 Active 5 DOM
-
2026-06-08days on market $35,000 Active 4 DOM
-
2026-06-07days on market $35,000 Active 3 DOM
-
2026-06-04remarks 195-char remark
-
2026-06-04$35,000 Active 1 DOM
ⓘ Source: listings_history table (triggers on properties + properties_extension) + one-shot
backfill from property_details.listing_events for pre-trigger history.
Climate risk First Street
- Flood 1/10 Low FEMA zone X (unshaded) · 0% chance over 30 yrs
- Wildfire 1/10 Low
- Heat 3/10 Moderate 7 d/yr ≥97°F today · 15 d/yr by 30 yrs out
- Wind 2/10 Low
- Air quality 3/10 Moderate 2 unhealthy d/yr today · 5 by 30 yrs out
Nearby sold comps map
Loading sold comps map…
Walkable amenities ~0.75 mi
Loading nearby amenities…
Taxation est. · year 1
- Rental income
- $17,502
- − Mortgage interest
- −$1,961
- − Property taxes
- −$525
- − Insurance
- −$175
- − Repairs & maintenance
- −$1,400
- − Management
- −$1,400
- − Depreciation
- −$1,018
- Taxable income
- $11,023
- Est. tax owed @ 24.0%
- −$2,645
- After-tax cash flow
- $8,278/yr
For passive investors: Depreciation is non-cash, so a rental often shows a tax loss while cash-flowing — sheltering income. Rental losses are passive: they offset passive income freely, and up to $25,000/yr can offset ordinary (W-2) income if you actively participate and your MAGI is under $100k (phasing out to $0 by $150k); unused losses carry forward. On sale, claimed depreciation is recaptured at up to 25%, and gains may owe capital-gains tax (a 1031 exchange can defer both). Figures are a year-1 estimate at your 24.0% rate — not tax advice; consult a CPA.
Schools (NCES district)
- District
- Detroit Public Schools Community District
- NCES district ID
- 2601103
- Math proficiency
- 10% ▼ -2.00%
- Reading proficiency
- 24% ▲ 6.00%
- Median HH income
- $25,815
- Composite
- 13.06/100
- National rank
- #9564
- State rank
- #499 of 540 in MI
Livability — Detroit
- Score
- 73/100
- State rank
- #218
- US rank
- #5427
Category grades
Schools grade is shown separately in the Schools card above.
Census & demographics
- Census place
- Detroit, MI
- County
- Wayne County · 1,562,939 people
- City population
- 572,865
- Metro
- Detroit-Warren-Dearborn, MI
- Population (ZIP)
- 40,302
- Household income
- $36,527
- Rent vs Own
- Severe rent burden
- 2371.0
Population outlook (Wayne County) Hauer SSP2
- Today (2025)
- 1,675,273 people
- By 2030
- 1,620,300 · -3.3%
- By 2040
- 1,502,341 · -10.3%
- By 2050
- 1,384,039 · -17.4%
- By 2075
- 1,124,592 · -32.9%
- By 2100
- 881,193 · -47.4%
Race, ethnicity, and origin ACS 2023
- Neighborhood character
- Predominantly Black (95%)
- Race & ethnicity
- Black 95% Two or more races 3% White 1%
- Foreign-born
- 1%
- Languages at home
- 98% English-only · Spanish 1% French/Haitian/Cajun 1%
Political lean MEDSL · Wayne
- 2024 margin
- Strong D (+29.0) · D 62.7% · R 33.7% · Other 3.6%
- 2008→2024 swing
- -20.5pp toward R · 2008: 49.5pp · 2024: 29.0pp
- All cycles
- 2024: D+29.0 2020: D+38.1 2016: D+37.3 2012: D+46.9 2008: D+49.5
Not yet ingested
- Civics
- —
Market trends
- HPI YoY
- ▼ -125.00%
- Current HPI
- 186.4158
- Rent YoY
- ▲ 5.59%
- Metro
- Detroit-Warren-Dearborn, MI
- State GDP YoY
- ▲ 1.37%
- F500 in state
- 28
Industry mix (Fortune 500 HQ in MI)
| Industry | F500 HQs | Revenue |
|---|---|---|
| Automotive Parts | 3 | $48B |
|
||
| Automotive | 2 | $372B |
|
||
| Chemicals | 1 | $45B |
|
||
| Automotive Retail | 1 | $29B |
|
||
| Healthcare / Medical Devices | 1 | $23B |
|
||
| Automotive Technology | 1 | $20B |
|
||
Price history
+586.3% since first listed34 events — show timeline
- 2026-06-04 Listed $35,000 ForSaleByOwner.com
- 2016-09-23 Listing Removed — REALCOMP
- 2016-08-05 Pending — REALCOMP
- 2016-08-01 Listing Removed — REALCOMP
- 2016-07-15 Pending — REALCOMP
- 2016-07-12 Listing Removed — REALCOMP
- 2016-07-08 Pending — MiRealSource-MiMLS
- 2016-07-08 Pending — REALCOMP
- 2016-07-08 Listing Removed — MiRealSource-MiMLS
- 2016-06-24 Price Changed $7,999 MiRealSource-MiMLS
- 2016-06-23 Price Changed $7,999 REALCOMP
- 2016-06-22 Price Changed $8,799 MiRealSource-MiMLS
- 2016-06-20 Price Changed $8,799 REALCOMP
- 2016-06-10 Price Changed $9,999 MiRealSource-MiMLS
- 2016-06-10 Price Changed $9,999 REALCOMP
- 2016-05-12 Price Changed $12,500 MiRealSource-MiMLS
- 2016-05-11 Price Changed $12,500 REALCOMP
- 2016-05-05 Listed $17,999 MiRealSource-MiMLS
- 2016-05-04 Listed $17,999 REALCOMP
- 2016-01-01 Listing Removed — REALCOMP
- 2015-12-31 Listing Removed — MiRealSource-MiMLS
- 2015-12-31 Listing Removed — MiRealSource-MiMLS
- 2015-12-08 Price Changed $15,000 REALCOMP
- 2015-10-12 Listed $750 MiRealSource-MiMLS
- 2015-08-17 Price Changed $19,000 REALCOMP
- 2015-07-06 Price Changed $21,000 REALCOMP
- 2015-06-05 Price Changed $23,000 REALCOMP
- 2015-05-05 Listed $25,000 REALCOMP
- 2015-05-05 Listed $15,000 MiRealSource-MiMLS
- 2008-07-30 Listing Removed — MiRealSource-MiMLS
- 2008-06-16 Listing Removed — REALCOMP
- 2008-04-30 Listed $5,100 REALCOMP
- 2008-04-30 Listed $5,100 REALCOMP
- 2008-04-30 Listed $5,100 MiRealSource-MiMLS
Property tax history
+5.3%/yrLatest (2025): $2,013 · +1.1% YoY. Source: county tax records.
Cash-flow waterfall
monthlySold comps — $/sqft
last 12 mo · ≤1 miLoading sold comps…