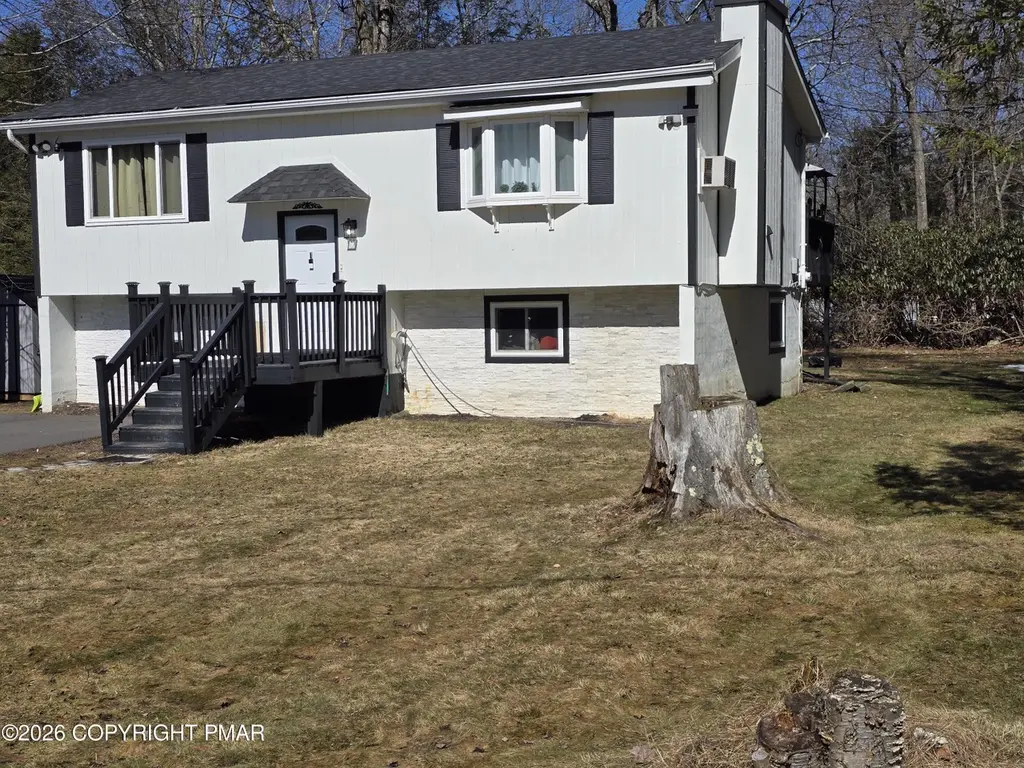
8111 Coco Dr · Mount Pocono, PA
Flood risk 1/10 · Minimal
- FEMA flood zone
- X (unshaded)
- Chance of flooding over 30 yrs
- 0.0%
- Est. flood insurance / yr
- $473 – $860
Fire risk 1/10 · Minimal
- Est. fire insurance / yr
- $511 – $949
Heat risk 2/10 · Minimal
- Hot days now (above 89°F)
- 7 days/yr
- Hot days in 30 yrs
- 15 days/yr
Wind risk 3/10 · Minor
- Chance of severe wind over 30 yrs
- 6.0%
Air-quality risk 2/10 · Minimal
- Unhealthy air days now
- 1 days/yr
- Unhealthy air days in 30 yrs
- 2 days/yr
Risk factors via First Street. Map © Google.
Why this score? — see what drove the F grade
The composite is a weighted blend of 9 inputs, each scored 0–100. Each bar is that input's sub-score; the figure is the points it added to the 100-point composite (weight × sub-score).
- Cash flow +7.1/30.0
- Appreciation +5.8/10.0
- Schools +4.0/10.0
- Livability +3.9/5.0
- Rent growth +2.5/5.0
- Condition / age +2.5/5.0
- 1% rule +1.4/10.0
- DSCR +1.3/10.0
- ARV discount +0.7/15.0
$350,000
🖨 Deal sheet 📄 Offer letter ✓ Due diligence
Listing remarks
WELCOME HOME TO THIS BEAUTIFULLY RENOVATED 4-BEDROOM, 2 BATH BI-LEVEL THAT PERFECTLY BLENDS COMFORT, STYLE, AND FUNCTIONALITY! FROM THE MOMENT YOU PULL INTO THE PAVED DRIVEWAY WITH PARKING FOR UP TO 6 CARS, YOU'LL APPRECIATE THE PRIDE OF OWNERSHIP AND THOUGHTFUL UPDATED THROUGHOUT. INSIDE, YOU'LL FIND SPACIOUS LIVING AREAS, SPACIOUS LIVING AREAS, MODERN FINISHES, AND A LAYOUT IDEAL FOR BOTH EVERYDAY LIVING AND ENTERTAINING. THE HOME FEATURES A NEWER ROOF REPLACED IN 2021, GIVING A BUYERS ADDED PEACE OF MIND. STEP OUTSIDE AND ENJOY YOUR OWN PRIVATE OUTDOOR RETREAT WITH FRONT AND BACK YARDS, PLUS A REAR DECK THAT'S PERFECT FOR GRILLING, RELAXING, AND HOSTING GATHRINGS WITH FAMILY AND FRIENDS.
Key facts
- 0.3 acre lot
- 6 parking spots
- Community pool
Property features AI
Finance
- Other: Subdivision: Stillwater Estates; GPS-friendly directions
- HOA & community: Homeowners association with annual fee ($875) covering electricity and security; Community amenities include security and a pool
Exterior
- Parking: Open parking for 6 vehicles
- Security: 24-hour security; Carbon monoxide detector; Fire alarm
- Utilities: Well water; Septic tank; 200+ amp electric service; Phone connected; Cable connected
- Home design: Single-family house; Residential property
- Construction: Asphalt roof; DC well pump
- Exterior features: Deck; Front yard; Paved road; Private maintained road
Interior
- Kitchen: Electric range; Refrigerator; Dishwasher; Portable dishwasher
- Bathrooms: 2 full bathrooms
- Heating & cooling: Electric heating; Ceiling fans (cooling); Wall/window air conditioning units
- Interior features: Ceiling fans; Fireplace (1)
- Laundry & utility: Washer; Dryer
Neighborhood map
What this means for you Summary
Snapshot
- This is a 3-bed/2.0-bath single-family listed at $350k.
Deal economics
- At list price, monthly cash flow is $-503 ($-6k/yr) — negative.
- To cash-flow at today's rent, offer at most $261k (25.4% below list).
- To meet the 1% rule (rent ≥ 1% of price), the offer needs to be $225k (35.8% below list).
- Recommended offer: $225k (35.8% below list) — sets the bar for 1% rule.
Location & tenants
- Location reads 77/100 on livability (#362 in PA, #3,166 nationally) — a middle-class / working-renter tenant base. Strengths: crime A+, cost of living A+, housing A+; Watch: schools F, commute F.
- Pocono Mountain SD (rural): math 37% / reading 55% proficiency, ranked #245 of 539 in PA (top 46%) — families likely to look elsewhere, expect single-tenant / working-renter base with shorter leases.
- Market conditions: 57 active listings in the ZIP; 278 units permitted in Monroe County in 2024 (52 in 5+ unit buildings).
Forward outlook
- In year one you build about $8k of equity ($2k loan paydown + $5k appreciation (1.5% local appreciation)).
- Monroe County population projected at -11% by 2050 — secular population decline; favor cash flow + early exit over multi-decade hold.
- By year 5, paydown + projected appreciation supports a ~$35k cash-out refi (75% LTV) — recoverable capital for the next deal without selling this one.
Negotiation context
- It's been on market 34 days — a 3% lower offer ($340k) is reasonable based on typical stale-listing flexibility.
- 5 sale attempts since 12y ago; this cycle's ask has dropped $50k (12%) from the opening price — seller is motivated, your offer sets the floor, not the list.
- Current owner paid $159k; list at $350k implies a 120% gain — meaningful room to come down on a strong offer.
Questions for the listing agent
- What do current leases actually rent for vs. the listed asking? Can we see a recent rent roll and the last 12 months of T-12 income?
- It's been on market 34 days. Have you received any prior offers? Is the seller open to a 36% concession, seller financing, or rate buy-down credit?
- What does the HOA fee cover, when was the last increase, and are there any pending special assessments or reserve-fund shortfalls?
- Is there a deadline driving the sale (1031 exchange, divorce, estate, relocation)? That informs how much negotiation room exists.
- Schools are F-rated, which usually means shorter tenancies and higher turnover. Who's the typical renter profile here, and what's been the actual vacancy rate?
- The area grade is low — what's the realistic commute time and amenity access for the typical tenant pool here? Any planned neighborhood developments (good or bad) we should know about?
- What's the average days-on-market for RENTAL listings here right now (not sales)? A rising rental-DOM trend means longer vacancies and softer asking-rent achievability than the comps imply.
- What's the recent tenant-quality profile in this submarket — average credit score on applications, eviction rate, late-payment / NSF rate, and stable-employment percentage? A property-management company in the area should have these aggregated.
- How much new for-sale + rental construction is in the pipeline within 1–3 miles? Heavy new supply typically softens prices + rents 12–24 months out; constrained supply supports both.
Investment metrics
- 1% rule
- 0.64% ✗
- Cap rate
- 4.57%
- Cash-on-cash
- -6.15%
- DSCR
- 0.73
- GRM
- 13.0
CMA / ARV
- ARV (on-the-fly)
- $304,200
- Comps found
- 8
Show comp detail 8 sales within ~0.75 mi
| Address | Dist | Beds/Ba | Sqft | Sold | Price | $/sf | Match |
|---|---|---|---|---|---|---|---|
| 2150 Vacation Ln | 0.29mi | 3/1.0 | 920 (-2%) | 23mo | $189,900 | $206 | 61 |
| 105 Bobcat Trl | 0.52mi | 3/1.5 | 1,050 (+12%) | 3mo | $370,000 | $352 | 51 |
| 328 Sidney Ave | 0.64mi | 2/1.0 (-1) | 968 (+3%) | 14mo | $315,000 | $325 | 44 |
| 171 Linden Loop | 0.73mi | 2/1.0 (-1) | 864 (-8%) | 3mo | $190,000 | $220 | 41 |
| 1144 Lexington Ave | 0.58mi | 2/1.0 (-1) | 1,033 (+10%) | 12mo | $350,000 | $339 | 37 |
| 2121 Freedom Way | 0.72mi | 3/1.0 | 984 (+5%) | 21mo | $226,000 | $230 | 37 |
| 1172 Lexington Ave | 0.71mi | 2/1.0 (-1) | 1,040 (+11%) | 8mo | $450,000 | $433 | 33 |
| 210 Sutton Pl | 0.75mi | 2/1.0 (-1) | 854 (-9%) | 14mo | $205,000 | $240 | 30 |
Match score weights: distance 35% · size 25% · config 20% · recency 20%. Top-matched comps best support the ARV.
Projected returns pro-forma
1.54% appreciation · 3.0% rent growth · sell at horizon
- IRR
- -3.2%
- Equity multiple
- 0.83×
- Total profit
- $-16,239
- Equity at exit
- $129,357
- IRR
- 1.7%
- Equity multiple
- 1.22×
- Total profit
- $21,840
- Equity at exit
- $179,815
Cash invested: $98,000 (down + closing). Projections, not guarantees.
Landlord ↔ Tenant lean methodology
- Overall (STATE)
- 62 Landlord-Friendly
- State Pennsylvania
- 62 Landlord-Friendly · EVEN
- County
- — inherits STATE
- City
- — inherits STATE
ZIP-level market 18346
- Home prices YoY
- 0.8%
- Active inventory
- 57
- Price-to-rent
- 13.0×
Monthly cashflow live
- Estimated rent
- $2,248 medium interval (Pro) →
- Mortgage (P&I)
- −$1,835
- Tax from tax record
- −$224 /mo · $2,691/yr
- Insurance
- −$146
- HOA
- −$73
- Vacancy / Maint / Mgmt
- −$472
- Net cashflow
- $-503
Break-even live
UW: 25.0% down · 7.5% · 30yr · 1.5% tax · 5.0% vac · 8.0% maint · 8.0% mgmt
Financing live
Cash to close
- Down payment
- $87,500
- Closing costs
- $10,500
- Reserves months
- —
- Total cash needed
- —
Loan-product check · same deal, 3 products live
Conventional
25% down · 7.5% · 30yr
- Down + closing
- —
- Monthly P&I
- —
- Monthly cashflow
- —
- DSCR
- —
- Eligible?
- —
Personal DTI + credit; lowest rate.
DSCR
20% down · 8.5% · 30yr
- Down + closing
- —
- Monthly P&I
- —
- Monthly cashflow
- —
- DSCR
- —
- Eligible?
- —
No personal income docs; deal must DSCR.
Hard money
10% down · 12.0% · 12mo
- Down + closing
- —
- Monthly P&I
- —
- Monthly cashflow
- —
- DSCR
- —
- Eligible?
- —
Short-term bridge; refi at stabilization.
HOA detail
- Monthly dues
- $73 · $876/yr
Listing history 22 events
-
2026-06-19days on market $350,000 Active 34 DOM
-
2026-06-18days on market $350,000 Active 33 DOM
-
2026-06-17days on market $350,000 Active 32 DOM
-
2026-06-16days on market $350,000 Active 31 DOM
-
2026-06-15days on market $350,000 Active 30 DOM
-
2026-06-14days on market $350,000 Active 28 DOM
-
2026-06-13days on market $350,000 Active 27 DOM
-
2026-06-10days on market $350,000 Active 25 DOM
-
2026-06-09days on market $350,000 Active 24 DOM
-
2026-06-08days on market $350,000 Active 23 DOM
-
2026-06-07days on market $350,000 Active 22 DOM
-
2026-06-02days on market $350,000 Active 17 DOM
-
2026-06-01days on market $350,000 Active 16 DOM
-
2026-05-31days on market $350,000 Active 15 DOM
-
2026-05-30days on market $350,000 Active 14 DOM
-
2026-05-17$399,900 Active
-
2026-05-16$350,000 Active
-
2019-04-19soldstatus $159,000
-
2018-12-20$162,400
-
2018-10-25soldstatus $60,100
-
2018-07-27$73,900
-
2014-12-08$88,900
ⓘ Source: listings_history table (triggers on properties + properties_extension) + one-shot
backfill from property_details.listing_events for pre-trigger history.
Tax reassessment forecast PA · Partial reset (capped growth)
- Current annual tax
- $2,691 · $224/mo
- Projected year-2 tax
- $4,111 · $343/mo
- Expected delta
- +$1,419/yr (+$118/mo · 52.7%)
ⓘ Screening estimate from a state-policy table — verify with the county assessor before closing.
Climate risk First Street
- Flood 1/10 Low FEMA zone X (unshaded) · 0% chance over 30 yrs
- Wildfire 1/10 Low
- Heat 2/10 Low 7 d/yr ≥89°F today · 15 d/yr by 30 yrs out
- Wind 3/10 Moderate 6% chance of damaging wind over 30 yrs
- Air quality 2/10 Low 1 unhealthy d/yr today · 2 by 30 yrs out
Nearby sold comps map
Loading sold comps map…
Walkable amenities ~0.75 mi
Loading nearby amenities…
Taxation est. · year 1
- Rental income
- $26,976
- − Mortgage interest
- −$19,605
- − Property taxes
- −$2,691
- − Insurance
- −$1,750
- − Repairs & maintenance
- −$2,158
- − Management
- −$2,158
- − HOA
- −$876
- − Depreciation
- −$10,182
- Taxable loss
- −$12,445
- Est. tax savings @ 24.0%
- +$2,987
- After-tax cash flow
- $-3,045/yr
For passive investors: Depreciation is non-cash, so a rental often shows a tax loss while cash-flowing — sheltering income. Rental losses are passive: they offset passive income freely, and up to $25,000/yr can offset ordinary (W-2) income if you actively participate and your MAGI is under $100k (phasing out to $0 by $150k); unused losses carry forward. On sale, claimed depreciation is recaptured at up to 25%, and gains may owe capital-gains tax (a 1031 exchange can defer both). Figures are a year-1 estimate at your 24.0% rate — not tax advice; consult a CPA.
Schools (NCES district)
- District
- Pocono Mountain SD
- NCES district ID
- 4219500
- Math proficiency
- 37% ▼ -5.00%
- Reading proficiency
- 55% ▲ 1.00%
- Median HH income
- $55,317
- Composite
- 39.91/100
- National rank
- #3856
- State rank
- #245 of 539 in PA
Livability — Mount Pocono
- Score
- 77/100
- State rank
- #362
- US rank
- #3166
Category grades
Schools grade is shown separately in the Schools card above.
Census & demographics
- Population (ZIP)
- 2,316
Population outlook (Monroe County) Hauer SSP2
- Today (2025)
- 164,099 people
- By 2030
- 161,412 · -1.6%
- By 2040
- 154,616 · -5.8%
- By 2050
- 146,710 · -10.6%
- By 2075
- 140,830 · -14.2%
- By 2100
- 138,472 · -15.6%
Race, ethnicity, and origin ACS 2023
- Neighborhood character
- Diverse neighborhood (Simpson 0.65)
- Race & ethnicity
- White 48% Black 28% Hispanic / Latino 19% Two or more races 12%
- Hispanic origin (detail)
- Cuban 2% Dominican 3%
- Common ancestry
- Russian 8% Romanian 6% Slovak 5%
- Foreign-born
- 20% · Canada
- Languages at home
- 77% English-only · Spanish 19% Russian/Polish/Slavic 4%
Political lean MEDSL · Monroe
- 2024 margin
- Toss-up / Even · D 49.1% · R 49.9%
- 2008→2024 swing
- -17.1pp toward R · 2008: 16.3pp · 2024: -0.8pp
- All cycles
- 2024: R+0.8 2020: D+6.4 2016: D+0.3 2012: D+14.0 2008: D+16.3
Not yet ingested
- Civics
- —
Market trends
- HPI YoY
- ▲ 1.54%
- Current HPI
- 189.8011
- Rent YoY
- —
- Metro
- —
- State GDP YoY
- ▲ 1.68%
- F500 in state
- 34
Industry mix (Fortune 500 HQ in PA)
| Industry | F500 HQs | Revenue |
|---|---|---|
| Healthcare | 2 | $309B |
|
||
| Insurance | 2 | $27B |
|
||
| Telecommunications / Media | 1 | $124B |
|
||
| Industrial Distribution | 1 | $22B |
|
||
| Financial Services | 1 | $20B |
|
||
| Chemicals / Materials | 1 | $18B |
|
||
Price history
+349.8% since first listed7 events — show timeline
- 2026-05-17 Listed $399,900 PMAR
- 2026-05-16 Listed $350,000 PMAR
- 2019-04-19 Sold (MLS) $159,000 PMAR
- 2018-12-20 Listed $162,400 PMAR
- 2018-10-25 Sold (MLS) $60,100 PMAR
- 2018-07-27 Listed $73,900 PMAR
- 2014-12-08 Listed $88,900 PMAR
Property tax history
-1.1%/yrLatest (2026): $2,691 · +3.2% YoY. Source: county tax records.
Cash-flow waterfall
monthlySold comps — $/sqft
last 12 mo · ≤1 miLoading sold comps…