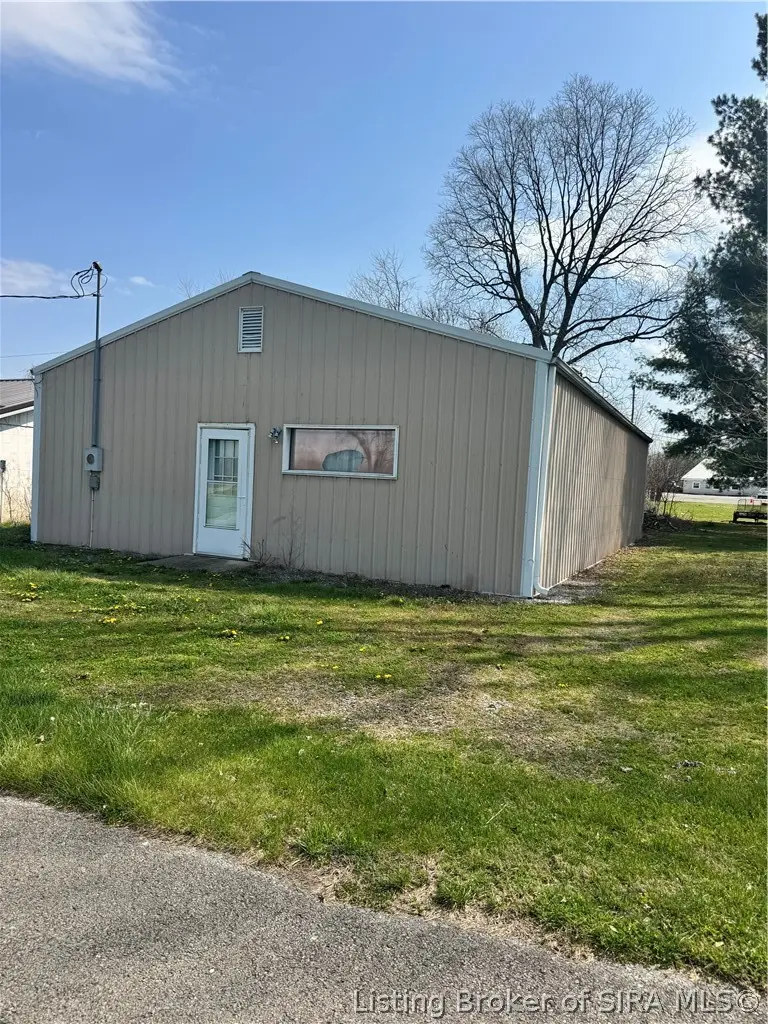
232 S Posey St · Campbellsburg, IN
Flood risk 1/10 · Minimal
- FEMA flood zone
- X (unshaded)
- Chance of flooding over 30 yrs
- 0.0%
- Est. flood insurance / yr
- $507 – $1,088
Fire risk 1/10 · Minimal
- Est. fire insurance / yr
- $717 – $1,331
Heat risk 4/10 · Minor
- Hot days now (above 104°F)
- 7 days/yr
- Hot days in 30 yrs
- 19 days/yr
Wind risk 2/10 · Minimal
- Chance of severe wind over 30 yrs
- 2.0%
Air-quality risk 2/10 · Minimal
- Unhealthy air days now
- 1 days/yr
- Unhealthy air days in 30 yrs
- 2 days/yr
Risk factors via First Street. Map © Google.
Why this score? — see what drove the B grade
The composite is a weighted blend of 9 inputs, each scored 0–100. Each bar is that input's sub-score; the figure is the points it added to the 100-point composite (weight × sub-score).
- Cash flow +27.4/30.0
- ARV discount +15.0/15.0
- DSCR +9.6/10.0
- 1% rule +7.1/10.0
- Schools +3.5/10.0
- Livability +3.2/5.0
- Rent growth +2.5/5.0
- Condition / age +2.5/5.0
- Appreciation +0.0/10.0
$79,000
🖨 Deal sheet 📄 Offer letter ✓ Due diligence
Listing remarks
Prime Opportunity in the Heart of Campbellsburg - Positioned right on S Posey Street in downtown Campbellsburg, this versatile property is a rare find for investors, entrepreneurs, or anyone looking to plant a flag in a small-town. Zoned and situated for possibility; ideal for a small business, office, boutique retail, or service-based operation. Has income potential to convert or maintain as a rental property with strong affordability appeal. Visibility, accessibility, and that classic small-town charm. It is budget-friendly at just $79,000, the numbers make sense for investors and owner-operators alike. It is a blank canvas and ready for updates, customization, or a creative mixed-use vis
Key facts
- Zoned and situated
- Income potential
- Versatile property
Tags
Property features AI
Finance
- Financial info: Annual taxes approximately $952
Exterior
- Home design: Single-family property; 750 above-grade finished area
- Exterior features: Lot zoned Agri/Residential
Interior
- Bathrooms: 1 full bathroom
- Interior features: Resale condition
Neighborhood map
What this means for you Summary
Snapshot
- This is a 4-bed/1.0-bath single-family listed at $79k.
Deal economics
- At list price, monthly cash flow is $231 ($3k/yr) — positive.
- The deal already cash-flows at list — no discount required.
- Meets the 1% rule at list price ($956 rent vs $79k).
- Recommended offer: $77k (3.0% below list) — sets the bar for market timing.
Location & tenants
- Location reads 64/100 on livability (#405 in IN) — a middle-class / working-renter tenant base. Strengths: cost of living A+, housing A+; Watch: employment C-, schools D+, crime D+.
- West Washington School Corporation (rural): math 41% / reading 43% proficiency, ranked #125 of 301 in IN (top 42%) — families likely to look elsewhere, expect single-tenant / working-renter base with shorter leases.
- Market conditions: 15 active listings in the ZIP; 25 units permitted in Washington County in 2024 (0 in 5+ unit buildings).
Forward outlook
- Local home prices are declining (-3.0%/yr); year-one equity from $546 of loan paydown is wiped out by about $2k of value loss. Plan a longer hold.
- Washington County population projected at -22% by 2050 — secular population decline; favor cash flow + early exit over multi-decade hold.
- At projected returns (-3.0% appreciation + 3.0% rent growth), your $22k cash investment doubles in ~10 years — after that, you're playing with house money.
Negotiation context
- It's been on market 56 days — a 3% lower offer ($77k) is reasonable based on typical stale-listing flexibility.
Questions for the listing agent
- It's been on market 56 days. Have you received any prior offers? Is the seller open to a 3% concession, seller financing, or rate buy-down credit?
- Is there a deadline driving the sale (1031 exchange, divorce, estate, relocation)? That informs how much negotiation room exists.
- Schools are D-rated, which usually means shorter tenancies and higher turnover. Who's the typical renter profile here, and what's been the actual vacancy rate?
- Crime grade is D in this area — have there been break-ins, vandalism, or insurance claims at this property in the last 3 years? What carrier currently insures it and at what premium?
- What's the average days-on-market for RENTAL listings here right now (not sales)? A rising rental-DOM trend means longer vacancies and softer asking-rent achievability than the comps imply.
- What's the recent tenant-quality profile in this submarket — average credit score on applications, eviction rate, late-payment / NSF rate, and stable-employment percentage? A property-management company in the area should have these aggregated.
- How much new for-sale + rental construction is in the pipeline within 1–3 miles? Heavy new supply typically softens prices + rents 12–24 months out; constrained supply supports both.
Investment metrics
- 1% rule
- 1.21% ✓
- Cap rate
- 9.80%
- Cash-on-cash
- 12.51%
- DSCR
- 1.56
- GRM
- 6.9
CMA / ARV
- ARV (median comp)
- $131,905
- List price
- $79,000
- Delta
- -40.11%
- Verdict
- UNDERPRICED
- Comps
- 3 within 1.0 mi
Projected returns pro-forma
-3.0% appreciation · 3.0% rent growth · sell at horizon
- IRR
- 2.2%
- Equity multiple
- 1.09×
- Total profit
- $1,887
- Equity at exit
- $11,779
- IRR
- 11.8%
- Equity multiple
- 1.93×
- Total profit
- $20,559
- Equity at exit
- $6,830
Cash invested: $22,120 (down + closing). Projections, not guarantees.
Landlord ↔ Tenant lean methodology
- Overall (STATE)
- 90 Strongly Landlord-Friendly
- State Indiana
- 90 Strongly Landlord-Friendly · R+11
- County
- — inherits STATE
- City
- — inherits STATE
ZIP-level market 47108
- Home prices YoY
- -18.8%
- Active inventory
- 15
- Price-to-rent
- 6.9×
Monthly cashflow live
- Estimated rent
- $956 medium interval (Pro) →
- Mortgage (P&I)
- −$414
- Tax from tax record
- −$77 /mo · $928/yr
- Insurance
- −$33
- HOA
- −$0
- Vacancy / Maint / Mgmt
- −$201
- Net cashflow
- $231
Break-even live
UW: 25.0% down · 7.5% · 30yr · 1.5% tax · 5.0% vac · 8.0% maint · 8.0% mgmt
Financing live
Cash to close
- Down payment
- $19,750
- Closing costs
- $2,370
- Reserves months
- —
- Total cash needed
- —
Loan-product check · same deal, 3 products live
Conventional
25% down · 7.5% · 30yr
- Down + closing
- —
- Monthly P&I
- —
- Monthly cashflow
- —
- DSCR
- —
- Eligible?
- —
Personal DTI + credit; lowest rate.
DSCR
20% down · 8.5% · 30yr
- Down + closing
- —
- Monthly P&I
- —
- Monthly cashflow
- —
- DSCR
- —
- Eligible?
- —
No personal income docs; deal must DSCR.
Hard money
10% down · 12.0% · 12mo
- Down + closing
- —
- Monthly P&I
- —
- Monthly cashflow
- —
- DSCR
- —
- Eligible?
- —
Short-term bridge; refi at stabilization.
Listing history 17 events
-
2026-06-19days on market $79,000 Active 56 DOM
-
2026-06-18days on market $79,000 Active 55 DOM
-
2026-06-17days on market $79,000 Active 54 DOM
-
2026-06-16days on market $79,000 Active 53 DOM
-
2026-06-15days on market $79,000 Active 52 DOM
-
2026-06-14days on market $79,000 Active 50 DOM
-
2026-06-12days on market $79,000 Active 49 DOM
-
2026-06-09days on market $79,000 Active 46 DOM
-
2026-06-08days on market $79,000 Active 45 DOM
-
2026-06-07days on market $79,000 Active 44 DOM
-
2026-06-05days on market $79,000 Active 42 DOM
-
2026-06-03days on market $79,000 Active 40 DOM
-
2026-06-02days on market $79,000 Active 39 DOM
-
2026-06-01days on market $79,000 Active 38 DOM
-
2026-05-31days on market $79,000 Active 37 DOM
-
2026-05-30days on market $79,000 Active 36 DOM
-
2026-04-22$79,000 Active 1090-char remark
ⓘ Source: listings_history table (triggers on properties + properties_extension) + one-shot
backfill from property_details.listing_events for pre-trigger history.
Tax reassessment forecast IN · Partial reset (capped growth)
- Current annual tax
- $928 · $77/mo
- Projected year-2 tax
- $928 · $77/mo
- Expected delta
- $0/yr ($0/mo · 0.0%)
ⓘ Screening estimate from a state-policy table — verify with the county assessor before closing.
Climate risk First Street
- Flood 1/10 Low FEMA zone X (unshaded) · 0% chance over 30 yrs
- Wildfire 1/10 Low
- Heat 4/10 Moderate 7 d/yr ≥104°F today · 19 d/yr by 30 yrs out
- Wind 2/10 Low 2% chance of damaging wind over 30 yrs
- Air quality 2/10 Low 1 unhealthy d/yr today · 2 by 30 yrs out
Nearby sold comps map
Loading sold comps map…
Walkable amenities ~0.75 mi
Loading nearby amenities…
Taxation est. · year 1
- Rental income
- $11,470
- − Mortgage interest
- −$4,425
- − Property taxes
- −$928
- − Insurance
- −$395
- − Repairs & maintenance
- −$918
- − Management
- −$918
- − Depreciation
- −$2,298
- Taxable income
- $1,589
- Est. tax owed @ 24.0%
- −$381
- After-tax cash flow
- $2,386/yr
For passive investors: Depreciation is non-cash, so a rental often shows a tax loss while cash-flowing — sheltering income. Rental losses are passive: they offset passive income freely, and up to $25,000/yr can offset ordinary (W-2) income if you actively participate and your MAGI is under $100k (phasing out to $0 by $150k); unused losses carry forward. On sale, claimed depreciation is recaptured at up to 25%, and gains may owe capital-gains tax (a 1031 exchange can defer both). Figures are a year-1 estimate at your 24.0% rate — not tax advice; consult a CPA.
Schools (NCES district)
- District
- West Washington School Corporation
- NCES district ID
- 1812930
- Math proficiency
- 41% ▼ -15.00%
- Reading proficiency
- 43% ▼ -15.00%
- Median HH income
- $42,006
- Composite
- 35.39/100
- National rank
- #4949
- State rank
- #125 of 301 in IN
Livability — Campbellsburg
- Score
- 64/100
- State rank
- #405
- US rank
- #14778
Category grades
Schools grade is shown separately in the Schools card above.
Census & demographics
- Census place
- Campbellsburg, IN
- City population
- 2,003
- Population (ZIP)
- 2,003
Population outlook (Washington County) Hauer SSP2
- Today (2025)
- 26,460 people
- By 2030
- 25,498 · -3.6%
- By 2040
- 23,127 · -12.6%
- By 2050
- 20,505 · -22.5%
- By 2075
- 14,941 · -43.5%
- By 2100
- 10,453 · -60.5%
Race, ethnicity, and origin ACS 2023
- Neighborhood character
- Predominantly White (92%)
- Race & ethnicity
- White 92% Two or more races 5%
- Common ancestry
- Scottish 2% Lithuanian 2% Slovak 1%
Political lean MEDSL · Washington
- 2024 margin
- Solid R (+54.8) · D 21.7% · R 76.5% · Other 1.7%
- 2008→2024 swing
- -37.5pp toward R · 2008: -17.3pp · 2024: -54.8pp
- All cycles
- 2024: R+54.8 2020: R+52.1 2016: R+49.1 2012: R+24.4 2008: R+17.3
Not yet ingested
- Civics
- —
Market trends
- HPI YoY
- ▼ -42.69%
- Current HPI
- 184.4
- Rent YoY
- —
- Metro
- —
- State GDP YoY
- ▲ 2.90%
- F500 in state
- 18
Industry mix (Fortune 500 HQ in IN)
| Industry | F500 HQs | Revenue |
|---|---|---|
| Industrial Machinery | 2 | $37B |
|
||
| Healthcare | 1 | $177B |
|
||
| Pharmaceuticals | 1 | $45B |
|
||
| Metals / Steel | 1 | $18B |
|
||
| Agriculture | 1 | $17B |
|
||
| Packaging | 1 | $12B |
|
||
Price history
1 event — show timeline
- 2026-04-22 Listed $79,000 SIRA
Property tax history
+15.7%/yrLatest (2024): $928 · +16.6% YoY. Source: county tax records.
Cash-flow waterfall
monthlySold comps — $/sqft
last 12 mo · ≤1 miLoading sold comps…