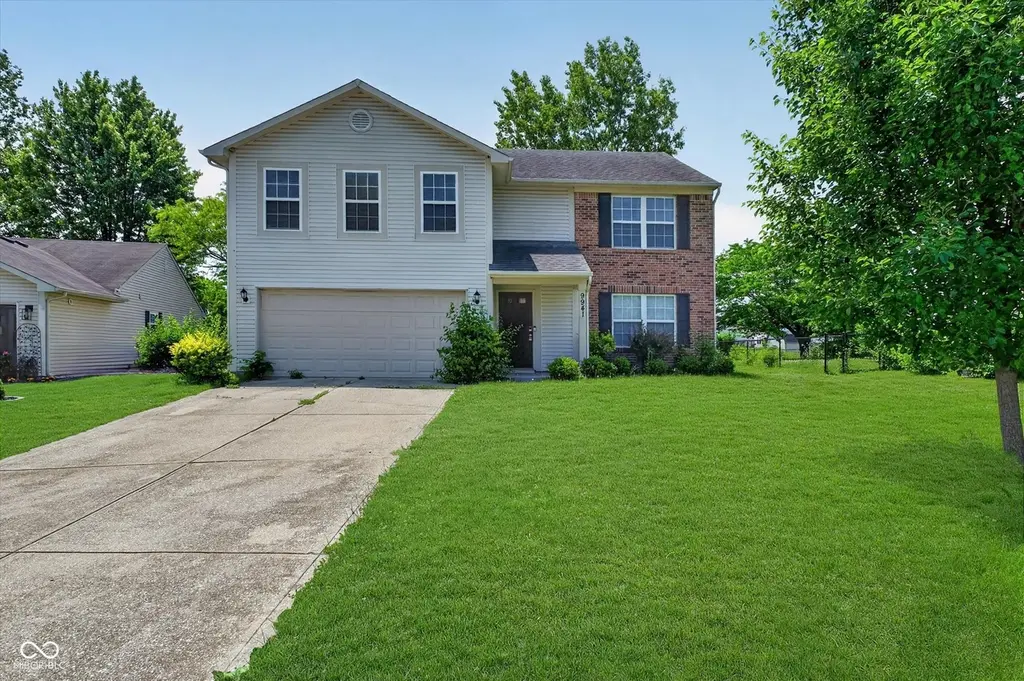
9941 Comb Run Ct · Avon, IN
Flood risk 1/10 · Minimal
- FEMA flood zone
- X (unshaded)
- Chance of flooding over 30 yrs
- 0.0%
- Est. flood insurance / yr
- $507 – $1,088
Fire risk 1/10 · Minimal
- Est. fire insurance / yr
- $717 – $1,331
Heat risk 3/10 · Minor
- Hot days now (above 101°F)
- 7 days/yr
- Hot days in 30 yrs
- 19 days/yr
Wind risk 2/10 · Minimal
- Chance of severe wind over 30 yrs
- 0.0%
Air-quality risk 4/10 · Minor
- Unhealthy air days now
- 4 days/yr
- Unhealthy air days in 30 yrs
- 5 days/yr
Risk factors via First Street. Map © Google.
Why this score? — see what drove the D+ grade
The composite is a weighted blend of 9 inputs, each scored 0–100. Each bar is that input's sub-score; the figure is the points it added to the 100-point composite (weight × sub-score).
- ARV discount +14.5/15.0
- Cash flow +10.5/30.0
- Schools +4.7/10.0
- 1% rule +3.9/10.0
- Livability +3.7/5.0
- Rent growth +3.2/5.0
- DSCR +3.0/10.0
- Condition / age +2.5/5.0
- Appreciation +0.0/10.0
$295,000
🖨 Deal sheet 📄 Offer letter ✓ Due diligence
Listing remarks MLS
Amazing Home in Much Desired Avon Trails! Super Location Close to Shopping, Restaurants, Hospital, YMCA, Highways for Easy Commute & Avon Schools! This Gorgeous Home Has Had Many Recent Updates & is in Pristine Move-In Condition Featuring Beautiful Wood Look Flrs throughout the Main Level! Fabulous Flr Pln w/Room for Everyone w/Nearly 2300 SF Featuring Both Living Rm & Family Rm Open to Dining Area and Large Kitchen w/Lovely White Cbnts & Center Island. Hard to Find 4 Bedrooms with Lovely Master Suite w/TOTALLY REMODELED Elegant Bath & WIC! All This PLUS Fully Fncd Bk Yd w/Patio & Firepit!
Key facts
- Remodeled bathroom
- Great location
- Storage shed
Tags
Property features AI
Finance
- Other: Mandatory fee ownership interest type
- HOA & community: HOA with annual fee; Annual association fee covers entrance/common area and snow removal; Community amenities include a pool and snow removal; HOA governed by covenants and restrictions
Exterior
- Parking: Attached 2-car garage; Finished garage; Garage with keyless entry and automatic opener
- Security: Smoke detectors
- Utilities: Public water; Municipal sewer; Cable available
- Home design: Single-family residence; Two levels; Residential property; Lot less than 1/4 acre
- Construction: Brick and vinyl exterior; Slab foundation
- Exterior features: Covered patio; Storage shed; Privacy fencing enclosing the yard; Located on a cul-de-sac; Sidewalks
Interior
- Kitchen: Electric cooktop; Dishwasher; Microwave with hood; Refrigerator; Disposal; Kitchen island; Pantry
- Bedrooms: Four bedrooms on the upper level; Primary bedroom with walk-in closet
- Bathrooms: Two full bathrooms; One half bathroom; Primary bathroom with tub and shower
- Heating & cooling: Forced air heating; Heat pump (heating and cooling); Electric heating; Central air conditioning
- Interior features: Attic access; Kitchen island; Pantry; Walk-in closets; Smoke alarm
- Laundry & utility: Upper-level laundry room; Electric water heater
Neighborhood map
What this means for you Summary
Snapshot
- This is a 4-bed/2.5-bath single-family listed at $295k.
Deal economics
- At list price, monthly cash flow is $-149 ($-2k/yr) — negative.
- To cash-flow at today's rent, offer at most $269k (8.9% below list).
- To meet the 1% rule (rent ≥ 1% of price), the offer needs to be $264k (10.6% below list).
- Recommended offer: $264k (10.6% below list) — sets the bar for 1% rule.
- Cap rate 5.7% vs local median 3.8% in Avon — top-decile yield for the area; either an underpriced asset or a hidden risk that comps aren't pricing in. Stress-test before assuming the spread holds.
Location & tenants
- Location reads 74/100 on livability (#75 in IN, #4,686 nationally) — a middle-class / working-renter tenant base. Strengths: employment A+, cost of living A+, housing A+; Watch: amenities F, commute F.
- Avon Community School Corporation (suburban): math 51% / reading 53% proficiency, ranked #32 of 301 in IN (top 11%) — acceptable for families but not a draw, mixed tenant base, ~2y average lease; only 20% free/reduced lunch — higher-income household profile.
- Market conditions: Rents rising (+3.0%/yr); 380 active listings in the ZIP; 12 comparable units currently listed for rent nearby; rentals at typical pace (median 24d on market — plan ~3-4 weeks tenant-placement turnaround); solid renter incomes; 1,294 units permitted in Hendricks County in 2024 (18 in 5+ unit buildings).
- This rent runs 31% of the median local income ($103k/yr) — at the standard rent-burdened threshold; future hikes will face affordability resistance.
Forward outlook
- Local home prices are declining (-3.0%/yr); year-one equity from $2k of loan paydown is wiped out by about $9k of value loss. Plan a longer hold.
- Hendricks County population projected at +35% by 2050 — long-run rental-demand tailwind backs the buy-and-hold thesis.
Negotiation context
- Only 9 days on market — expect competitive offers; lowballing is unlikely to land.
- 7 sale attempts since 16y ago with the ask held roughly flat each time — persistent listings suggest the price (not the market) is what's stuck; bring a comps-based counter.
- Current owner paid $255k; 16% above their basis — modest negotiation headroom, anchor on the comps not their cost.
Questions for the listing agent
- What do current leases actually rent for vs. the listed asking? Can we see a recent rent roll and the last 12 months of T-12 income?
- What does the HOA fee cover, when was the last increase, and are there any pending special assessments or reserve-fund shortfalls?
- Is there a deadline driving the sale (1031 exchange, divorce, estate, relocation)? That informs how much negotiation room exists.
- Schools are A-rated — typically a magnet for longer-tenancy family renters. What's the average tenant stay here, and is there a school-zone premium baked into asking?
- The area grade is low — what's the realistic commute time and amenity access for the typical tenant pool here? Any planned neighborhood developments (good or bad) we should know about?
- What's the average days-on-market for RENTAL listings here right now (not sales)? A rising rental-DOM trend means longer vacancies and softer asking-rent achievability than the comps imply.
- What's the recent tenant-quality profile in this submarket — average credit score on applications, eviction rate, late-payment / NSF rate, and stable-employment percentage? A property-management company in the area should have these aggregated.
- How much new for-sale + rental construction is in the pipeline within 1–3 miles? Heavy new supply typically softens prices + rents 12–24 months out; constrained supply supports both.
Investment metrics
- 1% rule
- 0.89% ✗
- Cap rate
- 5.69%
- Cash-on-cash
- -2.17%
- DSCR
- 0.90
- GRM
- 9.3
CMA / ARV
- ARV (on-the-fly)
- $349,272
- Comps found
- 12
Show comp detail 12 sales within ~0.75 mi
| Address | Dist | Beds/Ba | Sqft | Sold | Price | $/sf | Match |
|---|---|---|---|---|---|---|---|
| 9692 Centennial Ct | 0.32mi | 4/2.5 | 2,350 (+4%) | 9mo | $301,025 | $128 | 72 |
| 9685 Lomax Dr | 0.27mi | 4/2.5 | 2,376 (+5%) | 10mo | $335,000 | $141 | 71 |
| 632 Hollowood Ln | 0.32mi | 3/2.5 (-1) | 2,350 (+4%) | 4mo | $347,900 | $148 | 71 |
| 584 Springtree Ln | 0.48mi | 4/2.5 | 2,350 (+4%) | 4mo | $315,000 | $134 | 68 |
| 238 Glenbrook Ln | 0.70mi | 4/3.0 | 2,242 (-1%) | 4mo | $435,000 | $194 | 60 |
| 429 Glenbrook Ln | 0.49mi | 3/2.5 (-1) | 2,348 (+4%) | 8mo | $403,000 | $172 | 59 |
| 309 Glenbrook Ln | 0.64mi | 3/2.5 (-1) | 2,130 (-6%) | 5mo | $395,000 | $185 | 51 |
| 10336 Waverly Dr | 0.53mi | 3/2.5 (-1) | 2,108 (-7%) | 10mo | $260,000 | $123 | 50 |
| 1404 Castleford Ln | 0.59mi | 3/2.5 (-1) | 2,112 (-7%) | 8mo | $274,000 | $130 | 50 |
| 10586 Jacks Way | 0.60mi | 3/2.5 (-1) | 2,551 (+12%) | 1mo | $656,000 | $257 | 46 |
| 1346 Sarah Way | 0.75mi | 3/2.5 (-1) | 2,435 (+7%) | 9mo | $375,000 | $154 | 40 |
| 1132 Sunset Blvd | 0.69mi | 3/2.0 (-1) | 2,025 (-11%) | 8mo | $325,000 | $160 | 36 |
Match score weights: distance 35% · size 25% · config 20% · recency 20%. Top-matched comps best support the ARV.
Projected returns pro-forma
-3.0% appreciation · 2.98% rent growth · sell at horizon
- IRR
- -19.8%
- Equity multiple
- 0.31×
- Total profit
- $-57,201
- Equity at exit
- $43,985
- IRR
- -12.6%
- Equity multiple
- 0.25×
- Total profit
- $-61,621
- Equity at exit
- $25,506
Cash invested: $82,600 (down + closing). Projections, not guarantees.
Landlord ↔ Tenant lean methodology
- Overall (STATE)
- 90 Strongly Landlord-Friendly
- State Indiana
- 90 Strongly Landlord-Friendly · R+11
- County
- — inherits STATE
- City
- — inherits STATE
ZIP-level market 46123
- Home prices YoY
- -21.3%
- Rents YoY
- 3.0%
- Active inventory
- 380
- Price-to-rent
- 9.3×
Monthly cashflow live
- Estimated rent
- $2,637 high interval (Pro) →
- Mortgage (P&I)
- −$1,547
- Tax from tax record
- −$523 /mo · $6,279/yr
- Insurance
- −$123
- HOA
- −$39
- Vacancy / Maint / Mgmt
- −$554
- Net cashflow
- $-149
Break-even live
UW: 25.0% down · 7.5% · 30yr · 1.5% tax · 5.0% vac · 8.0% maint · 8.0% mgmt
Financing live
Cash to close
- Down payment
- $73,750
- Closing costs
- $8,850
- Reserves months
- —
- Total cash needed
- —
Loan-product check · same deal, 3 products live
Conventional
25% down · 7.5% · 30yr
- Down + closing
- —
- Monthly P&I
- —
- Monthly cashflow
- —
- DSCR
- —
- Eligible?
- —
Personal DTI + credit; lowest rate.
DSCR
20% down · 8.5% · 30yr
- Down + closing
- —
- Monthly P&I
- —
- Monthly cashflow
- —
- DSCR
- —
- Eligible?
- —
No personal income docs; deal must DSCR.
Hard money
10% down · 12.0% · 12mo
- Down + closing
- —
- Monthly P&I
- —
- Monthly cashflow
- —
- DSCR
- —
- Eligible?
- —
Short-term bridge; refi at stabilization.
Rent comps 12 comps
| Address | Beds | Baths | Sqft | Rent | $/sqft | DOM | Units | Dist |
|---|---|---|---|---|---|---|---|---|
| 10301 Kensington Way Indianapolis, IN | 3.0 | 3.5 | 2636 | $2,430 | $0.92 | 4d | 1 | 0.46mi |
| 453 Yorktown Ln Avon, IN | 4.0 | 2.5 | 2392 | $2,415 | $1.01 | 23d | 1 | 0.49mi |
| 861 Adler Dr Avon, IN | 4.0 | 2.5 | 2669 | $3,100 | $1.16 | 23d | 1 | 0.54mi |
| 10363 Fairmont Ln Unit 1522300P Indianapolis, IN | 3.0 | 2.0 | 2152 | $3,695 | $1.72 | 2d | 1 | 0.61mi |
| 345 Angelina Way Avon, IN | 3.0 | 2.0 | 1744 | $2,149 | $1.23 | 43d | 1 | 0.96mi |
| 794 Carolina Way Avon, IN | 4.0 | 2.5 | 2390 | $2,470 | $1.03 | 23d | 1 | 0.96mi |
| 1267 Constitution Dr Indianapolis, IN | 4.0 | 2.5 | 2228 | $2,455 | $1.10 | 14d | 1 | 0.98mi |
| 8840 Ingram Ln Avon, IN | 3.0 | 2.5 | 1899 | $2,150 | $1.13 | 17d | 1 | 1.33mi |
| 10483 Day Star Dr Indianapolis, IN | 3.0 | 2.5 | 1840 | $2,071 | $1.13 | 43d | 1 | 1.44mi |
| 1455 Bearsden Dr Avon, IN | 4.0 | 2.5 | 2188 | $2,399 | $1.10 | 3d | 1 | 1.49mi |
| 8802 Benjamin Ln Avon, IN | 4.0 | 3.0 | 2229 | $2,395 | $1.07 | 2d | 1 | 1.49mi |
| 10440 Wintergreen Way Indianapolis, IN | 3.0 | 2.5 | 2416 | $2,281 | $0.94 | 43d | 1 | 1.49mi |
HOA detail
- Monthly dues
- $39 · $468/yr
Listing history 7 events
-
2026-06-08statusdays on market $295,000 Pending 9 DOM
-
2026-06-07days on market $295,000 Active 8 DOM
-
2026-06-03days on market $295,000 Active 4 DOM
-
2026-06-02days on market $295,000 Active 3 DOM
-
2026-06-01days on market $295,000 Active 2 DOM
-
2026-05-31remarks 578-char remark
-
2026-05-31$295,000 Active 1 DOM
ⓘ Source: listings_history table (triggers on properties + properties_extension) + one-shot
backfill from property_details.listing_events for pre-trigger history.
Tax reassessment forecast IN · Partial reset (capped growth)
- Current annual tax
- $6,279 · $523/mo
- Projected year-2 tax
- $6,279 · $523/mo
- Expected delta
- $0/yr ($0/mo · 0.0%)
ⓘ Screening estimate from a state-policy table — verify with the county assessor before closing.
Climate risk First Street
- Flood 1/10 Low FEMA zone X (unshaded) · 0% chance over 30 yrs
- Wildfire 1/10 Low
- Heat 3/10 Moderate 7 d/yr ≥101°F today · 19 d/yr by 30 yrs out
- Wind 2/10 Low 0% chance of damaging wind over 30 yrs
- Air quality 4/10 Moderate 4 unhealthy d/yr today · 5 by 30 yrs out
Nearby sold comps map
Loading sold comps map…
Walkable amenities ~0.75 mi
Loading nearby amenities…
Taxation est. · year 1
- Rental income
- $31,639
- − Mortgage interest
- −$16,525
- − Property taxes
- −$6,279
- − Insurance
- −$1,475
- − Repairs & maintenance
- −$2,531
- − Management
- −$2,531
- − HOA
- −$468
- − Depreciation
- −$8,582
- Taxable loss
- −$6,751
- Est. tax savings @ 24.0%
- +$1,620
- After-tax cash flow
- $-170/yr
For passive investors: Depreciation is non-cash, so a rental often shows a tax loss while cash-flowing — sheltering income. Rental losses are passive: they offset passive income freely, and up to $25,000/yr can offset ordinary (W-2) income if you actively participate and your MAGI is under $100k (phasing out to $0 by $150k); unused losses carry forward. On sale, claimed depreciation is recaptured at up to 25%, and gains may owe capital-gains tax (a 1031 exchange can defer both). Figures are a year-1 estimate at your 24.0% rate — not tax advice; consult a CPA.
Schools (NCES district)
- District
- Avon Community School Corporation
- NCES district ID
- 1800270
- Math proficiency
- 51% ▼ -8.00%
- Reading proficiency
- 53% ▼ -8.00%
- Median HH income
- $75,987
- Composite
- 46.93/100
- National rank
- #2362
- State rank
- #32 of 301 in IN
Livability — Avon
- Score
- 74/100
- State rank
- #75
- US rank
- #4686
Category grades
Schools grade is shown separately in the Schools card above.
Census & demographics
- County
- Hendricks County · 143,373 people
- City population
- 43,353
- Metro
- Indianapolis-Carmel-Anderson, IN
- Population (ZIP)
- 43,353
- Household income
- $103,485
- Rent vs Own
- Severe rent burden
- 529.0
Population outlook (Hendricks County) Hauer SSP2
- Today (2025)
- 187,418 people
- By 2030
- 201,494 · +7.5%
- By 2040
- 228,487 · +21.9%
- By 2050
- 253,068 · +35.0%
- By 2075
- 308,920 · +64.8%
- By 2100
- 336,510 · +79.6%
Race, ethnicity, and origin ACS 2023
- Neighborhood character
- Predominantly White (74%)
- Race & ethnicity
- White 74% Black 12% Hispanic / Latino 7% Two or more races 6% Asian 4%
- Hispanic origin (detail)
- Mexican 2%
- Common ancestry
- Slovak 3% Romanian 2% Italian 1%
- Foreign-born
- 6% · Canada, South Korea
- Languages at home
- 92% English-only · Spanish 4% Other Indo-European 2%
Political lean MEDSL · Hendricks
- 2024 margin
- Strong R (+21.5) · D 38.4% · R 59.9% · Other 1.7%
- 2008→2024 swing
- +1.9pp toward D · 2008: -23.4pp · 2024: -21.5pp
- All cycles
- 2024: R+21.5 2020: R+23.9 2016: R+34.2 2012: R+34.9 2008: R+23.4
Not yet ingested
- Civics
- —
Market trends
- HPI YoY
- ▼ -55.05%
- Current HPI
- 203.9226
- Rent YoY
- ▲ 2.98%
- Metro
- Indianapolis-Carmel-Anderson, IN
- State GDP YoY
- ▲ 2.90%
- F500 in state
- 18
Industry mix (Fortune 500 HQ in IN)
| Industry | F500 HQs | Revenue |
|---|---|---|
| Industrial Machinery | 2 | $37B |
|
||
| Healthcare | 1 | $177B |
|
||
| Pharmaceuticals | 1 | $45B |
|
||
| Metals / Steel | 1 | $18B |
|
||
| Agriculture | 1 | $17B |
|
||
| Packaging | 1 | $12B |
|
||
Price history
+136.0% since first listed18 events — show timeline
- 2026-05-30 Listed $295,000 MIBOR as Distributed by MLS Grid
- 2025-08-09 Rental Removed $2,175 APPFOLIO
- 2025-07-30 Listed for Rent $2,175 APPFOLIO
- 2021-06-25 Sold (MLS) $255,000 MIBOR as Distributed by MLS Grid
- 2021-05-24 Pending — MIBOR as Distributed by MLS Grid
- 2021-05-18 Listed $250,000 MIBOR as Distributed by MLS Grid
- 2016-03-04 Sold (MLS) $152,000 MIBOR as Distributed by MLS Grid
- 2016-02-01 Pending — MIBOR as Distributed by MLS Grid
- 2015-12-14 Price Changed $159,800 MIBOR as Distributed by MLS Grid
- 2015-09-28 Listed $159,900 MIBOR as Distributed by MLS Grid
- 2011-06-07 Listing Removed — MIBOR as Distributed by MLS Grid
- 2011-06-03 Sold (MLS) $136,000 MIBOR as Distributed by MLS Grid
- 2011-03-30 Listed $139,900 MIBOR as Distributed by MLS Grid
- 2011-03-02 Listing Removed — MIBOR as Distributed by MLS Grid
- 2011-02-25 Sold (MLS) $81,500 MIBOR as Distributed by MLS Grid
- 2010-12-04 Listed $112,500 MIBOR as Distributed by MLS Grid
- 2010-11-28 Listing Removed — MIBOR as Distributed by MLS Grid
- 2010-08-27 Listed $125,000 MIBOR as Distributed by MLS Grid
Property tax history
+14.4%/yrLatest (2025): $6,279 · +13.8% YoY. Source: county tax records.
Cash-flow waterfall
monthlySold comps — $/sqft
last 12 mo · ≤1 miLoading sold comps…