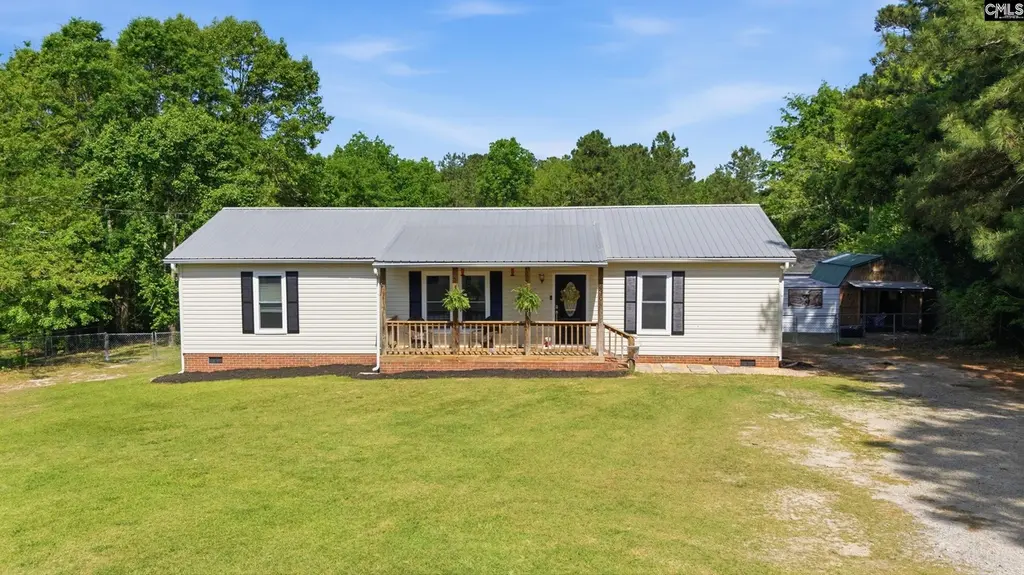
236 Drawdebil Ct · Gilbert, SC
Flood risk 1/10 · Minimal
- FEMA flood zone
- X (unshaded)
- Chance of flooding over 30 yrs
- 0.0%
- Est. flood insurance / yr
- $507 – $1,088
Fire risk 5/10 · Moderate
- Est. fire insurance / yr
- $783 – $1,453
Heat risk 6/10 · Moderate
- Hot days now (above 106°F)
- 7 days/yr
- Hot days in 30 yrs
- 16 days/yr
Wind risk 6/10 · Moderate
- Chance of severe wind over 30 yrs
- 65.0%
Air-quality risk 3/10 · Minor
- Unhealthy air days now
- 3 days/yr
- Unhealthy air days in 30 yrs
- 3 days/yr
Risk factors via First Street. Map © Google.
Why this score? — see what drove the D grade
The composite is a weighted blend of 9 inputs, each scored 0–100. Each bar is that input's sub-score; the figure is the points it added to the 100-point composite (weight × sub-score).
- Appreciation +10.0/10.0
- ARV discount +7.5/15.0
- Cash flow +7.4/30.0
- Schools +4.2/10.0
- Livability +3.6/5.0
- Rent growth +2.5/5.0
- Condition / age +2.5/5.0
- DSCR +1.6/10.0
- 1% rule +0.9/10.0
$289,900
🖨 Deal sheet 📄 Offer letter ✓ Due diligence
Listing remarks
Welcome to your slice of country living in Gilbert! Situated on a generous 1-acre lot, this 3-bedroom, 2-bath home has been thoughtfully updated and is move-in ready. Inside, you’ll find fresh paint, brand-new windows, brand new HVAC installed May 2026 and stylish LVP flooring that runs throughout the entire home. The primary suite features large windows bringing in tons of natural light, a private bath with a newly added walk in closet. Step outside to the screened-in porch—perfect for relaxing while overlooking the large backyard and peaceful horse pasture just beyond. This property truly stands out with its versatile outdoor features. A detached storage shed has been finished
Key facts
- Fresh paint
- Private bath
- 1 acre lot
Tags
Property features AI
Exterior
- Parking: Detached carport
- Utilities: Private well water; Septic sewer
- Home design: Single-story home; Crawlspace foundation
- Construction: Crawlspace foundation; Vinyl exterior
- Exterior features: Vinyl exterior; Rear chain-link fence
Interior
- Kitchen: Granite countertops; Luxury vinyl plank flooring
- Bedrooms: Master bedroom on main level with walk-in closet, ceiling fan, and luxury vinyl plank floors; Bedroom 2 with walk-in closet, ceiling fan, and luxury vinyl plank floors; Bedroom 3 with walk-in closet, ceiling fan, and luxury vinyl plank floors
- Flooring: Luxury vinyl plank flooring throughout main living areas and bedrooms
- Bathrooms: Two full bathrooms
- Heating & cooling: Central heating; Central air conditioning
- Interior features: Refrigerator included; Granite countertops
- Laundry & utility: Laundry in closet
Neighborhood map
What this means for you Summary
Snapshot
- This is a 3-bed/2.0-bath single-family listed at $290k.
Deal economics
- At list price, monthly cash flow is $-369 ($-4k/yr) — negative.
- To cash-flow at today's rent, offer at most $225k (22.5% below list).
- To meet the 1% rule (rent ≥ 1% of price), the offer needs to be $170k (41.2% below list).
- Recommended offer: $170k (41.2% below list) — sets the bar for 1% rule.
Location & tenants
- Location reads 71/100 on livability (#52 in SC) — a middle-class / working-renter tenant base. Strengths: cost of living A+, housing A+, crime B; Watch: amenities F, commute F, health & safety F.
- Lexington 01 (suburban): math 42% / reading 53% proficiency, ranked #11 of 80 in SC (top 14%) — families likely to look elsewhere, expect single-tenant / working-renter base with shorter leases.
- Zoned schools: Gilbert Elementary (math 33% / reading 26%, grade F, #399 of 597 statewide, top 69%, 768 students, 45% FRL); Gilbert High (math 37% / reading 83%, grade C+, #109 of 196 statewide, top 55%, 1,118 students, 38% FRL).
- Market conditions: 273 active listings in the ZIP; 1,712 units permitted in Lexington County in 2024 (0 in 5+ unit buildings).
Forward outlook
- In year one you build about $31k of equity ($2k loan paydown + $29k appreciation (10.0% local appreciation)).
- Lexington County population projected at +26% by 2050 — long-run rental-demand tailwind backs the buy-and-hold thesis.
- By year 2, paydown + projected appreciation supports a ~$50k cash-out refi (75% LTV) — recoverable capital for the next deal without selling this one.
Negotiation context
- It's been on market 28 days — a 2% lower offer ($286k) is reasonable based on typical stale-listing flexibility.
- 3 sale attempts since 6y ago with the ask held roughly flat each time — persistent listings suggest the price (not the market) is what's stuck; bring a comps-based counter.
- Current owner paid $148k; list at $290k implies a 95% gain — meaningful room to come down on a strong offer.
Risks & watch-outs
- Climate carrying-cost: major wind risk, 65% chance of damaging wind over 30y; moderate wildfire risk; extreme-heat days projected 7→16/yr by 2055 (HVAC capex compounding) — expect insurance premiums to compound above CPI over the hold.
Questions for the listing agent
- What do current leases actually rent for vs. the listed asking? Can we see a recent rent roll and the last 12 months of T-12 income?
- Is there a deadline driving the sale (1031 exchange, divorce, estate, relocation)? That informs how much negotiation room exists.
- Schools are D-rated, which usually means shorter tenancies and higher turnover. Who's the typical renter profile here, and what's been the actual vacancy rate?
- The area grade is low — what's the realistic commute time and amenity access for the typical tenant pool here? Any planned neighborhood developments (good or bad) we should know about?
- What's the average days-on-market for RENTAL listings here right now (not sales)? A rising rental-DOM trend means longer vacancies and softer asking-rent achievability than the comps imply.
- What's the recent tenant-quality profile in this submarket — average credit score on applications, eviction rate, late-payment / NSF rate, and stable-employment percentage? A property-management company in the area should have these aggregated.
- How much new for-sale + rental construction is in the pipeline within 1–3 miles? Heavy new supply typically softens prices + rents 12–24 months out; constrained supply supports both.
Investment metrics
- 1% rule
- 0.59% ✗
- Cap rate
- 4.76%
- Cash-on-cash
- -5.46%
- DSCR
- 0.76
- GRM
- 14.2
CMA / ARV
No comps found within radius.
Projected returns pro-forma
10.0% appreciation · 3.0% rent growth · sell at horizon
- IRR
- 20.4%
- Equity multiple
- 2.65×
- Total profit
- $134,217
- Equity at exit
- $261,165
- IRR
- 18.6%
- Equity multiple
- 6.09×
- Total profit
- $413,441
- Equity at exit
- $563,212
Cash invested: $81,172 (down + closing). Projections, not guarantees.
Landlord ↔ Tenant lean methodology
- Overall (STATE)
- 90 Strongly Landlord-Friendly
- State South Carolina
- 90 Strongly Landlord-Friendly · R+6
- County
- — inherits STATE
- City
- — inherits STATE
ZIP-level market 29054
- Home prices YoY
- 4.7%
- Active inventory
- 273
- Price-to-rent
- 14.2×
Monthly cashflow live
- Estimated rent
- $1,703 medium interval (Pro) →
- Mortgage (P&I)
- −$1,520
- Tax from tax record
- −$74 /mo · $887/yr
- Insurance
- −$121
- HOA
- −$0
- Vacancy / Maint / Mgmt
- −$358
- Net cashflow
- $-369
Break-even live
UW: 25.0% down · 7.5% · 30yr · 1.5% tax · 5.0% vac · 8.0% maint · 8.0% mgmt
Financing live
Cash to close
- Down payment
- $72,475
- Closing costs
- $8,697
- Reserves months
- —
- Total cash needed
- —
Loan-product check · same deal, 3 products live
Conventional
25% down · 7.5% · 30yr
- Down + closing
- —
- Monthly P&I
- —
- Monthly cashflow
- —
- DSCR
- —
- Eligible?
- —
Personal DTI + credit; lowest rate.
DSCR
20% down · 8.5% · 30yr
- Down + closing
- —
- Monthly P&I
- —
- Monthly cashflow
- —
- DSCR
- —
- Eligible?
- —
No personal income docs; deal must DSCR.
Hard money
10% down · 12.0% · 12mo
- Down + closing
- —
- Monthly P&I
- —
- Monthly cashflow
- —
- DSCR
- —
- Eligible?
- —
Short-term bridge; refi at stabilization.
Listing history 14 events
-
2026-05-01status Active
-
2026-04-21status Pending
-
2026-04-16$289,900 Active
-
2020-05-18soldstatus $148,500
-
2020-04-02historical
-
2020-03-27historical Active - Contingent
-
2020-03-24price $150,000
-
2020-02-28price $155,000
-
2020-02-28$150,000 Active
-
2007-04-04soldstatus $106,000
-
2007-02-23soldstatus $79,918
-
2003-09-26soldstatus $87,000
-
1995-03-01soldstatus $72,888
-
1992-11-01soldstatus $73,900
ⓘ Source: listings_history table (triggers on properties + properties_extension) + one-shot
backfill from property_details.listing_events for pre-trigger history.
Tax reassessment forecast SC · Resets to sale price
- Current annual tax
- $887 · $74/mo
- Projected year-2 tax
- $1,652 · $138/mo
- Expected delta
- +$765/yr (+$64/mo · 86.3%)
ⓘ Screening estimate from a state-policy table — verify with the county assessor before closing.
Climate risk First Street
- Flood 1/10 Low FEMA zone X (unshaded) · 0% chance over 30 yrs
- Wildfire 5/10 Major
- Heat 6/10 Major 7 d/yr ≥106°F today · 16 d/yr by 30 yrs out
- Wind 6/10 Major 65% chance of damaging wind over 30 yrs
- Air quality 3/10 Moderate 3 unhealthy d/yr today · 3 by 30 yrs out
Nearby sold comps map
Loading sold comps map…
Walkable amenities ~0.75 mi
Loading nearby amenities…
Taxation est. · year 1
- Rental income
- $20,441
- − Mortgage interest
- −$16,239
- − Property taxes
- −$887
- − Insurance
- −$1,450
- − Repairs & maintenance
- −$1,635
- − Management
- −$1,635
- − Depreciation
- −$8,433
- Taxable loss
- −$9,838
- Est. tax savings @ 24.0%
- +$2,361
- After-tax cash flow
- $-2,070/yr
For passive investors: Depreciation is non-cash, so a rental often shows a tax loss while cash-flowing — sheltering income. Rental losses are passive: they offset passive income freely, and up to $25,000/yr can offset ordinary (W-2) income if you actively participate and your MAGI is under $100k (phasing out to $0 by $150k); unused losses carry forward. On sale, claimed depreciation is recaptured at up to 25%, and gains may owe capital-gains tax (a 1031 exchange can defer both). Figures are a year-1 estimate at your 24.0% rate — not tax advice; consult a CPA.
Schools (NCES district)
- District
- Lexington 01
- NCES district ID
- 4502700
- Math proficiency
- 42% ▼ -12.00%
- Reading proficiency
- 53% ▼ -2.00%
- Median HH income
- $61,298
- Composite
- 41.75/100
- National rank
- #3399
- State rank
- #11 of 80 in SC
Livability — Gilbert
- Score
- 71/100
- State rank
- #52
- US rank
- #7008
Category grades
Schools grade is shown separately in the Schools card above.
Census & demographics
- Population (ZIP)
- 10,137
Population outlook (Lexington County) Hauer SSP2
- Today (2025)
- 322,999 people
- By 2030
- 342,356 · +6.0%
- By 2040
- 377,715 · +16.9%
- By 2050
- 406,984 · +26.0%
- By 2075
- 465,447 · +44.1%
- By 2100
- 485,674 · +50.4%
Race, ethnicity, and origin ACS 2023
- Neighborhood character
- Predominantly White (86%)
- Race & ethnicity
- White 86% Hispanic / Latino 6% Two or more races 6% Black 2%
- Hispanic origin (detail)
- Mexican 4%
- Common ancestry
- Slovak 2% Italian 2% Serbian 2%
- Foreign-born
- 2% · Canada, Jamaica
- Languages at home
- 94% English-only · Spanish 5%
Political lean MEDSL · Lexington
- 2024 margin
- Solid R (+33.5) · D 32.5% · R 66.0% · Other 1.4%
- 2008→2024 swing
- +4.6pp toward D · 2008: -38.0pp · 2024: -33.5pp
- All cycles
- 2024: R+33.5 2020: R+30.1 2016: R+36.7 2012: R+37.8 2008: R+38.0
Not yet ingested
- Civics
- —
Market trends
- HPI YoY
- ▲ 20.87%
- Current HPI
- 461.9332
- Rent YoY
- —
- Metro
- —
- State GDP YoY
- ▲ 4.51%
- F500 in state
- 2
Industry mix (Fortune 500 HQ in SC)
| Industry | F500 HQs | Revenue |
|---|---|---|
| Packaging | 1 | $7B |
|
||
Price history
+292.3% since first listed14 events — show timeline
- 2026-05-01 Relisted — Consolidated MLS
- 2026-04-21 Pending — Consolidated MLS
- 2026-04-16 Listed $289,900 Consolidated MLS
- 2020-05-18 Sold (Public Records) $148,500 Public Records
- 2020-04-02 Delisted — Consolidated MLS
- 2020-03-27 Contingent — Consolidated MLS
- 2020-03-24 Price Changed $150,000 Consolidated MLS
- 2020-02-28 Price Changed $155,000 Consolidated MLS
- 2020-02-28 Listed $150,000 Consolidated MLS
- 2007-04-04 Sold (Public Records) $106,000 Public Records
- 2007-02-23 Sold (Public Records) $79,918 Public Records
- 2003-09-26 Sold (Public Records) $87,000 Public Records
- 1995-03-01 Sold (Public Records) $72,888 Public Records
- 1992-11-01 Sold (Public Records) $73,900 Public Records
Property tax history
-6.9%/yrLatest (2024): $887 · +4.4% YoY. Source: county tax records.
Cash-flow waterfall
monthlySold comps — $/sqft
last 12 mo · ≤1 miLoading sold comps…