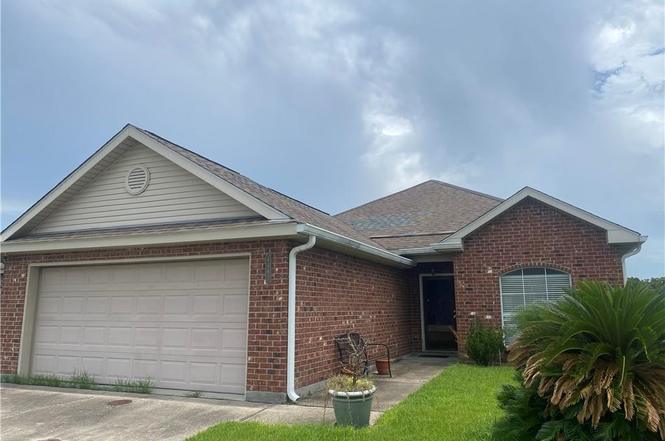
4462 Bay View Drive Dr · Estelle, LA
Flood risk 8/10 · Major
- FEMA flood zone
- X
- Chance of flooding over 30 yrs
- 0.73%
- Est. flood insurance / yr
- $507 – $1,088
Fire risk 1/10 · Minimal
- Est. fire insurance / yr
- $1,269 – $2,357
Heat risk 10/10 · Severe
- Hot days now (above 108°F)
- 7 days/yr
- Hot days in 30 yrs
- 21 days/yr
Wind risk 10/10 · Severe
- Chance of severe wind over 30 yrs
- 99.0%
Air-quality risk 3/10 · Minor
- Unhealthy air days now
- 2 days/yr
- Unhealthy air days in 30 yrs
- 3 days/yr
Risk factors via First Street. Map © Google.
Why this score? — see what drove the D+ grade
The composite is a weighted blend of 9 inputs, each scored 0–100. Each bar is that input's sub-score; the figure is the points it added to the 100-point composite (weight × sub-score).
- Cash flow +16.3/30.0
- ARV discount +13.6/15.0
- DSCR +5.0/10.0
- 1% rule +4.0/10.0
- Livability +3.2/5.0
- Rent growth +2.8/5.0
- Schools +2.5/10.0
- Condition / age +2.5/5.0
- Appreciation +0.0/10.0
$225,000
🖨 Deal sheet (PDF) 📄 Offer letter ✓ Due diligence
Listing remarks MLS
BRING ALL OFFERS! This is a beautiful home, open floor plan with 3 bedrooms and 2 bathrooms. Many features and has been kept up very nicely. A must see in a beautiful area. Being sold as is.
Key facts
- Garage
- Built 2008
- Listed 130 days
Neighborhood map
What this means for you Summary
Snapshot
- This is a 3-bed/2.0-bath single-family listed at $225k.
Deal economics
- At list price, monthly cash flow is $55 ($666/yr) — positive.
- The deal already cash-flows at list — no discount required.
- To meet the 1% rule (rent ≥ 1% of price), the offer needs to be $203k (9.9% below list).
- Recommended offer: $198k (12.0% below list) — sets the bar for market timing.
- Cap rate 6.9% vs local median 5.6% in Estelle — meaningfully above typical; check what's discounted (condition, days-on-market, listing class) to confirm the premium yield is real.
Location & tenants
- Location reads 64/100 on livability (#183 in LA) — a middle-class / working-renter tenant base. Strengths: cost of living A+, housing A+, employment B; Watch: crime F, amenities F, commute F.
- Jefferson Parish (suburban): math 24% / reading 34% proficiency, ranked #44 of 98 in LA (top 45%) — low school quality limits family demand, transient renter base, plan for 1-2y turnover; 70% free/reduced lunch — lower-income household profile, screen leases tightly.
- Zoned schools: Congetta Trippe Janet Elementary School (math 29% / reading 43%, grade F, #274 of 646 statewide, top 43%, 648 students, 60% FRL); Harry S Truman School (math 7% / reading 18%, grade F, #546 of 646 statewide, top 85%, 541 students, 78% FRL); John Ehret High School (math 19% / reading 27%, grade F, #169 of 265 statewide, top 64%, 1,579 students, 66% FRL) — zoned schools at 68% FRL track the district average.
- Market conditions: Rents rising (+1.1%/yr); 299 active listings in the ZIP; 7 comparable units currently listed for rent nearby; rentals at typical pace (median 26d on market — plan ~3-4 weeks tenant-placement turnaround); 43% of comp listings sitting > 30 days — soft ceiling on asking rent; 518 units permitted in Jefferson Parish in 2024 (43 in 5+ unit buildings).
- This rent runs 44% of the median local income ($55k/yr) — at the standard rent-burdened threshold; future hikes will face affordability resistance.
Forward outlook
- Local home prices are declining (-3.0%/yr); year-one equity from $2k of loan paydown is wiped out by about $7k of value loss. Plan a longer hold.
Negotiation context
- It's been on market 130 days — a 12% lower offer ($198k) is reasonable based on typical stale-listing flexibility.
- 4 sale attempts since 19y ago; this cycle's ask has dropped $30k (12%) from the opening price — seller is motivated, your offer sets the floor, not the list.
- Current owner paid $179k; 26% above their basis — modest negotiation headroom, anchor on the comps not their cost.
Risks & watch-outs
- Watch-outs: flood insurance adds $66/mo.
- Climate carrying-cost: severe flood risk; severe wind risk, 99% chance of damaging wind over 30y; extreme-heat days projected 7→21/yr by 2055 (HVAC capex compounding) — expect insurance premiums to compound above CPI over the hold.
Questions for the listing agent
- It's been on market 130 days. Have you received any prior offers? Is the seller open to a 12% concession, seller financing, or rate buy-down credit?
- What's the actual annual flood-insurance premium (NFIP or private), and is the property in a SFHA with mandatory coverage?
- Why hasn't it sold? Are there any deal-killer items the seller is aware of (foundation, flood, title, zoning, code violations)?
- Is there a deadline driving the sale (1031 exchange, divorce, estate, relocation)? That informs how much negotiation room exists.
- Schools are F-rated, which usually means shorter tenancies and higher turnover. Who's the typical renter profile here, and what's been the actual vacancy rate?
- Crime grade is F in this area — have there been break-ins, vandalism, or insurance claims at this property in the last 3 years? What carrier currently insures it and at what premium?
- The area grade is low — what's the realistic commute time and amenity access for the typical tenant pool here? Any planned neighborhood developments (good or bad) we should know about?
- What's the average days-on-market for RENTAL listings here right now (not sales)? A rising rental-DOM trend means longer vacancies and softer asking-rent achievability than the comps imply.
- What's the recent tenant-quality profile in this submarket — average credit score on applications, eviction rate, late-payment / NSF rate, and stable-employment percentage? A property-management company in the area should have these aggregated.
- How much new for-sale + rental construction is in the pipeline within 1–3 miles? Heavy new supply typically softens prices + rents 12–24 months out; constrained supply supports both.
Investment metrics
- 1% rule
- 0.90% ✗
- Cap rate
- 6.94%
- Cash-on-cash
- 2.32%
- DSCR
- 1.10
- GRM
- 9.3
CMA / ARV
- ARV (on-the-fly)
- $260,580
- Comps found
- 12
Show comp detail 12 sales within ~0.75 mi
| Address | Dist | Beds/Ba | Sqft | Sold | Price | $/sf | Match |
|---|---|---|---|---|---|---|---|
| 4462 Bay View Drive Dr | 0.00mi | 3/2.0 | 1,515 (0%) | 2mo | $203,000 | $134 | 99 |
| 4645 Ames Blvd | 0.32mi | 3/2.0 | 1,502 (-1%) | 0mo | $300,000 | $200 | 84 |
| 2605 Sea Shore Dr | 0.20mi | 3/2.0 | 1,449 (-4%) | 4mo | $270,000 | $186 | 80 |
| 2733 Acorn St | 0.48mi | 3/2.0 | 1,508 (-0%) | 1mo | $160,000 | $106 | 76 |
| 4416 Park Shore Dr | 0.21mi | 4/2.0 (+1) | 1,611 (+6%) | 6mo | $343,000 | $213 | 70 |
| 4608 Bayou Des Familles Dr | 0.25mi | 3/2.0 | 1,378 (-9%) | 8mo | $240,500 | $175 | 67 |
| 2729 Blanche St | 0.58mi | 4/2.0 (+1) | 1,494 (-1%) | 2mo | $244,000 | $163 | 64 |
| 4732 Red Oak Dr | 0.55mi | 3/2.0 | 1,625 (+7%) | 4mo | $234,900 | $145 | 59 |
| 2720 Bayou Cane Dr | 0.43mi | 3/2.0 | 1,308 (-14%) | 1mo | $224,900 | $172 | 57 |
| 4901 Wood Forest Drive Dr | 0.69mi | 3/2.0 | 1,590 (+5%) | 4mo | $265,000 | $167 | 56 |
| 2700 Dolores Dr | 0.74mi | 4/2.0 (+1) | 1,400 (-8%) | 2mo | $207,000 | $148 | 46 |
| 2925 Monica Ln | 0.70mi | 3/2.0 | 1,650 (+9%) | 8mo | $285,000 | $173 | 46 |
Match score weights: distance 35% · size 25% · config 20% · recency 20%. Top-matched comps best support the ARV.
Projected returns pro-forma
-3.0% appreciation · 1.05% rent growth · sell at horizon
- IRR
- -16.8%
- Equity multiple
- 0.42×
- Total profit
- $-36,801
- Equity at exit
- $33,548
- IRR
- -12.6%
- Equity multiple
- 0.32×
- Total profit
- $-42,784
- Equity at exit
- $19,454
Cash invested: $63,000 (down + closing). Projections, not guarantees.
Landlord ↔ Tenant lean methodology
- Overall (STATE)
- 90 Strongly Landlord-Friendly
- State Louisiana
- 90 Strongly Landlord-Friendly · R+12
- County
- — inherits STATE
- City
- — inherits STATE
ZIP-level market 70072
- Rents YoY
- 1.1%
- Active inventory
- 299
- Price-to-rent
- 9.3×
Monthly cashflow live
- Estimated rent
- $2,026 high interval (Pro) →
- Mortgage (P&I)
- −$1,180
- Tax from tax record
- −$205 /mo · $2,462/yr
- Insurance
- −$94
- Flood insurance flood zone
- −$66 /mo · $798/yr
- HOA
- −$0
- Vacancy / Maint / Mgmt
- −$426
- Net cashflow
- $55
Break-even live
Sensitivity live
| Price | -10% $183 | -5% $119 | +0% $55 | +5% $-8 | +10% $-72 |
|---|---|---|---|---|---|
| Rent | -10% $-105 | -5% $-25 | +0% $55 | +5% $136 | +10% $216 |
| Rate | -1.0pp $169 | -0.5pp $113 | base $55 | +0.5pp $-3 | +1.0pp $-62 |
UW: 25.0% down · 7.5% · 30yr · 1.5% tax · 5.0% vac · 8.0% maint · 8.0% mgmt
Financing live
Cash to close
- Down payment
- $56,250
- Closing costs
- $6,750
- Reserves months
- —
- Total cash needed
- —
Loan-product check · same deal, 3 products live
Conventional
25% down · 7.5% · 30yr
- Down + closing
- —
- Monthly P&I
- —
- Monthly cashflow
- —
- DSCR
- —
- Eligible?
- —
Personal DTI + credit; lowest rate.
DSCR
20% down · 8.5% · 30yr
- Down + closing
- —
- Monthly P&I
- —
- Monthly cashflow
- —
- DSCR
- —
- Eligible?
- —
No personal income docs; deal must DSCR.
Hard money
10% down · 12.0% · 12mo
- Down + closing
- —
- Monthly P&I
- —
- Monthly cashflow
- —
- DSCR
- —
- Eligible?
- —
Short-term bridge; refi at stabilization.
Rent comps 7 comps
| Address | Beds | Baths | Sqft | Rent | $/sqft | DOM | Units | Dist |
|---|---|---|---|---|---|---|---|---|
| 2704 Sieglinde Ct Marrero, LA | 3.0 | 2.0 | 1122 | $1,850 | $1.65 | 25d | 1 | 0.16mi |
| 4613 Ames Blvd Marrero, LA | 3.0 | 2.0 | 1461 | $2,350 | $1.61 | 45d | 1 | 0.22mi |
| 2748 Erin Dr Marrero, LA | 3.0 | 2.0 | 1460 | $1,850 | $1.27 | 25d | 1 | 0.49mi |
| 2544 Jeanne St Marrero, LA | 4.0 | 2.0 | 1158 | $2,300 | $1.99 | 25d | 1 | 0.67mi |
| 2417 Highland Meadows Dr Marrero, LA | 4.0 | 2.0 | 1400 | $1,950 | $1.39 | 45d | 1 | 0.91mi |
| 5219 Cross Creek Dr Marrero, LA | 2.0 | 2.0 | 1200 | $1,450 | $1.21 | 45d | 1 | 1.14mi |
| 2425 Ramsey Dr Marrero, LA | 4.0 | 2.0 | 1500 | $1,800 | $1.20 | 4d | 1 | 1.45mi |
Listing history 8 events
-
2025-12-03status Pending
-
2025-11-29price $225,000 190-char remark
Show marketing remark (190 chars)
BRING ALL OFFERS! This is a beautiful home, open floor plan with 3 bedrooms and 2 bathrooms. Many features and has been kept up very nicely. A must see in a beautiful area. Being sold as is.
-
2025-11-08price $225,000
-
2025-07-26$255,000 Active 190-char remark
Show marketing remark (190 chars)
BRING ALL OFFERS! This is a beautiful home, open floor plan with 3 bedrooms and 2 bathrooms. Many features and has been kept up very nicely. A must see in a beautiful area. Being sold as is.
-
2025-07-26$255,000 Active
Show marketing remark (190 chars)
BRING ALL OFFERS! This is a beautiful home, open floor plan with 3 bedrooms and 2 bathrooms. Many features and has been kept up very nicely. A must see in a beautiful area. Being sold as is.
-
2007-06-05soldstatus $179,250
-
2007-06-04$179,250
-
2007-06-04$179,250
ⓘ Source: listings_history table (triggers on properties + properties_extension) + one-shot
backfill from property_details.listing_events for pre-trigger history.
Tax reassessment forecast LA · Resets to sale price
- Current annual tax
- $2,462 · $205/mo
- Projected year-2 tax
- $2,462 · $205/mo
- Expected delta
- $0/yr ($0/mo · 0.0%)
ⓘ Screening estimate from a state-policy table — verify with the county assessor before closing.
Climate risk First Street
- Flood 8/10 Severe FEMA zone X · 73% chance over 30 yrs
- Wildfire 1/10 Low
- Heat 10/10 Extreme 7 d/yr ≥108°F today · 21 d/yr by 30 yrs out
- Wind 10/10 Extreme 99% chance of damaging wind over 30 yrs
- Air quality 3/10 Moderate 2 unhealthy d/yr today · 3 by 30 yrs out
Nearby sold comps map
Loading sold comps map…
Walkable amenities ~0.75 mi
Loading nearby amenities…
Taxation est. · year 1
- Rental income
- $24,315
- − Mortgage interest
- −$12,603
- − Property taxes
- −$2,462
- − Insurance
- −$1,922
- − Repairs & maintenance
- −$1,945
- − Management
- −$1,945
- − Depreciation
- −$6,545
- Taxable loss
- −$3,108
- Est. tax savings @ 24.0%
- +$746
- After-tax cash flow
- $1,412/yr
For passive investors: Depreciation is non-cash, so a rental often shows a tax loss while cash-flowing — sheltering income. Rental losses are passive: they offset passive income freely, and up to $25,000/yr can offset ordinary (W-2) income if you actively participate and your MAGI is under $100k (phasing out to $0 by $150k); unused losses carry forward. On sale, claimed depreciation is recaptured at up to 25%, and gains may owe capital-gains tax (a 1031 exchange can defer both). Figures are a year-1 estimate at your 24.0% rate — not tax advice; consult a CPA.
Schools (NCES district)
- District
- Jefferson Parish
- NCES district ID
- 2200840
- Math proficiency
- 24% ▼ -36.00%
- Reading proficiency
- 34% ▼ -30.00%
- Median HH income
- $48,421
- Composite
- 25.19/100
- National rank
- #7511
- State rank
- #44 of 98 in LA
Livability — Estelle
- Score
- 64/100
- State rank
- #183
- US rank
- #14840
Category grades
Schools grade is shown separately in the Schools card above.
Census & demographics
- Census place
- Estelle, LA
- County
- Jefferson Parish · 426,999 people
- Metro
- New Orleans-Metairie, LA
- Population (ZIP)
- 55,693
- Household income
- $54,885
- Rent vs Own
- Severe rent burden
- 1807.0
Population outlook (Jefferson County) Hauer SSP2
- Today (2025)
- 451,696 people
- By 2030
- 455,451 · +0.8%
- By 2040
- 458,308 · +1.5%
- By 2050
- 461,031 · +2.1%
- By 2075
- 476,351 · +5.5%
- By 2100
- 499,377 · +10.6%
Race, ethnicity, and origin ACS 2023
- Neighborhood character
- Diverse neighborhood (Simpson 0.67)
- Race & ethnicity
- Black 40% White 39% Hispanic / Latino 12% Two or more races 7% Asian 5%
- Hispanic origin (detail)
- Mexican 4% Dominican 1%
- Common ancestry
- Lithuanian 12% Hispanic 1%
- Foreign-born
- 10% · Canada, Vietnam, Jamaica
- Languages at home
- 85% English-only · Spanish 8% Vietnamese 4% French/Haitian/Cajun 2%
Political lean MEDSL · Jefferson
- 2024 margin
- R (+12.9) · D 42.5% · R 55.5% · Other 2.1%
- 2008→2024 swing
- +13.6pp toward D · 2008: -26.6pp · 2024: -12.9pp
- All cycles
- 2024: R+12.9 2020: R+11.1 2016: R+14.8 2012: R+18.4 2008: R+26.6
Not yet ingested
- Civics
- —
Market trends
- HPI YoY
- ▼ -89.87%
- Current HPI
- 161.7477
- Rent YoY
- ▲ 1.05%
- Metro
- New Orleans-Metairie, LA
- State GDP YoY
- ▲ 3.29%
- F500 in state
- 10
Industry mix (Fortune 500 HQ in LA)
| Industry | F500 HQs | Revenue |
|---|---|---|
| Telecommunications | 2 | $23B |
|
||
| Utilities | 1 | $12B |
|
||
| Wholesale / Distribution | 1 | $5B |
|
||
| Advertising | 1 | $2B |
|
||
Price history
+25.5% since first listed8 events — show timeline
- 2025-12-03 Pending — GSREIN
- 2025-11-29 Price Changed $225,000 AcadianaMLS
- 2025-11-08 Price Changed $225,000 GSREIN
- 2025-07-26 Listed $255,000 GSREIN
- 2025-07-26 Listed $255,000 AcadianaMLS
- 2007-06-05 Sold (MLS) $179,250 GSREIN
- 2007-06-04 Listed $179,250 AcadianaMLS
- 2007-06-04 Listed $179,250 GSREIN
Property tax history
+1.5%/yrLatest (2025): $2,462 · +0.3% YoY. Source: county tax records.
Cash-flow waterfall
monthlySold comps — $/sqft
last 12 mo · ≤1 miLoading sold comps…