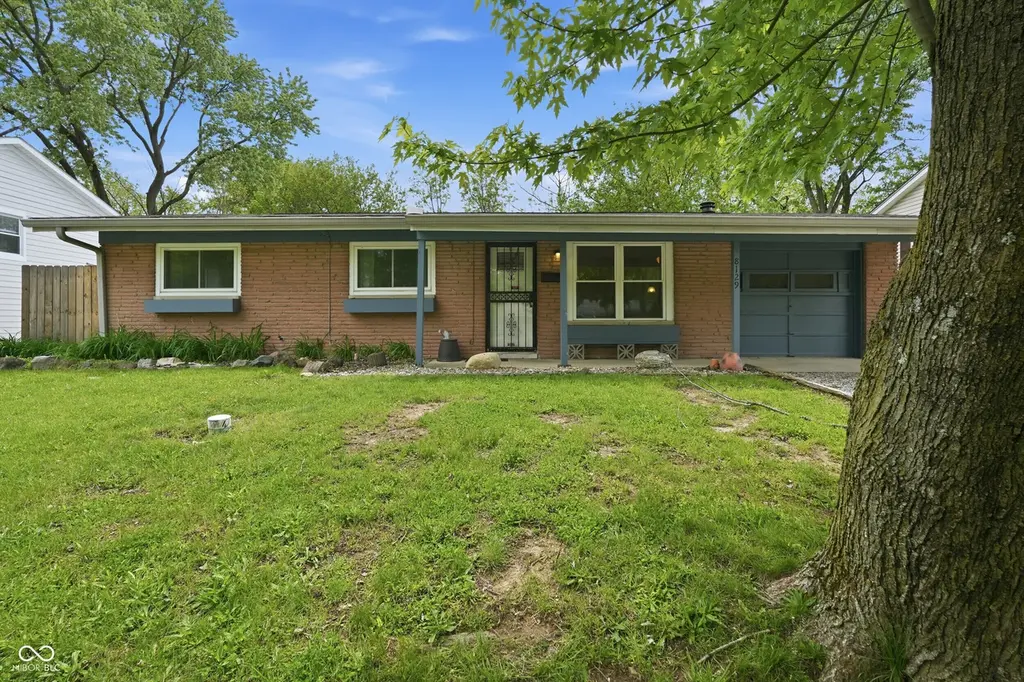
8129 E 36th Pl · Indianapolis city (balance), IN
Flood risk 1/10 · Minimal
- FEMA flood zone
- X (shaded)
- Chance of flooding over 30 yrs
- 0.0%
- Est. flood insurance / yr
- $507 – $1,088
Fire risk 1/10 · Minimal
- Est. fire insurance / yr
- $717 – $1,331
Heat risk 3/10 · Minor
- Hot days now (above 101°F)
- 7 days/yr
- Hot days in 30 yrs
- 18 days/yr
Wind risk 2/10 · Minimal
- Chance of severe wind over 30 yrs
- 1.0%
Air-quality risk 3/10 · Minor
- Unhealthy air days now
- 3 days/yr
- Unhealthy air days in 30 yrs
- 4 days/yr
Risk factors via First Street. Map © Google.
Why this score? — see what drove the C- grade
The composite is a weighted blend of 9 inputs, each scored 0–100. Each bar is that input's sub-score; the figure is the points it added to the 100-point composite (weight × sub-score).
- Cash flow +19.9/30.0
- ARV discount +11.2/15.0
- DSCR +6.3/10.0
- 1% rule +4.3/10.0
- Rent growth +4.2/5.0
- Livability +2.5/5.0
- Condition / age +2.5/5.0
- Schools +1.4/10.0
- Appreciation +0.0/10.0
$149,900
🖨 Deal sheet (PDF) 📄 Offer letter ✓ Due diligence
Listing remarks
Back on the market to no fault of the sellers. 8129 E 36th Place is a charming 3-bedroom, 1-bath bungalow on the Far Eastside, blending classic 1960s character with modern updates. Enjoy brand-new luxury vinyl plank flooring and peace of mind with a newer roof (just 6 years old). Major improvements within the past 4 years include water heater, windows, a beautifully updated bathroom and BRAND NEW furnace and A/C. The cozy den features a fireplace-perfect for relaxing winter evenings-while the private, fully fenced backyard offers a great space to unwind or entertain in warmer months. The former garage has been converted into a bonus room, adding valuable extra living space. For additional p
Key facts
- Newer roof
- Bonus room
- Updated bathroom
Tags
Property features AI
Exterior
- Parking: Attached garage (approx. 300 sq ft)
- Utilities: Public water; Municipal sewer connected; No solid waste service listed
- Home design: Single-family residence; One story
- Construction: Brick construction; Slab foundation
- Exterior features: Lot under 1/4 acre (0.18 acre)
Interior
- Kitchen: Microwave; Electric oven; Refrigerator
- Bedrooms: Three bedrooms on the main level (rooms approx. 10x10, 8x8, 8x8)
- Bathrooms: One full bathroom on the main level
- Heating & cooling: Electric heating; Central air conditioning
- Interior features: Eat-in kitchen; Family room fireplace
- Laundry & utility: Electric water heater
Neighborhood map
What this means for you Summary
Snapshot
- This is a 3-bed/1.0-bath single-family listed at $150k.
Deal economics
- At list price, monthly cash flow is $181 ($2k/yr) — positive.
- The deal already cash-flows at list — no discount required.
- To meet the 1% rule (rent ≥ 1% of price), the offer needs to be $139k (7.2% below list).
- Recommended offer: $139k (7.2% below list) — sets the bar for 1% rule.
- Cap rate 7.7% vs local median 4.4% in Indianapolis city (balance) — top-decile yield for the area; either an underpriced asset or a hidden risk that comps aren't pricing in. Stress-test before assuming the spread holds.
Location & tenants
- Location reads: area grade C — affects rentability + tenant quality, not the cash-flow math above.
- Indianapolis Public Schools (urban): math 14% / reading 20% proficiency, ranked #286 of 301 in IN (top 95%) — low school quality limits family demand, transient renter base, plan for 1-2y turnover; 77% free/reduced lunch — lower-income household profile, screen leases tightly.
- Zoned schools: Arsenal Technical High School (math 6% / reading 27%, grade F, #353 of 369 statewide, top 96%, 2,366 students, 74% FRL) — zoned schools at 74% FRL track the district average.
- Market conditions: Rents rising fast (+6.8%/yr); 153 active listings in the ZIP; 23 comparable units currently listed for rent nearby; rentals at typical pace (median 25d on market — plan ~3-4 weeks tenant-placement turnaround); 1,906 units permitted in Marion County in 2024 (621 in 5+ unit buildings).
- This rent runs 33% of the median local income ($50k/yr) — at the standard rent-burdened threshold; future hikes will face affordability resistance.
Forward outlook
- Local home prices are declining (-3.0%/yr); year-one equity from $1k of loan paydown is wiped out by about $4k of value loss. Plan a longer hold.
- Marion County population projected at +18% by 2050 — long-run rental-demand tailwind backs the buy-and-hold thesis.
- At projected returns (-3.0% appreciation + 6.8% rent growth), your $42k cash investment doubles in ~10 years — after that, you're playing with house money.
Negotiation context
- It's been on market 31 days — a 3% lower offer ($145k) is reasonable based on typical stale-listing flexibility.
- 2 sale attempts with the ask held roughly flat each time — persistent listings suggest the price (not the market) is what's stuck; bring a comps-based counter.
Questions for the listing agent
- It's been on market 31 days. Have you received any prior offers? Is the seller open to a 7% concession, seller financing, or rate buy-down credit?
- Built in 1960 — when were the roof, HVAC, electrical panel, plumbing, and water heater last replaced?
- Is there a deadline driving the sale (1031 exchange, divorce, estate, relocation)? That informs how much negotiation room exists.
- What's the average days-on-market for RENTAL listings here right now (not sales)? A rising rental-DOM trend means longer vacancies and softer asking-rent achievability than the comps imply.
- What's the recent tenant-quality profile in this submarket — average credit score on applications, eviction rate, late-payment / NSF rate, and stable-employment percentage? A property-management company in the area should have these aggregated.
- How much new for-sale + rental construction is in the pipeline within 1–3 miles? Heavy new supply typically softens prices + rents 12–24 months out; constrained supply supports both.
Investment metrics
- 1% rule
- 0.93% ✗
- Cap rate
- 7.74%
- Cash-on-cash
- 5.17%
- DSCR
- 1.23
- GRM
- 9.0
CMA / ARV
- ARV (median comp)
- $163,391
- List price
- $149,900
- Delta
- -8.26%
- Verdict
- FAIR
- Comps
- 20 within 1.0 mi
Show comp detail 12 sales within ~0.75 mi
| Address | Dist | Beds/Ba | Sqft | Sold | Price | $/sf | Match |
|---|---|---|---|---|---|---|---|
| 7838 Ridgewood Dr | 0.48mi | 3/1.5 | 936 (+1%) | 4mo | $135,000 | $144 | 70 |
| 3243 Wellington Ave | 0.53mi | 3/1.0 | 900 (-3%) | 3mo | $145,000 | $161 | 68 |
| 3938 Biscayne Rd | 0.71mi | 3/1.0 | 925 (0%) | 1mo | $132,000 | $143 | 66 |
| 8138 E 34th Pl | 0.18mi | 2/1.0 (-1) | 1,025 (+11%) | 5mo | $145,000 | $141 | 64 |
| 3732 Wellington Ave | 0.36mi | 3/1.0 | 999 (+8%) | 11mo | $145,000 | $145 | 61 |
| 3733 Harvest Ave | 0.23mi | 3/1.0 | 1,055 (+14%) | 7mo | $119,500 | $113 | 60 |
| 3965 Alsace Pl | 0.51mi | 3/1.0 | 864 (-7%) | 9mo | $189,000 | $219 | 58 |
| 8246 E 41st Pl | 0.71mi | 3/1.0 | 864 (-7%) | 1mo | $120,500 | $139 | 55 |
| 8340 E 41st Pl | 0.73mi | 3/1.0 | 864 (-7%) | 1mo | $140,000 | $162 | 54 |
| 3525 Lombardy Pl | 0.20mi | 4/2.0 (+1) | 1,047 (+13%) | 7mo | $180,000 | $172 | 54 |
| 7510 E 34th St | 0.66mi | 3/1.0 | 1,008 (+9%) | 4mo | $123,000 | $122 | 51 |
| 3117 Roseway Dr | 0.65mi | 3/1.0 | 1,000 (+8%) | 8mo | $169,900 | $170 | 50 |
Match score weights: distance 35% · size 25% · config 20% · recency 20%. Top-matched comps best support the ARV.
Projected returns pro-forma
-3.0% appreciation · 6.76% rent growth · sell at horizon
- IRR
- -4.5%
- Equity multiple
- 0.82×
- Total profit
- $-7,374
- Equity at exit
- $22,351
- IRR
- 8.7%
- Equity multiple
- 1.77×
- Total profit
- $32,399
- Equity at exit
- $12,961
Cash invested: $41,972 (down + closing). Projections, not guarantees.
Landlord ↔ Tenant lean methodology
- Overall (STATE)
- 90 Strongly Landlord-Friendly
- State Indiana
- 90 Strongly Landlord-Friendly · R+11
- County
- — inherits STATE
- City
- — inherits STATE
ZIP-level market 46226
- Rents YoY
- 6.8%
- Active inventory
- 153
- Price-to-rent
- 9.0×
Monthly cashflow live
- Estimated rent
- $1,391 high interval (Pro) →
- Mortgage (P&I)
- −$786
- Tax from tax record
- −$70 /mo · $834/yr
- Insurance
- −$62
- HOA
- −$0
- Vacancy / Maint / Mgmt
- −$292
- Net cashflow
- $181
Break-even live
Sensitivity live
| Price | -10% $266 | -5% $223 | +0% $181 | +5% $138 | +10% $96 |
|---|---|---|---|---|---|
| Rent | -10% $71 | -5% $126 | +0% $181 | +5% $236 | +10% $291 |
| Rate | -1.0pp $256 | -0.5pp $219 | base $181 | +0.5pp $142 | +1.0pp $102 |
UW: 25.0% down · 7.5% · 30yr · 1.5% tax · 5.0% vac · 8.0% maint · 8.0% mgmt
Financing live
Cash to close
- Down payment
- $37,475
- Closing costs
- $4,497
- Reserves months
- —
- Total cash needed
- —
Loan-product check · same deal, 3 products live
Conventional
25% down · 7.5% · 30yr
- Down + closing
- —
- Monthly P&I
- —
- Monthly cashflow
- —
- DSCR
- —
- Eligible?
- —
Personal DTI + credit; lowest rate.
DSCR
20% down · 8.5% · 30yr
- Down + closing
- —
- Monthly P&I
- —
- Monthly cashflow
- —
- DSCR
- —
- Eligible?
- —
No personal income docs; deal must DSCR.
Hard money
10% down · 12.0% · 12mo
- Down + closing
- —
- Monthly P&I
- —
- Monthly cashflow
- —
- DSCR
- —
- Eligible?
- —
Short-term bridge; refi at stabilization.
Rent comps 23 comps
| Address | Beds | Baths | Sqft | Rent | $/sqft | DOM | Units | Dist |
|---|---|---|---|---|---|---|---|---|
| 8124 E 37th Pl Indianapolis, IN | 3.0 | 1.0 | 925 | $1,350 | $1.46 | 0d | 1 | 0.24mi |
| 7838 Ridgewood Dr Indianapolis, IN | 3.0 | 2.0 | 936 | $1,540 | $1.65 | 45d | 1 | 0.46mi |
| 7838 Ridgewood Dr Indianapolis, IN | 3.0 | 2.0 | 936 | $1,540 | $1.65 | 25d | 1 | 0.46mi |
| 7975 Red Mill Dr Indianapolis, IN | 2.0 | 1.0 | 576 | $975 | $1.69 | 45d | 1 | 0.47mi |
| 7925 Crossbridge Dr Indianapolis, IN | 2.0 | 2.0 | 1072 | $1,200 | $1.12 | 45d | 1 | 0.47mi |
| 3226 Wellington Ave Indianapolis, IN | 3.0 | 1.0 | 900 | $1,149 | $1.28 | 12d | 1 | 0.55mi |
| 3631 Decamp Dr Indianapolis, IN | 3.0 | 1.0 | 1000 | $1,335 | $1.33 | 25d | 1 | 0.63mi |
| 3809 Biscayne Rd Indianapolis, IN | 2.0 | 1.5 | 992 | $1,020 | $1.03 | 16d | 1 | 0.64mi |
| 3938 Biscayne Rd Indianapolis, IN | 3.0 | 1.0 | 1000 | $1,895 | $1.90 | 4d | 1 | 0.73mi |
| 8724 Montery Rd Indianapolis, IN | 3.0 | 1.0 | 925 | $1,500 | $1.62 | 45d | 1 | 0.79mi |
| 8862 Bel Air Ct Indianapolis, IN | 3.0 | 1.0 | 1073 | $1,264 | $1.18 | 19d | 1 | 0.80mi |
| 4315 Aspen Way Indianapolis, IN | 3.0 | 1.0 | 1080 | $1,380 | $1.28 | 45d | 1 | 0.97mi |
| 3775 Allerton Pl Indianapolis, IN | 1.0–4.0 | 2.0 | 1068 | $1,617 | $1.51 | 15d | 1 | 1.00mi |
| 7171 Twin Oaks Dr Indianapolis, IN | 3.0 | 1.0–1.5 | 801 | $1,399 | $1.75 | 25d | 9 | 1.01mi |
| 9060 E 39th Pl Indianapolis, IN | 1.0–2.0 | 1.0–1.5 | 820 | $1,040 | $1.27 | 25d | 1 | 1.02mi |
| 9226 E 36th Pl Indianapolis, IN | 3.0 | 1.0 | 1073 | $1,250 | $1.16 | 9d | 1 | 1.03mi |
| 3525 Luewan Ct Indianapolis, IN | 4.0 | 1.0 | 1107 | $1,750 | $1.58 | 25d | 1 | 1.18mi |
| 7845 Bonita Ct Indianapolis, IN | 3.0 | 1.0 | 1073 | $1,400 | $1.30 | 9d | 1 | 1.22mi |
| 3519 Jerome Ct Indianapolis, IN | 4.0 | 1.0 | 1107 | $1,995 | $1.80 | 25d | 1 | 1.23mi |
| 7910 Roy Rd Indianapolis, IN | 3.0 | 1.0 | 1073 | $1,445 | $1.35 | 25d | 1 | 1.24mi |
| 3900 N Shadeland Ave Indianapolis, IN | 1.0–2.0 | 1.0 | 1070 | $1,075 | $1.00 | 4d | 6 | 1.32mi |
| 9438 Conried Dr Indianapolis, IN | 3.0 | 1.0 | 1094 | $1,445 | $1.32 | 5d | 1 | 1.36mi |
| 9519 Conried Dr Indianapolis, IN | 3.0 | 1.0 | 925 | $1,275 | $1.38 | 0d | 1 | 1.42mi |
Listing history 6 events
-
2026-06-21days on market $149,900 Active 31 DOM
-
2026-06-18days on market $149,900 Active 28 DOM
-
2026-06-17days on market $149,900 Active 27 DOM
-
2026-06-16days on market $149,900 Active 26 DOM
-
2026-06-15statusdays on market $149,900 Active 25 DOM
-
2026-05-05$155,000 Active 738-char remark
ⓘ Source: listings_history table (triggers on properties + properties_extension) + one-shot
backfill from property_details.listing_events for pre-trigger history.
Tax reassessment forecast IN · Partial reset (capped growth)
- Current annual tax
- $834 · $70/mo
- Projected year-2 tax
- $1,054 · $88/mo
- Expected delta
- +$220/yr (+$18/mo · 26.4%)
ⓘ Screening estimate from a state-policy table — verify with the county assessor before closing.
Climate risk First Street
- Flood 1/10 Low FEMA zone X (shaded) · 0% chance over 30 yrs
- Wildfire 1/10 Low
- Heat 3/10 Moderate 7 d/yr ≥101°F today · 18 d/yr by 30 yrs out
- Wind 2/10 Low 100% chance of damaging wind over 30 yrs
- Air quality 3/10 Moderate 3 unhealthy d/yr today · 4 by 30 yrs out
Nearby sold comps map
Loading sold comps map…
Walkable amenities ~0.75 mi
Loading nearby amenities…
Taxation est. · year 1
- Rental income
- $16,690
- − Mortgage interest
- −$8,397
- − Property taxes
- −$834
- − Insurance
- −$750
- − Repairs & maintenance
- −$1,335
- − Management
- −$1,335
- − Depreciation
- −$4,361
- Taxable loss
- −$322
- Est. tax savings @ 24.0%
- +$77
- After-tax cash flow
- $2,245/yr
For passive investors: Depreciation is non-cash, so a rental often shows a tax loss while cash-flowing — sheltering income. Rental losses are passive: they offset passive income freely, and up to $25,000/yr can offset ordinary (W-2) income if you actively participate and your MAGI is under $100k (phasing out to $0 by $150k); unused losses carry forward. On sale, claimed depreciation is recaptured at up to 25%, and gains may owe capital-gains tax (a 1031 exchange can defer both). Figures are a year-1 estimate at your 24.0% rate — not tax advice; consult a CPA.
Schools (NCES district)
- District
- Indianapolis Public Schools
- NCES district ID
- 1804770
- Math proficiency
- 14% ▼ -7.00%
- Reading proficiency
- 20% ▼ -3.00%
- Median HH income
- $32,034
- Composite
- 13.69/100
- National rank
- #9499
- State rank
- #286 of 301 in IN
Livability — Indianapolis city (balance)
No livability data for this city. (Only ~50 U.S. cities are tracked.)
Census & demographics
- Census place
- Indianapolis city (balance), IN
- County
- Marion County · 998,460 people
- City population
- 881,119
- Metro
- Indianapolis-Carmel-Anderson, IN
- Population (ZIP)
- 47,099
- Household income
- $50,325
- Rent vs Own
- Severe rent burden
- 2742.0
Population outlook (Marion County) Hauer SSP2
- Today (2025)
- 1,025,572 people
- By 2030
- 1,065,727 · +3.9%
- By 2040
- 1,141,577 · +11.3%
- By 2050
- 1,208,920 · +17.9%
- By 2075
- 1,367,288 · +33.3%
- By 2100
- 1,438,201 · +40.2%
Race, ethnicity, and origin ACS 2023
- Neighborhood character
- Diverse neighborhood (Simpson 0.62)
- Race & ethnicity
- Black 53% White 25% Hispanic / Latino 17% Two or more races 9% Asian 2%
- Hispanic origin (detail)
- Mexican 11%
- Common ancestry
- Lithuanian 1% Italian 1% Romanian 1%
- Foreign-born
- 11% · Canada
- Languages at home
- 86% English-only · Spanish 10% French/Haitian/Cajun 1% Other Asian/Pacific 1%
Political lean MEDSL · Marion
- 2024 margin
- Strong D (+27.7) · D 63.0% · R 35.3% · Other 1.7%
- 2008→2024 swing
- -0.7pp no change · 2008: 28.4pp · 2024: 27.7pp
- All cycles
- 2024: D+27.7 2020: D+29.1 2016: D+22.8 2012: D+22.2 2008: D+28.4
Not yet ingested
- Civics
- —
Market trends
- HPI YoY
- ▼ -218.85%
- Current HPI
- 239.43
- Rent YoY
- ▲ 6.76%
- Metro
- Indianapolis-Carmel-Anderson, IN
- State GDP YoY
- ▲ 2.90%
- F500 in state
- 18
Industry mix (Fortune 500 HQ in IN)
| Industry | F500 HQs | Revenue |
|---|---|---|
| Industrial Machinery | 2 | $37B |
|
||
| Healthcare | 1 | $177B |
|
||
| Pharmaceuticals | 1 | $45B |
|
||
| Metals / Steel | 1 | $18B |
|
||
| Agriculture | 1 | $17B |
|
||
| Packaging | 1 | $12B |
|
||
Price history
-3.3% since first listed4 events — show timeline
- 2026-06-15 Relisted — MIBOR as Distributed by MLS Grid
- 2026-05-29 Pending — MIBOR as Distributed by MLS Grid
- 2026-05-26 Price Changed $149,900 MIBOR as Distributed by MLS Grid
- 2026-05-05 Listed $155,000 MIBOR as Distributed by MLS Grid
Property tax history
+23.4%/yrLatest (2025): $834 · +32.2% YoY. Source: county tax records.
Cash-flow waterfall
monthlySold comps — $/sqft
last 12 mo · ≤1 miLoading sold comps…