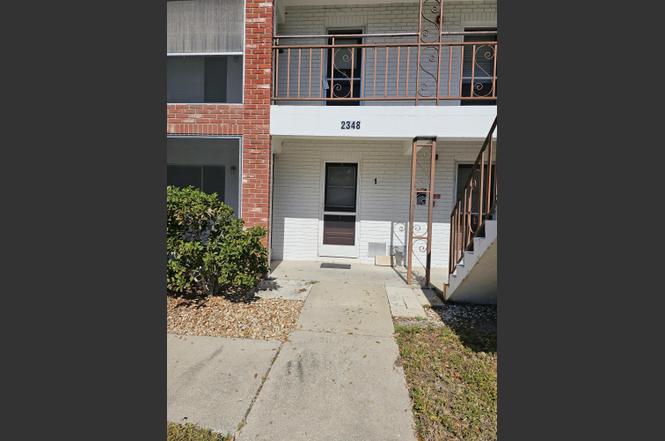
2348 Shelley St #1 · Clearwater, FL
Flood risk 1/10 · Minimal
- FEMA flood zone
- X (unshaded)
- Chance of flooding over 30 yrs
- 0.0%
- Est. flood insurance / yr
- $507 – $1,088
Fire risk 1/10 · Minimal
- Est. fire insurance / yr
- $947 – $1,759
Heat risk 10/10 · Severe
- Hot days now (above 107°F)
- 7 days/yr
- Hot days in 30 yrs
- 27 days/yr
Wind risk 10/10 · Severe
- Chance of severe wind over 30 yrs
- 99.0%
Air-quality risk 3/10 · Minor
- Unhealthy air days now
- 3 days/yr
- Unhealthy air days in 30 yrs
- 3 days/yr
Risk factors via First Street. Map © Google.
Why this score? — see what drove the C+ grade
The composite is a weighted blend of 9 inputs, each scored 0–100. Each bar is that input's sub-score; the figure is the points it added to the 100-point composite (weight × sub-score).
- Cash flow +26.2/30.0
- 1% rule +10.0/10.0
- DSCR +8.9/10.0
- ARV discount +7.5/15.0
- Schools +4.3/10.0
- Livability +4.1/5.0
- Condition / age +2.5/5.0
- Rent growth +1.3/5.0
- Appreciation +0.0/10.0
$99,000
🖨 Deal sheet 📄 Offer letter ✓ Due diligence
Listing remarks MLS
Beds and Dressers, Couch, 2 TVs, one TV Stand and Kitchen Table included in sale.
Key facts
- Galley kitchen
- Open living space
- First floor
Tags
Property features AI
Finance
- HOA & community: Monthly HOA fee of $430; Has an association; Senior community; Pets allowed (restrictions possible)
Exterior
- Utilities: Public water; Public sewer; Sewer available; Water available
- Home design: Condominium; Two-story building; Faces southeast; Resale condition
- Construction: CBS construction
- Exterior features: Screened porch; Porch
Interior
- Kitchen: Dishwasher; Electric range; Refrigerator
- Bedrooms: Two bedrooms on the main level
- Flooring: Terrazzo flooring
- Bathrooms: One full bathroom on the main level
- Heating & cooling: Central heating; Central air conditioning
- Interior features: Stacked bedroom layout; Unfurnished
Neighborhood map
What this means for you Summary
Snapshot
- This is a 2-bed/1.0-bath condo listed at $99k.
Deal economics
- At list price, monthly cash flow is $252 ($3k/yr) — positive.
- The deal already cash-flows at list — no discount required.
- Meets the 1% rule at list price ($2k rent vs $99k).
- Recommended offer: $87k (12.0% below list) — sets the bar for market timing.
- Cap rate 9.4% vs local median 2.9% in Clearwater — top-decile yield for the area; either an underpriced asset or a hidden risk that comps aren't pricing in. Stress-test before assuming the spread holds.
Location & tenants
- Location reads 82/100 on livability (#60 in FL, #988 nationally) — a professional / high-income tenant draw. Strengths: commute A+, housing A+, health & safety A+; Watch: schools C-, employment C-.
- Pinellas (suburban): math 51% / reading 51% proficiency, ranked #31 of 73 in FL (top 42%) — acceptable for families but not a draw, mixed tenant base, ~2y average lease.
- Market conditions: Rents falling (-4.6%/yr); 83 active listings in the ZIP; 40 comparable units currently listed for rent nearby; rentals leasing fast (median 13d on market — plan ~1-2 weeks tenant-placement turnaround); 2,676 units permitted in Pinellas County in 2024 (1,422 in 5+ unit buildings).
- This rent runs 31% of the median local income ($69k/yr) — at the standard rent-burdened threshold; future hikes will face affordability resistance.
Forward outlook
- Local home prices are declining (-3.0%/yr); year-one equity from $684 of loan paydown is wiped out by about $3k of value loss. Plan a longer hold.
- Pinellas County population projected at +14% by 2050 — modest demand growth; plan on rents tracking national, not racing it.
Negotiation context
- It's been on market 334 days — a 12% lower offer ($87k) is reasonable based on typical stale-listing flexibility.
- 6 sale attempts since 19y ago; this cycle's ask is 4862% above the opening price — seller raised mid-cycle; expect resistance to lowballs.
- Current owner paid $55k; list at $99k implies a 80% gain — meaningful room to come down on a strong offer.
Risks & watch-outs
- Watch-outs: HOA is 24% of rent.
- Climate carrying-cost: severe wind risk, 99% chance of damaging wind over 30y; extreme-heat days projected 7→27/yr by 2055 (HVAC capex compounding) — expect insurance premiums to compound above CPI over the hold.
Questions for the listing agent
- It's been on market 334 days. Have you received any prior offers? Is the seller open to a 12% concession, seller financing, or rate buy-down credit?
- Built in 1968 — when were the roof, HVAC, electrical panel, plumbing, and water heater last replaced?
- What does the HOA fee cover, when was the last increase, and are there any pending special assessments or reserve-fund shortfalls?
- Any open or pending special assessments — roof, HVAC, plumbing, elevator, façade? What's the per-unit balance and payoff schedule, and is the seller paying it off at close or rolling it to the buyer?
- Why hasn't it sold? Are there any deal-killer items the seller is aware of (foundation, flood, title, zoning, code violations)?
- Is there a deadline driving the sale (1031 exchange, divorce, estate, relocation)? That informs how much negotiation room exists.
- What's the average days-on-market for RENTAL listings here right now (not sales)? A rising rental-DOM trend means longer vacancies and softer asking-rent achievability than the comps imply.
- What's the recent tenant-quality profile in this submarket — average credit score on applications, eviction rate, late-payment / NSF rate, and stable-employment percentage? A property-management company in the area should have these aggregated.
- How much new apartment / multifamily construction is in the pipeline within 1–3 miles? Heavy new supply (>2% of stock underway) typically softens rents 12–24 months out; light construction supports rent growth.
Investment metrics
- 1% rule
- 1.79% ✓
- Cap rate
- 9.35%
- Cash-on-cash
- 10.92%
- DSCR
- 1.49
- GRM
- 4.7
CMA / ARV
No comps found within radius.
Projected returns pro-forma
-3.0% appreciation · 0.0% rent growth · sell at horizon
- IRR
- -4.9%
- Equity multiple
- 0.82×
- Total profit
- $-4,863
- Equity at exit
- $14,761
- IRR
- -1.6%
- Equity multiple
- 0.91×
- Total profit
- $-2,370
- Equity at exit
- $8,560
Cash invested: $27,720 (down + closing). Projections, not guarantees.
Landlord ↔ Tenant lean methodology
- Overall (STATE)
- 87 Strongly Landlord-Friendly
- State Florida
- 87 Strongly Landlord-Friendly · R+3
- County
- — inherits STATE
- City
- — inherits STATE
ZIP-level market 33765
- Home prices YoY
- -31.8%
- Rents YoY
- -4.6%
- Active inventory
- 83
- Price-to-rent
- 4.7×
Monthly cashflow live
- Estimated rent
- $1,774 high interval (Pro) →
- Mortgage (P&I)
- −$519
- Tax from tax record
- −$159 /mo · $1,907/yr
- Insurance
- −$41
- HOA
- −$430
- Vacancy / Maint / Mgmt
- −$373
- Net cashflow
- $252
Break-even live
UW: 25.0% down · 7.5% · 30yr · 1.5% tax · 5.0% vac · 8.0% maint · 8.0% mgmt
Financing live
Cash to close
- Down payment
- $24,750
- Closing costs
- $2,970
- Reserves months
- —
- Total cash needed
- —
Loan-product check · same deal, 3 products live
Conventional
25% down · 7.5% · 30yr
- Down + closing
- —
- Monthly P&I
- —
- Monthly cashflow
- —
- DSCR
- —
- Eligible?
- —
Personal DTI + credit; lowest rate.
DSCR
20% down · 8.5% · 30yr
- Down + closing
- —
- Monthly P&I
- —
- Monthly cashflow
- —
- DSCR
- —
- Eligible?
- —
No personal income docs; deal must DSCR.
Hard money
10% down · 12.0% · 12mo
- Down + closing
- —
- Monthly P&I
- —
- Monthly cashflow
- —
- DSCR
- —
- Eligible?
- —
Short-term bridge; refi at stabilization.
Rent comps 40 comps
| Address | Beds | Baths | Sqft | Rent | $/sqft | DOM | Units | Dist |
|---|---|---|---|---|---|---|---|---|
| 2348 Shelley St #9 Clearwater, FL | 2.0 | 1.0 | 950 | $2,200 | $2.32 | 24d | 1 | 0.01mi |
| 2353 Shelley St #11 Clearwater, FL | 1.0 | 1.0 | 585 | $1,150 | $1.97 | 24d | 1 | 0.03mi |
| 2366 Shelley St Clearwater, FL | 1.0 | 1.0 | 585 | $1,425 | $2.44 | 14d | 2 | 0.05mi |
| 2366 Shelley St #12 Clearwater, FL | 1.0 | 1.0 | 585 | $1,550 | $2.65 | 24d | 1 | 0.05mi |
| 2370 Chaucer St Clearwater, FL | 3.0 | 1.0 | 1100 | $2,500 | $2.27 | 4d | 1 | 0.05mi |
| 2381 Chaucer St Clearwater, FL | 2.0 | 1.0 | 1000 | $1,950 | $1.95 | 2d | 1 | 0.05mi |
| 2 N Fernwood Ave #14 Clearwater, FL | 2.0 | 1.0 | 800 | $1,550 | $1.94 | 13d | 1 | 0.24mi |
| 2 N Fernwood Ave Clearwater, FL | 2.0 | 1.0 | 800 | $1,650 | $2.06 | 24d | 1 | 0.24mi |
| 2346 Druid Rd #1106 Clearwater, FL | 2.0 | 2.0 | 1008 | $1,495 | $1.48 | 17d | 1 | 0.34mi |
| 25 N Belcher Rd Clearwater, FL | 1.0–2.0 | 1.0–2.0 | 780 | $2,026 | $2.60 | 2d | 12 | 0.37mi |
| 101 S Old Coachman Rd Clearwater, FL | 3.0 | 1.0–2.0 | 983 | $2,296 | $2.34 | 3d | 16 | 0.48mi |
| 2168 Druid Rd E Clearwater, FL | 1.0–3.0 | 1.0–2.0 | 1049 | $2,532 | $2.41 | 3d | 20 | 0.55mi |
| 308 Gunn Ave Unit 308 Clearwater, FL | 1.0 | 1.0 | 650 | $1,400 | $2.15 | 18d | 1 | 0.64mi |
| 300 Gunn Ave Unit 7 Clearwater, FL | 1.0 | 1.0 | 525 | $1,150 | $2.19 | 11d | 1 | 0.65mi |
| 300 Gunn Ave Unit 9 Clearwater, FL | 1.0 | 1.0 | 525 | $1,130 | $2.15 | 24d | 1 | 0.65mi |
| 20000 US Highway 19 N Unit 610 Clearwater, FL | 1.0 | 1.0 | 800 | $1,150 | $1.44 | 24d | 1 | 0.66mi |
| 20000 US Highway 19 N #612 Clearwater, FL | 2.0 | 2.0 | 800 | $1,300 | $1.62 | 24d | 1 | 0.69mi |
| 411 S Nimbus Ave Unit 3 Clearwater, FL | 1.0 | 1.0 | 700 | $1,395 | $1.99 | 18d | 1 | 0.76mi |
| 2025 Rogers St Clearwater, FL | 1.0–3.0 | 1.0–2.0 | 985 | $1,874 | $1.90 | 11d | 10 | 0.80mi |
| 730 N Old Coachman Rd Clearwater, FL | 2.0 | 2.0 | 950 | $1,705 | $1.79 | 3d | 3 | 0.82mi |
| 1001 Pearce Dr #302 Clearwater, FL | 1.0 | 1.5 | 1048 | $1,750 | $1.67 | 4d | 1 | 0.94mi |
| 2600 W Grand Reserve Cir Clearwater, FL | 1.0–3.0 | 1.0–2.0 | 1097 | $2,145 | $1.96 | 2d | 36 | 0.96mi |
| 2690 Drew St Clearwater, FL | 1.0–3.0 | 1.0–2.0 | 974 | $1,500 | $1.54 | 2d | 12 | 0.97mi |
| 2236 Morningside Dr Clearwater, FL | 2.0 | 1.5 | 902 | $2,200 | $2.44 | 4d | 1 | 0.98mi |
| 1330 Moreland Dr Clearwater, FL | 2.0 | 2.0 | 1192 | $2,125 | $1.78 | 24d | 3 | 0.98mi |
| 2430 Harn Blvd Unit 7 Clearwater, FL | 1.0 | 1.0 | 725 | $1,500 | $2.07 | 4d | 1 | 1.01mi |
| 2430 Harn Blvd Unit 14 Clearwater, FL | 1.0 | 1.0 | 725 | $1,400 | $1.93 | 24d | 1 | 1.01mi |
| 2060 Marilyn St #207 Clearwater, FL | 1.0 | 1.0 | 750 | $1,350 | $1.80 | 18d | 1 | 1.02mi |
| 2060 Marilyn St #127 Clearwater, FL | 1.0 | 1.0 | 750 | $1,350 | $1.80 | 24d | 1 | 1.04mi |
| 530 Fairwood Ave Clearwater, FL | 2.0–3.0 | 1.0–2.0 | 1042 | $1,309 | $1.26 | 2d | 27 | 1.08mi |
| 601 N Hercules Ave #508 Clearwater, FL | 2.0 | 2.0 | 945 | $1,650 | $1.75 | 24d | 1 | 1.09mi |
| 311 S Arcturas Ave Unit 3 Clearwater, FL | 1.0 | 1.0 | 775 | $1,200 | $1.55 | 11d | 1 | 1.11mi |
| 309 S Arcturas Ave #6 Clearwater, FL | 1.0 | 1.0 | 650 | $1,200 | $1.85 | 3d | 1 | 1.11mi |
| 310 S Arcturas Ave Unit 3 Clearwater, FL | 2.0 | 1.0 | 840 | $1,599 | $1.90 | 24d | 1 | 1.15mi |
| 2481 NE Coachman Rd Clearwater, FL | 1.0–2.0 | 1.0–2.0 | 762 | $2,023 | $2.65 | 2d | 14 | 1.18mi |
| 1903 Rainbow Dr Unit 10 Clearwater, FL | 2.0 | 1.0 | 850 | $1,500 | $1.76 | 24d | 1 | 1.18mi |
| 2729 Seville Blvd Clearwater, FL | 1.0–3.0 | 1.0–2.0 | 1057 | $2,432 | $2.30 | 2d | 33 | 1.19mi |
| 1433 S Belcher Rd Clearwater, FL | 1.0–2.0 | 1.0–2.0 | 748 | $2,450 | $3.27 | 20d | 2 | 1.22mi |
| 1433 S Belcher Rd Unit F9 Clearwater, FL | 2.0 | 2.0 | 855 | $2,450 | $2.87 | 2d | 1 | 1.26mi |
| 19355 US Highway 19 N Clearwater, FL | 1.0–3.0 | 1.0–2.0 | 1093 | $2,489 | $2.28 | 3d | 13 | 1.31mi |
HOA detail condo
- Monthly dues
- $430 · $5,160/yr
- Assessments
- None detected in remarks — confirm with the listing agent.
Listing history 32 events
-
2026-06-18days on market $99,000 Active 334 DOM
-
2026-06-17days on market $99,000 Active 333 DOM
-
2026-06-16days on market $99,000 Active 332 DOM
-
2026-06-15days on market $99,000 Active 331 DOM
-
2026-06-13days on market $99,000 Active 329 DOM
-
2026-06-09days on market $99,000 Active 325 DOM
-
2026-06-08days on market $99,000 Active 324 DOM
-
2026-06-07days on market $99,000 Active 323 DOM
-
2026-06-04days on market $99,000 Active 320 DOM
-
2026-06-03days on market $99,000 Active 319 DOM
-
2026-06-01days on market $99,000 Active 317 DOM
-
2026-05-31days on market $99,000 Active 316 DOM
-
2026-04-15price $99,000
-
2026-02-12price $110,000
-
2025-12-08price $112,500
-
2025-09-25price $114,900
-
2025-08-17$1,995
-
2025-07-19$119,900 Active
-
2025-06-01historical
-
2025-04-27price $135,000
-
2025-02-01price $145,000
-
2024-12-27price $159,900
-
2024-11-26$165,000 Active
-
2009-05-08soldstatus $55,000 81-char remark
Show marketing remark (81 chars)
Beds and Dressers, Couch, 2 TVs, one TV Stand and Kitchen Table included in sale.
-
2009-05-05soldstatus $55,000
-
2009-03-27$64,900 81-char remark
Show marketing remark (81 chars)
Beds and Dressers, Couch, 2 TVs, one TV Stand and Kitchen Table included in sale.
-
2007-11-26historical
-
2007-10-12$98,500
-
2007-07-11$98,500
-
2004-04-21soldstatus $52,000
-
2003-06-05soldstatus $15,000
-
1987-02-18soldstatus $31,000
ⓘ Source: listings_history table (triggers on properties + properties_extension) + one-shot
backfill from property_details.listing_events for pre-trigger history.
Tax reassessment forecast FL · Resets to sale price
- Current annual tax
- $1,907 · $159/mo
- Projected year-2 tax
- $1,907 · $159/mo
- Expected delta
- $0/yr ($0/mo · 0.0%)
ⓘ Screening estimate from a state-policy table — verify with the county assessor before closing.
Climate risk First Street
- Flood 1/10 Low FEMA zone X (unshaded) · 0% chance over 30 yrs
- Wildfire 1/10 Low
- Heat 10/10 Extreme 7 d/yr ≥107°F today · 27 d/yr by 30 yrs out
- Wind 10/10 Extreme 99% chance of damaging wind over 30 yrs
- Air quality 3/10 Moderate 3 unhealthy d/yr today · 3 by 30 yrs out
Nearby sold comps map
Loading sold comps map…
Walkable amenities ~0.75 mi
Loading nearby amenities…
Taxation est. · year 1
- Rental income
- $21,289
- − Mortgage interest
- −$5,546
- − Property taxes
- −$1,907
- − Insurance
- −$495
- − Repairs & maintenance
- −$1,703
- − Management
- −$1,703
- − HOA
- −$5,160
- − Depreciation
- −$2,880
- Taxable income
- $1,896
- Est. tax owed @ 24.0%
- −$455
- After-tax cash flow
- $2,572/yr
For passive investors: Depreciation is non-cash, so a rental often shows a tax loss while cash-flowing — sheltering income. Rental losses are passive: they offset passive income freely, and up to $25,000/yr can offset ordinary (W-2) income if you actively participate and your MAGI is under $100k (phasing out to $0 by $150k); unused losses carry forward. On sale, claimed depreciation is recaptured at up to 25%, and gains may owe capital-gains tax (a 1031 exchange can defer both). Figures are a year-1 estimate at your 24.0% rate — not tax advice; consult a CPA.
Schools (NCES district)
- District
- Pinellas
- NCES district ID
- 1201560
- Math proficiency
- 51% ▼ -5.00%
- Reading proficiency
- 51% ▼ -3.00%
- Median HH income
- $46,270
- Composite
- 43.27/100
- National rank
- #3046
- State rank
- #31 of 73 in FL
Livability — Clearwater
- Score
- 82/100
- State rank
- #60
- US rank
- #988
Category grades
Schools grade is shown separately in the Schools card above.
Census & demographics
- Census place
- Clearwater, FL
- County
- Pinellas County · 939,478 people
- City population
- 170,933
- Metro
- Tampa-St. Petersburg-Clearwater, FL
- Population (ZIP)
- 13,808
- Household income
- $69,199
- Rent vs Own
- Severe rent burden
- 604.0
Population outlook (Pinellas County) Hauer SSP2
- Today (2025)
- 1,027,532 people
- By 2030
- 1,063,586 · +3.5%
- By 2040
- 1,125,020 · +9.5%
- By 2050
- 1,168,637 · +13.7%
- By 2075
- 1,265,188 · +23.1%
- By 2100
- 1,260,357 · +22.7%
Race, ethnicity, and origin ACS 2023
- Neighborhood character
- Diverse neighborhood (Simpson 0.55)
- Race & ethnicity
- White 63% Hispanic / Latino 19% Two or more races 13% Black 8% Asian 7%
- Hispanic origin (detail)
- Mexican 7% Puerto Rican 4% Cuban 1%
- Common ancestry
- Romanian 3% Slovak 2% Italian 2%
- Foreign-born
- 22% · Canada, Jamaica, Vietnam
- Languages at home
- 71% English-only · Spanish 17% Other Indo-European 6% Vietnamese 2%
Political lean MEDSL · Pinellas
- 2024 margin
- Lean R (+5.2) · D 46.9% · R 52.1%
- 2008→2024 swing
- -13.5pp toward R · 2008: 8.3pp · 2024: -5.2pp
- All cycles
- 2024: R+5.2 2020: D+0.2 2016: R+1.1 2012: D+5.6 2008: D+8.3
Not yet ingested
- Civics
- —
Market trends
- HPI YoY
- ▼ -146.56%
- Current HPI
- 314.4864
- Rent YoY
- ▼ -4.61%
- Metro
- Tampa-St. Petersburg-Clearwater, FL
- State GDP YoY
- ▲ 3.28%
- F500 in state
- 36
Industry mix (Fortune 500 HQ in FL)
| Industry | F500 HQs | Revenue |
|---|---|---|
| Industrial Technology | 2 | $29B |
|
||
| Insurance | 2 | $17B |
|
||
| Retail | 1 | $60B |
|
||
| Technology Distribution | 1 | $58B |
|
||
| Homebuilding | 1 | $35B |
|
||
| Technology Manufacturing | 1 | $35B |
|
||
Price history
+219.4% since first listed20 events — show timeline
- 2026-04-15 Price Changed $99,000 Beaches MLS
- 2026-02-12 Price Changed $110,000 Beaches MLS
- 2025-12-08 Price Changed $112,500 Beaches MLS
- 2025-09-25 Price Changed $114,900 Beaches MLS
- 2025-08-17 Listed for Rent $1,995 REDFIN
- 2025-07-19 Listed $119,900 Beaches MLS
- 2025-06-01 Listing Removed — Beaches MLS
- 2025-04-27 Price Changed $135,000 Beaches MLS
- 2025-02-01 Price Changed $145,000 Beaches MLS
- 2024-12-27 Price Changed $159,900 Beaches MLS
- 2024-11-26 Listed $165,000 Beaches MLS
- 2009-05-08 Sold (MLS) $55,000 Stellar MLS as Distributed by MLS Grid
- 2009-05-05 Sold (Public Records) $55,000 Public Records
- 2009-03-27 Listed $64,900 Stellar MLS as Distributed by MLS Grid
- 2007-11-26 Listing Removed — Stellar MLS as Distributed by MLS Grid
- 2007-10-12 Listed $98,500 Stellar MLS as Distributed by MLS Grid
- 2007-07-11 Listed $98,500 Stellar MLS as Distributed by MLS Grid
- 2004-04-21 Sold (Public Records) $52,000 Public Records
- 2003-06-05 Sold (Public Records) $15,000 Public Records
- 1987-02-18 Sold (Public Records) $31,000 Public Records
Property tax history
+9.6%/yrLatest (2025): $1,907 · +15.0% YoY. Source: county tax records.
Cash-flow waterfall
monthlySold comps — $/sqft
last 12 mo · ≤1 miLoading sold comps…