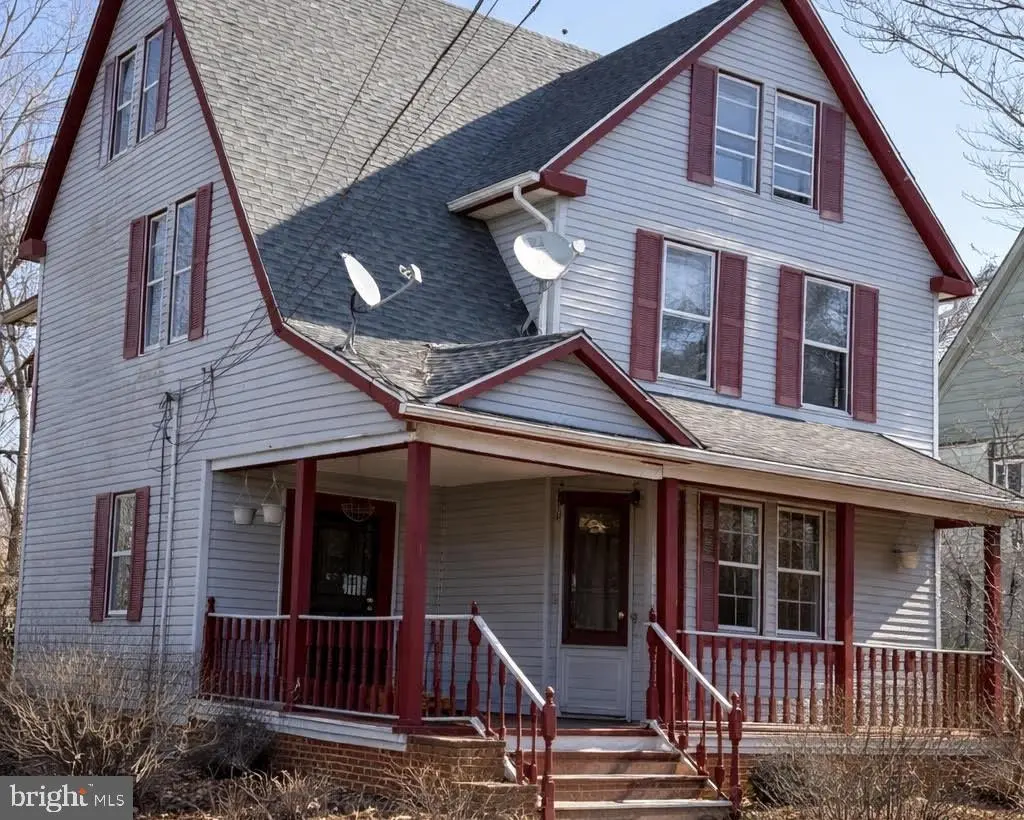
3 Circle Dr · Browns Mills, NJ
Flood risk 1/10 · Minimal
- FEMA flood zone
- X (unshaded)
- Chance of flooding over 30 yrs
- 0.0%
- Est. flood insurance / yr
- $507 – $1,088
Fire risk 5/10 · Moderate
- Est. fire insurance / yr
- $526 – $976
Heat risk 6/10 · Moderate
- Hot days now (above 103°F)
- 7 days/yr
- Hot days in 30 yrs
- 15 days/yr
Wind risk 6/10 · Moderate
- Chance of severe wind over 30 yrs
- 62.0%
Air-quality risk 4/10 · Minor
- Unhealthy air days now
- 4 days/yr
- Unhealthy air days in 30 yrs
- 5 days/yr
Risk factors via First Street. Map © Google.
Why this score? — see what drove the D grade
The composite is a weighted blend of 9 inputs, each scored 0–100. Each bar is that input's sub-score; the figure is the points it added to the 100-point composite (weight × sub-score).
- ARV discount +15.0/15.0
- Cash flow +10.3/30.0
- 1% rule +3.8/10.0
- Livability +3.2/5.0
- DSCR +3.0/10.0
- Rent growth +2.5/5.0
- Condition / age +2.5/5.0
- Schools +2.3/10.0
- Appreciation +0.0/10.0
$339,900
🖨 Deal sheet 📄 Offer letter ✓ Due diligence
Listing remarks MLS
With over 2,800 sqft, this isn't your typical property! Enjoy the screened-in wraparound porch, spacious rooms and soaring ceilings with exposed beams- creating a warm, inviting feel. Situated on a spacious half-acre lot, this home is within walking distance to the beautiful mirror lake and nearby shopping. Inside offers a clean slate with stunning woodwork and endless potential. Layout offers the possibility of two living spaces, featuring a full bathroom and kitchen on each level. Also has a full basement. HUGE Home. Call to schedule your private tour. Being sold as-is
Key facts
- Built 1925
- Listed 61 days
Neighborhood map
What this means for you Summary
Snapshot
- This is a 4-bed/2.0-bath single-family listed at $340k.
Deal economics
- At list price, monthly cash flow is $-185 ($-2k/yr) — negative.
- To cash-flow at today's rent, offer at most $307k (9.6% below list).
- To meet the 1% rule (rent ≥ 1% of price), the offer needs to be $300k (11.7% below list).
- Recommended offer: $300k (11.7% below list) — sets the bar for 1% rule.
Location & tenants
- Location reads 63/100 on livability (#436 in NJ) — a middle-class / working-renter tenant base. Strengths: housing A+, health & safety B+, cost of living B; Watch: schools F, amenities F, commute F.
- Pemberton Township School District (rural): math 12% / reading 38% proficiency, ranked #382 of 472 in NJ (top 81%) — low school quality limits family demand, transient renter base, plan for 1-2y turnover.
- Market conditions: 116 active listings in the ZIP; 1 comparable units currently listed for rent nearby; 2,161 units permitted in Burlington County in 2024 (988 in 5+ unit buildings).
Forward outlook
- Local home prices are declining (-3.0%/yr); year-one equity from $2k of loan paydown is wiped out by about $10k of value loss. Plan a longer hold.
- Burlington County population projected to shrink 5% by 2050 — rents likely to lag national; underwrite the cash flow, not the appreciation.
Negotiation context
- It's been on market 62 days — a 6% lower offer ($320k) is reasonable based on typical stale-listing flexibility.
- Current owner paid $115k; list at $340k implies a 196% gain — meaningful room to come down on a strong offer.
Risks & watch-outs
- Watch-outs: built in 1925 — expect roof / HVAC / electrical / plumbing capex.
- Climate carrying-cost: major wind risk, 62% chance of damaging wind over 30y; moderate wildfire risk; extreme-heat days projected 7→15/yr by 2055 (HVAC capex compounding) — expect insurance premiums to compound above CPI over the hold.
Questions for the listing agent
- What do current leases actually rent for vs. the listed asking? Can we see a recent rent roll and the last 12 months of T-12 income?
- It's been on market 62 days. Have you received any prior offers? Is the seller open to a 12% concession, seller financing, or rate buy-down credit?
- Built in 1925 — when were the roof, HVAC, electrical panel, plumbing, and water heater last replaced?
- Why hasn't it sold? Are there any deal-killer items the seller is aware of (foundation, flood, title, zoning, code violations)?
- Is there a deadline driving the sale (1031 exchange, divorce, estate, relocation)? That informs how much negotiation room exists.
- Schools are F-rated, which usually means shorter tenancies and higher turnover. Who's the typical renter profile here, and what's been the actual vacancy rate?
- The area grade is low — what's the realistic commute time and amenity access for the typical tenant pool here? Any planned neighborhood developments (good or bad) we should know about?
- What's the average days-on-market for RENTAL listings here right now (not sales)? A rising rental-DOM trend means longer vacancies and softer asking-rent achievability than the comps imply.
- What's the recent tenant-quality profile in this submarket — average credit score on applications, eviction rate, late-payment / NSF rate, and stable-employment percentage? A property-management company in the area should have these aggregated.
- How much new for-sale + rental construction is in the pipeline within 1–3 miles? Heavy new supply typically softens prices + rents 12–24 months out; constrained supply supports both.
Investment metrics
- 1% rule
- 0.88% ✗
- Cap rate
- 5.64%
- Cash-on-cash
- -2.33%
- DSCR
- 0.90
- GRM
- 9.4
CMA / ARV
- ARV (median comp)
- $441,355
- List price
- $339,900
- Delta
- -22.99%
- Verdict
- UNDERPRICED
- Comps
- 19 within 1.0 mi
Show comp detail 3 sales within ~0.75 mi
| Address | Dist | Beds/Ba | Sqft | Sold | Price | $/sf | Match |
|---|---|---|---|---|---|---|---|
| 18 Rancocas Ln | 0.21mi | 4/3.5 | 3,074 (+8%) | 13mo | $381,500 | $124 | 59 |
| 115 Hanover | 0.72mi | 4/3.5 | 2,664 (-6%) | 8mo | $454,000 | $170 | 43 |
| 301 W Lakeshore Dr | 0.69mi | 4/3.5 | 2,624 (-8%) | 8mo | $570,000 | $217 | 42 |
Match score weights: distance 35% · size 25% · config 20% · recency 20%. Top-matched comps best support the ARV.
Projected returns pro-forma
-3.0% appreciation · 3.0% rent growth · sell at horizon
- IRR
- -20.1%
- Equity multiple
- 0.30×
- Total profit
- $-66,666
- Equity at exit
- $50,680
- IRR
- -13.0%
- Equity multiple
- 0.24×
- Total profit
- $-72,497
- Equity at exit
- $29,388
Cash invested: $95,172 (down + closing). Projections, not guarantees.
Landlord ↔ Tenant lean methodology
- Overall (STATE)
- 21 Tenant-Leaning
- State New Jersey
- 21 Tenant-Leaning · D+6
- County
- — inherits STATE
- City
- — inherits STATE
ZIP-level market 08015
- Home prices YoY
- -23.1%
- Active inventory
- 116
- Price-to-rent
- 9.4×
Monthly cashflow live
- Estimated rent
- $3,000 medium interval (Pro) →
- Mortgage (P&I)
- −$1,782
- Tax from tax record
- −$631 /mo · $7,566/yr
- Insurance
- −$142
- HOA
- −$0
- Vacancy / Maint / Mgmt
- −$630
- Net cashflow
- $-185
Break-even live
UW: 25.0% down · 7.5% · 30yr · 1.5% tax · 5.0% vac · 8.0% maint · 8.0% mgmt
Financing live
Cash to close
- Down payment
- $84,975
- Closing costs
- $10,197
- Reserves months
- —
- Total cash needed
- —
Loan-product check · same deal, 3 products live
Conventional
25% down · 7.5% · 30yr
- Down + closing
- —
- Monthly P&I
- —
- Monthly cashflow
- —
- DSCR
- —
- Eligible?
- —
Personal DTI + credit; lowest rate.
DSCR
20% down · 8.5% · 30yr
- Down + closing
- —
- Monthly P&I
- —
- Monthly cashflow
- —
- DSCR
- —
- Eligible?
- —
No personal income docs; deal must DSCR.
Hard money
10% down · 12.0% · 12mo
- Down + closing
- —
- Monthly P&I
- —
- Monthly cashflow
- —
- DSCR
- —
- Eligible?
- —
Short-term bridge; refi at stabilization.
Rent comps 1 comps
| Address | Beds | Baths | Sqft | Rent | $/sqft | DOM | Units | Dist |
|---|---|---|---|---|---|---|---|---|
| 42 Monroe Ave Browns Mills, NJ | 5.0 | 2.0 | 1976 | $3,000 | $1.52 | 43d | 1 | 0.51mi |
Listing history 20 events
-
2026-06-18days on market $339,900 Active 62 DOM
-
2026-06-17days on market $339,900 Active 61 DOM
-
2026-06-16days on market $339,900 Active 60 DOM
-
2026-06-15days on market $339,900 Active 59 DOM
-
2026-06-13days on market $339,900 Active 57 DOM
-
2026-06-13days on market $339,900 Active 56 DOM
-
2026-06-09days on market $339,900 Active 53 DOM
-
2026-06-08days on market $339,900 Active 52 DOM
-
2026-06-07days on market $339,900 Active 51 DOM
-
2026-06-04days on market $339,900 Active 48 DOM
-
2026-06-03days on market $339,900 Active 47 DOM
-
2026-06-02days on market $339,900 Active 46 DOM
-
2026-06-01days on market $339,900 Active 45 DOM
-
2026-05-31days on market $339,900 Active 44 DOM
-
2026-05-09price $339,900 577-char remark
Show marketing remark (577 chars)
With over 2,800 sqft, this isn't your typical property! Enjoy the screened-in wraparound porch, spacious rooms and soaring ceilings with exposed beams- creating a warm, inviting feel. Situated on a spacious half-acre lot, this home is within walking distance to the beautiful mirror lake and nearby shopping. Inside offers a clean slate with stunning woodwork and endless potential. Layout offers the possibility of two living spaces, featuring a full bathroom and kitchen on each level. Also has a full basement. HUGE Home. Call to schedule your private tour. Being sold as-is
-
2026-04-18$350,000 Active 577-char remark
Show marketing remark (577 chars)
With over 2,800 sqft, this isn't your typical property! Enjoy the screened-in wraparound porch, spacious rooms and soaring ceilings with exposed beams- creating a warm, inviting feel. Situated on a spacious half-acre lot, this home is within walking distance to the beautiful mirror lake and nearby shopping. Inside offers a clean slate with stunning woodwork and endless potential. Layout offers the possibility of two living spaces, featuring a full bathroom and kitchen on each level. Also has a full basement. HUGE Home. Call to schedule your private tour. Being sold as-is
-
2026-04-02historical $350,000 577-char remark
Show marketing remark (577 chars)
With over 2,800 sqft, this isn't your typical property! Enjoy the screened-in wraparound porch, spacious rooms and soaring ceilings with exposed beams- creating a warm, inviting feel. Situated on a spacious half-acre lot, this home is within walking distance to the beautiful mirror lake and nearby shopping. Inside offers a clean slate with stunning woodwork and endless potential. Layout offers the possibility of two living spaces, featuring a full bathroom and kitchen on each level. Also has a full basement. HUGE Home. Call to schedule your private tour. Being sold as-is
-
1993-05-27soldstatus $115,000
-
1993-02-08soldstatus $115,000
-
1987-01-23soldstatus $75,000
ⓘ Source: listings_history table (triggers on properties + properties_extension) + one-shot
backfill from property_details.listing_events for pre-trigger history.
Tax reassessment forecast NJ · Partial reset (capped growth)
- Current annual tax
- $7,566 · $631/mo
- Projected year-2 tax
- $8,015 · $668/mo
- Expected delta
- +$449/yr (+$37/mo · 5.9%)
ⓘ Screening estimate from a state-policy table — verify with the county assessor before closing.
Climate risk First Street
- Flood 1/10 Low FEMA zone X (unshaded) · 0% chance over 30 yrs
- Wildfire 5/10 Major
- Heat 6/10 Major 7 d/yr ≥103°F today · 15 d/yr by 30 yrs out
- Wind 6/10 Major 62% chance of damaging wind over 30 yrs
- Air quality 4/10 Moderate 4 unhealthy d/yr today · 5 by 30 yrs out
Nearby sold comps map
Loading sold comps map…
Walkable amenities ~0.75 mi
Loading nearby amenities…
Taxation est. · year 1
- Rental income
- $36,000
- − Mortgage interest
- −$19,040
- − Property taxes
- −$7,566
- − Insurance
- −$1,700
- − Repairs & maintenance
- −$2,880
- − Management
- −$2,880
- − Depreciation
- −$9,888
- Taxable loss
- −$7,954
- Est. tax savings @ 24.0%
- +$1,909
- After-tax cash flow
- $-307/yr
For passive investors: Depreciation is non-cash, so a rental often shows a tax loss while cash-flowing — sheltering income. Rental losses are passive: they offset passive income freely, and up to $25,000/yr can offset ordinary (W-2) income if you actively participate and your MAGI is under $100k (phasing out to $0 by $150k); unused losses carry forward. On sale, claimed depreciation is recaptured at up to 25%, and gains may owe capital-gains tax (a 1031 exchange can defer both). Figures are a year-1 estimate at your 24.0% rate — not tax advice; consult a CPA.
Schools (NCES district)
- District
- Pemberton Township School District
- NCES district ID
- 3412810
- Math proficiency
- 12% ▼ -14.00%
- Reading proficiency
- 38% ▼ -5.00%
- Median HH income
- $60,951
- Composite
- 23.0/100
- National rank
- #7979
- State rank
- #382 of 472 in NJ
Livability — Browns Mills
- Score
- 63/100
- State rank
- #436
- US rank
- #15864
Category grades
Schools grade is shown separately in the Schools card above.
Census & demographics
- Census place
- Browns Mills, NJ
- Population (ZIP)
- 19,143
Population outlook (Burlington County) Hauer SSP2
- Today (2025)
- 453,425 people
- By 2030
- 452,359 · -0.2%
- By 2040
- 445,033 · -1.9%
- By 2050
- 431,760 · -4.8%
- By 2075
- 406,277 · -10.4%
- By 2100
- 364,732 · -19.6%
Race, ethnicity, and origin ACS 2023
- Neighborhood character
- Diverse neighborhood (Simpson 0.56)
- Race & ethnicity
- White 63% Hispanic / Latino 14% Black 13% Two or more races 10% Asian 3%
- Hispanic origin (detail)
- Mexican 2% Puerto Rican 10%
- Common ancestry
- Romanian 3% Slovak 2% Serbian 2%
- Foreign-born
- 6% · Canada, Jamaica, South Korea
- Languages at home
- 87% English-only · Spanish 7% French/Haitian/Cajun 3% Tagalog/Filipino 1%
Political lean MEDSL · Burlington
- 2024 margin
- D (+16.6) · D 57.6% · R 41.0% · Other 1.3%
- 2008→2024 swing
- -2.0pp toward R · 2008: 18.6pp · 2024: 16.6pp
- All cycles
- 2024: D+16.6 2020: D+19.5 2016: D+14.8 2012: D+18.7 2008: D+18.6
Not yet ingested
- Civics
- —
Market trends
- HPI YoY
- ▼ -98.84%
- Current HPI
- 329.1731
- Rent YoY
- —
- Metro
- —
- State GDP YoY
- ▲ 2.05%
- F500 in state
- 34
Industry mix (Fortune 500 HQ in NJ)
| Industry | F500 HQs | Revenue |
|---|---|---|
| Consumer Goods | 3 | $31B |
|
||
| Pharmaceuticals | 2 | $153B |
|
||
| Technology | 2 | $21B |
|
||
| Insurance | 2 | $20B |
|
||
| Healthcare | 2 | $19B |
|
||
| Financial Services | 1 | $70B |
|
||
Price history
+353.2% since first listed6 events — show timeline
- 2026-05-09 Price Changed $339,900 BRIGHT MLS
- 2026-04-18 Listed $350,000 BRIGHT MLS
- 2026-04-02 Coming Soon $350,000 BRIGHT MLS
- 1993-05-27 Sold (Public Records) $115,000 Public Records
- 1993-02-08 Sold (Public Records) $115,000 Public Records
- 1987-01-23 Sold (Public Records) $75,000 Public Records
Property tax history
+4.3%/yrLatest (2025): $7,566 · +6.1% YoY. Source: county tax records.
Cash-flow waterfall
monthlySold comps — $/sqft
last 12 mo · ≤1 miLoading sold comps…