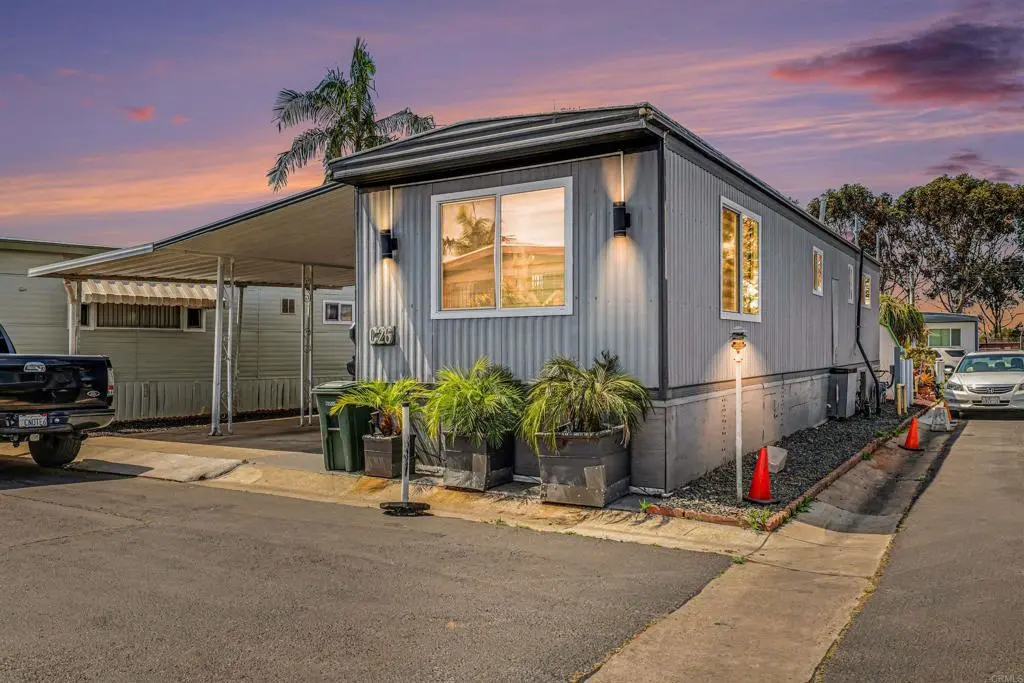
731 G St Spc C26 · Chula Vista, CA
Flood risk 1/10 · Minimal
- FEMA flood zone
- X (unshaded)
- Chance of flooding over 30 yrs
- 0.0%
- Est. flood insurance / yr
- $507 – $1,088
Fire risk 1/10 · Minimal
- Est. fire insurance / yr
- $659 – $1,223
Heat risk 4/10 · Minor
- Hot days now (above 87°F)
- 7 days/yr
- Hot days in 30 yrs
- 20 days/yr
Wind risk 1/10 · Minimal
- Chance of severe wind over 30 yrs
- —
Air-quality risk 1/10 · Minimal
- Unhealthy air days now
- 0 days/yr
- Unhealthy air days in 30 yrs
- 0 days/yr
Risk factors via First Street. Map © Google.
Why this score? — see what drove the B grade
The composite is a weighted blend of 9 inputs, each scored 0–100. Each bar is that input's sub-score; the figure is the points it added to the 100-point composite (weight × sub-score).
- Cash flow +29.6/30.0
- DSCR +10.0/10.0
- 1% rule +8.3/10.0
- ARV discount +7.5/15.0
- Condition / age +4.0/5.0
- Schools +3.9/10.0
- Livability +3.8/5.0
- Rent growth +3.1/5.0
- Appreciation +0.0/10.0
$149,000
🖨 Deal sheet 📄 Offer letter ✓ Due diligence
Listing remarks
Welcome to this beautifully upgraded 1-bedroom, 1-bathroom manufactured home perfectly situated in the desirable Cabrillo Mobile Lodge. This home seamlessly blends convenience with a touch of luxury, featuring high-end upgrades including a built-in water filtration system, stylish newer flooring, and a fresh, contemporary interior paint palette. Experience ultimate privacy and light control at the touch of a button with custom remote-control window shutters. One of the standout features of this home is the partially enclosed patio, a versatile bonus area perfect for a home office, hobby room, or a peaceful morning retreat. Location is everything! You are just minutes away from the premier s
Key facts
- 6.58 acre lot
- Parking
- Pool
Property features AI
Finance
- Other: Park address: 731 G St Spc C26, Chula Vista, CA; Directions: from Fwy5 east on H, left on Woodlawn Ave to the end of the street, on your left side. Second entrance, corner lot.
- Financial info: Land lease of $950 per month
- HOA & community: Senior community; Community amenities include biking and park access; Manager approval required
Exterior
- Parking: One parking space; One carport space; Located in Cabrillo Mobile Lodge LLC
- Utilities: Public sewer
- Home design: Single-story mobile home; Mobile dimensions approximately 12' x 52'; Mobile home remains on site
- Construction: Mobile construction
- Exterior features: Private pool; Park nearby; Has a view
Interior
- Bathrooms: One full bathroom
- Heating & cooling: Central cooling; Wall/window unit cooling
- Interior features: One-level home; Bonus room; Entry on main level
- Laundry & utility: Has laundry; Gas dryer hookup
Neighborhood map
What this means for you Summary
Snapshot
- This is a 1-bed/1.0-bath manufactured listed at $149k. Condition is rated good.
Deal economics
- At list price, monthly cash flow is $537 ($6k/yr) — positive.
- The deal already cash-flows at list — no discount required.
- Meets the 1% rule at list price ($2k rent vs $149k).
- Recommended offer: $140k (6.0% below list) — sets the bar for market timing.
- Cap rate 10.6% vs local median 2.7% in Chula Vista — top-decile yield for the area; either an underpriced asset or a hidden risk that comps aren't pricing in. Stress-test before assuming the spread holds.
Location & tenants
- Location reads 75/100 on livability (#127 in CA, #4,345 nationally) — a middle-class / working-renter tenant base. Strengths: amenities A+, commute A+, employment A+; Watch: health & safety C-, cost of living F.
- Sweetwater Union High (suburban): math 36% / reading 52% proficiency, ranked #187 of 517 in CA (top 36%) — families likely to look elsewhere, expect single-tenant / working-renter base with shorter leases.
- Market conditions: Rents rising (+2.4%/yr); 128 active listings in the ZIP; 40 comparable units currently listed for rent nearby; rentals leasing fast (median 2d on market — plan ~1-2 weeks tenant-placement turnaround); solid renter incomes; 11,759 units permitted in San Diego County in 2024 (7,244 in 5+ unit buildings).
Forward outlook
- Local home prices are declining (-3.0%/yr); year-one equity from $1k of loan paydown is wiped out by about $4k of value loss. Plan a longer hold.
- San Diego County population projected at +20% by 2050 — long-run rental-demand tailwind backs the buy-and-hold thesis.
- At projected returns (-3.0% appreciation + 2.4% rent growth), your $42k cash investment doubles in ~9 years — after that, you're playing with house money.
Negotiation context
- It's been on market 62 days — a 6% lower offer ($140k) is reasonable based on typical stale-listing flexibility.
Questions for the listing agent
- It's been on market 62 days. Have you received any prior offers? Is the seller open to a 6% concession, seller financing, or rate buy-down credit?
- Built in 1973 — when were the roof, HVAC, electrical panel, plumbing, and water heater last replaced?
- Why hasn't it sold? Are there any deal-killer items the seller is aware of (foundation, flood, title, zoning, code violations)?
- Is there a deadline driving the sale (1031 exchange, divorce, estate, relocation)? That informs how much negotiation room exists.
- Schools are B-rated — typically a magnet for longer-tenancy family renters. What's the average tenant stay here, and is there a school-zone premium baked into asking?
- What's the average days-on-market for RENTAL listings here right now (not sales)? A rising rental-DOM trend means longer vacancies and softer asking-rent achievability than the comps imply.
- What's the recent tenant-quality profile in this submarket — average credit score on applications, eviction rate, late-payment / NSF rate, and stable-employment percentage? A property-management company in the area should have these aggregated.
- How much new for-sale + rental construction is in the pipeline within 1–3 miles? Heavy new supply typically softens prices + rents 12–24 months out; constrained supply supports both.
Investment metrics
- 1% rule
- 1.33% ✓
- Cap rate
- 10.62%
- Cash-on-cash
- 15.44%
- DSCR
- 1.69
- GRM
- 6.3
CMA / ARV
- ARV (on-the-fly)
- $86,736
- Comps found
- 3
Show comp detail 3 sales within ~0.75 mi
| Address | Dist | Beds/Ba | Sqft | Sold | Price | $/sf | Match |
|---|---|---|---|---|---|---|---|
| 731 G Unit B13 | 0.04mi | 1/1.0 | 624 (0%) | 24mo | $74,900 | $120 | 78 |
| 677 G St Unit 103.5 | 0.14mi | 1/1.0 | 552 (-12%) | 1mo | $106,000 | $192 | 74 |
| 100 Woodlawn Ave Spc 93 | 0.55mi | 2/1.0 (+1) | 576 (-8%) | 14mo | $80,000 | $139 | 44 |
Match score weights: distance 35% · size 25% · config 20% · recency 20%. Top-matched comps best support the ARV.
Projected returns pro-forma
-3.0% appreciation · 2.44% rent growth · sell at horizon
- IRR
- 5.6%
- Equity multiple
- 1.21×
- Total profit
- $8,962
- Equity at exit
- $22,216
- IRR
- 14.5%
- Equity multiple
- 2.14×
- Total profit
- $47,439
- Equity at exit
- $12,883
Cash invested: $41,720 (down + closing). Projections, not guarantees.
Landlord ↔ Tenant lean methodology
- Overall (STATE)
- 18 Strongly Tenant-Friendly
- State California
- 18 Strongly Tenant-Friendly · D+13
- County
- — inherits STATE
- City
- — inherits STATE
ZIP-level market 91910
- Rents YoY
- 2.4%
- Active inventory
- 128
- Price-to-rent
- 6.3×
Monthly cashflow live
- Estimated rent
- $1,983 high interval (Pro) →
- Mortgage (P&I)
- −$781
- Tax est. 1.5%
- −$186 /mo · $2,235/yr
- Insurance
- −$62
- HOA
- −$0
- Vacancy / Maint / Mgmt
- −$416
- Net cashflow
- $537
Break-even live
UW: 25.0% down · 7.5% · 30yr · 1.5% tax · 5.0% vac · 8.0% maint · 8.0% mgmt
Financing live
Cash to close
- Down payment
- $37,250
- Closing costs
- $4,470
- Reserves months
- —
- Total cash needed
- —
Loan-product check · same deal, 3 products live
Conventional
25% down · 7.5% · 30yr
- Down + closing
- —
- Monthly P&I
- —
- Monthly cashflow
- —
- DSCR
- —
- Eligible?
- —
Personal DTI + credit; lowest rate.
DSCR
20% down · 8.5% · 30yr
- Down + closing
- —
- Monthly P&I
- —
- Monthly cashflow
- —
- DSCR
- —
- Eligible?
- —
No personal income docs; deal must DSCR.
Hard money
10% down · 12.0% · 12mo
- Down + closing
- —
- Monthly P&I
- —
- Monthly cashflow
- —
- DSCR
- —
- Eligible?
- —
Short-term bridge; refi at stabilization.
Rent comps 40 comps
| Address | Beds | Baths | Sqft | Rent | $/sqft | DOM | Units | Dist |
|---|---|---|---|---|---|---|---|---|
| 535 Woodlawn Ave Chula Vista, CA | 1.0–2.0 | 1.0 | 693 | $1,950 | $2.81 | 2d | 7 | 0.38mi |
| 245 Woodlawn Ave Chula Vista, CA | 1.0–2.0 | 1.0–2.0 | 723 | $1,850 | $2.56 | 2d | 4 | 0.38mi |
| 260 Broadway Chula Vista, CA | 1.0 | 1.0 | 640 | $2,195 | $3.43 | 2d | 1 | 0.38mi |
| 521 Park Way Unit 525-10 Chula Vista, CA | 1.0 | 1.0 | 415 | $1,600 | $3.86 | 10d | 1 | 0.49mi |
| 521 Park Way Unit 515-02 Chula Vista, CA | 1.0 | 1.0 | 415 | $1,750 | $4.22 | 3d | 1 | 0.49mi |
| 521 G St Unit C Chula Vista, CA | 2.0 | 1.0 | 650 | $2,100 | $3.23 | 2d | 1 | 0.49mi |
| 511 Center St Chula Vista, CA | 2.0 | 1.0 | 744 | $2,195 | $2.95 | 2d | 1 | 0.53mi |
| 120 Madison Ave Unit 120-A Chula Vista, CA | 1.0 | 1.0 | 442 | $1,654 | $3.74 | 13d | 1 | 0.66mi |
| 106 Madison Ave Chula Vista, CA | 1.0 | 1.0 | 567 | $1,885 | $3.32 | 2d | 1 | 0.70mi |
| 106 Madison Ave Chula Vista, CA | 1.0 | 1.0 | 567 | $1,885 | $3.32 | 17d | 1 | 0.70mi |
| 462 Davidson St Apt B Chula Vista, CA | 1.0 | 1.0 | 450 | $1,995 | $4.43 | 2d | 1 | 0.71mi |
| 456 Davidson St Chula Vista, CA | 1.0 | 1.0 | 415 | $1,695 | $4.08 | 2d | 1 | 0.72mi |
| 456 Davidson St Chula Vista, CA | 2.0 | 1.0 | 700 | $2,495 | $3.56 | 10d | 1 | 0.72mi |
| 518 Flower St Apt A Chula Vista, CA | 1.0 | 1.0 | 600 | $1,800 | $3.00 | 5d | 1 | 0.74mi |
| 518 Flower St Chula Vista, CA | 1.0 | 1.0 | 600 | $1,800 | $3.00 | 2d | 1 | 0.74mi |
| 415 Park Way Apt L Chula Vista, CA | 1.0 | 1.0 | 475 | $1,795 | $3.78 | 2d | 1 | 0.75mi |
| 160 Brightwood Ave #161 Chula Vista, CA | 1.0 | 1.0 | 630 | $1,895 | $3.01 | 2d | 1 | 0.81mi |
| 490 Fourth Ave #8 Chula Vista, CA | 1.0 | 1.0 | 700 | $2,000 | $2.86 | 2d | 1 | 0.82mi |
| 393 H St Chula Vista, CA | 1.0–2.0 | 1.0–2.5 | 913 | $2,525 | $2.76 | 2d | 17 | 0.90mi |
| 615 Sea Vale St Chula Vista, CA | 1.0–2.0 | 1.0–2.0 | 785 | $2,044 | $2.60 | 2d | 10 | 0.91mi |
| 551-581 Mc Intosh St Chula Vista, CA | 1.0 | 1.0 | 400 | $1,625 | $4.06 | 2d | 1 | 0.93mi |
| 363 H St Chula Vista, CA | 1.0 | 1.0 | 640 | $1,900 | $2.97 | 2d | 4 | 0.94mi |
| 383 Mankato St Chula Vista, CA | 1.0 | 1.0 | 668 | $1,875 | $2.81 | 2d | 1 | 0.96mi |
| 515 Glover Ave Chula Vista, CA | 1.0–3.0 | 1.0–2.0 | 900 | $2,045 | $2.27 | 2d | 1 | 0.99mi |
| 580 Glover Ave Chula Vista, CA | 1.0 | 1.0 | 600 | $1,800 | $3.00 | 2d | 1 | 0.99mi |
| 540 C St Chula Vista, CA | 1.0 | 1.0 | 600 | $2,000 | $3.33 | 2d | 2 | 1.01mi |
| 163 Glover Ave Unit 163D Chula Vista, CA | 1.0 | 1.0 | 700 | $1,700 | $2.43 | 17d | 1 | 1.03mi |
| 750 Cedar Ave Chula Vista, CA | 1.0 | 1.0 | 450 | $2,500 | $5.56 | 2d | 1 | 1.04mi |
| 229 Landis Ave Apt D Chula Vista, CA | 1.0 | 1.0 | 620 | $1,825 | $2.94 | 16d | 1 | 1.07mi |
| 351355 I St Unit 351-3 Chula Vista, CA | 1.0 | 1.0 | 650 | $1,599 | $2.46 | 24d | 1 | 1.07mi |
| 351355 I St Unit 355-J Chula Vista, CA | 1.0 | 1.0 | 650 | $1,599 | $2.46 | 2d | 1 | 1.07mi |
| 345 I St Chula Vista, CA | 1.0 | 1.0 | 675 | $1,900 | $2.81 | 2d | 1 | 1.09mi |
| 288 Center St Chula Vista, CA | 1.0 | 1.0 | 717 | $2,360 | $3.29 | 2d | 2 | 1.10mi |
| 305 E St Chula Vista, CA | 1.0 | 1.0 | 602 | $1,968 | $3.27 | 2d | 1 | 1.13mi |
| 252 Church Ave Chula Vista, CA | 1.0 | 1.0 | 672 | $2,538 | $3.78 | 2d | 4 | 1.13mi |
| 230 Church Ave Chula Vista, CA | 1.0 | 1.0 | 630 | $2,395 | $3.80 | 2d | 6 | 1.15mi |
| 245 Church Ave Chula Vista, CA | — | 1.0 | 418 | $1,895 | $4.53 | 2d | 1 | 1.17mi |
| 245 Church Ave Chula Vista, CA | — | 1.0 | 357 | $1,895 | $5.31 | 11d | 1 | 1.17mi |
| 122 Third Ave Chula Vista, CA | 1.0 | 1.0 | 650 | $2,095 | $3.22 | 2d | 1 | 1.20mi |
| 252 Davidson St Unit 256 Davidson Chula Vista, CA | 1.0 | 1.0 | 475 | $1,750 | $3.68 | 2d | 1 | 1.20mi |
Listing history 9 events
-
2026-06-09days on market $149,000 Active 62 DOM
-
2026-06-08days on market $149,000 Active 61 DOM
-
2026-06-07days on market $149,000 Active 60 DOM
-
2026-06-04days on market $149,000 Active 57 DOM
-
2026-06-03days on market $149,000 Active 56 DOM
-
2026-06-02days on market $149,000 Active 55 DOM
-
2026-06-01days on market $149,000 Active 54 DOM
-
2026-05-31pricedays on market $149,000 Active 53 DOM
-
2026-04-08$159,000 Active
ⓘ Source: listings_history table (triggers on properties + properties_extension) + one-shot
backfill from property_details.listing_events for pre-trigger history.
Climate risk First Street
- Flood 1/10 Low FEMA zone X (unshaded) · 0% chance over 30 yrs
- Wildfire 1/10 Low
- Heat 4/10 Moderate 7 d/yr ≥87°F today · 20 d/yr by 30 yrs out
- Wind 1/10 Low
- Air quality 1/10 Low 0 unhealthy d/yr today · 0 by 30 yrs out
Nearby sold comps map
Loading sold comps map…
Walkable amenities ~0.75 mi
Loading nearby amenities…
Taxation est. · year 1
- Rental income
- $23,795
- − Mortgage interest
- −$8,346
- − Property taxes
- −$2,235
- − Insurance
- −$745
- − Repairs & maintenance
- −$1,904
- − Management
- −$1,904
- − Depreciation
- −$4,335
- Taxable income
- $4,327
- Est. tax owed @ 24.0%
- −$1,038
- After-tax cash flow
- $5,403/yr
For passive investors: Depreciation is non-cash, so a rental often shows a tax loss while cash-flowing — sheltering income. Rental losses are passive: they offset passive income freely, and up to $25,000/yr can offset ordinary (W-2) income if you actively participate and your MAGI is under $100k (phasing out to $0 by $150k); unused losses carry forward. On sale, claimed depreciation is recaptured at up to 25%, and gains may owe capital-gains tax (a 1031 exchange can defer both). Figures are a year-1 estimate at your 24.0% rate — not tax advice; consult a CPA.
Condition & rehab AI · 12 photos
This beautifully upgraded 1-bedroom, 1-bathroom manufactured home is move-in ready with modern amenities and a fresh paint job. It offers a great location and is ready for a new owner to make it their own.
Value-add opportunities
- Both Painting exterior and interior — Enhances curb appeal and interior aesthetics
- Both Landscaping improvements — Enhances curb appeal and adds value
- Both New flooring — Improves living space and adds value
Renovation cost estimate screening
Value-add ROI direction
- Both Painting exterior and interior — Enhances curb appeal and interior aesthetics ↑
- Both Landscaping improvements — Enhances curb appeal and adds value ↑
- Both New flooring — Improves living space and adds value ↑
ⓘ Cost ranges are severity-bucket heuristics (US national rule-of-thumb). Get contractor quotes + a written scope before underwriting a rehab budget.
Schools (NCES district)
- District
- Sweetwater Union High
- NCES district ID
- 0638640
- Math proficiency
- 36% ▲ 3.00%
- Reading proficiency
- 52% ▼ -2.00%
- Median HH income
- $59,051
- Composite
- 38.61/100
- National rank
- #4158
- State rank
- #187 of 517 in CA
Livability — Chula Vista
- Score
- 75/100
- State rank
- #127
- US rank
- #4345
Category grades
Schools grade is shown separately in the Schools card above.
Census & demographics
- Census place
- Chula Vista, CA
- County
- San Diego County · 3,178,799 people
- City population
- 255,708
- Metro
- San Diego-Chula Vista-Carlsbad, CA
- Population (ZIP)
- 77,123
- Household income
- $90,222
- Rent vs Own
- Severe rent burden
- 4172.0
Population outlook (San Diego County) Hauer SSP2
- Today (2025)
- 3,678,185 people
- By 2030
- 3,856,546 · +4.8%
- By 2040
- 4,171,407 · +13.4%
- By 2050
- 4,421,607 · +20.2%
- By 2075
- 4,831,599 · +31.4%
- By 2100
- 4,832,502 · +31.4%
Race, ethnicity, and origin ACS 2023
- Neighborhood character
- Majority Hispanic (64%)
- Race & ethnicity
- Hispanic / Latino 64% Two or more races 29% White 19% Asian 10% Black 4% Native American 1%
- Hispanic origin (detail)
- Mexican 60%
- Common ancestry
- Lithuanian 1% Italian 1% Romanian 1%
- Foreign-born
- 29% · Canada, South Korea, Vietnam
- Languages at home
- 43% English-only · Spanish 49% Tagalog/Filipino 4% Other Asian/Pacific 1%
Political lean MEDSL · San Diego
- 2024 margin
- D (+16.8) · D 56.9% · R 40.1% · Other 2.9%
- 2008→2024 swing
- +6.6pp toward D · 2008: 10.2pp · 2024: 16.8pp
- All cycles
- 2024: D+16.8 2020: D+22.8 2016: D+17.8 2012: D+5.1 2008: D+10.2
Not yet ingested
- Civics
- —
Market trends
- HPI YoY
- ▼ -673.82%
- Current HPI
- 357.1172
- Rent YoY
- ▲ 2.44%
- Metro
- San Diego-Chula Vista-Carlsbad, CA
- State GDP YoY
- ▲ 3.21%
- F500 in state
- 116
Industry mix (Fortune 500 HQ in CA)
| Industry | F500 HQs | Revenue |
|---|---|---|
| Technology | 27 | $1,492B |
|
||
| Financial Services | 3 | $174B |
|
||
| Retail | 3 | $44B |
|
||
| Insurance | 3 | $26B |
|
||
| Media / Entertainment | 2 | $115B |
|
||
| Pharmaceuticals / Biotech | 2 | $62B |
|
||
Price history
1 event — show timeline
- 2026-04-08 Listed $159,000 CRMLS
Cash-flow waterfall
monthlySold comps — $/sqft
last 12 mo · ≤1 miLoading sold comps…